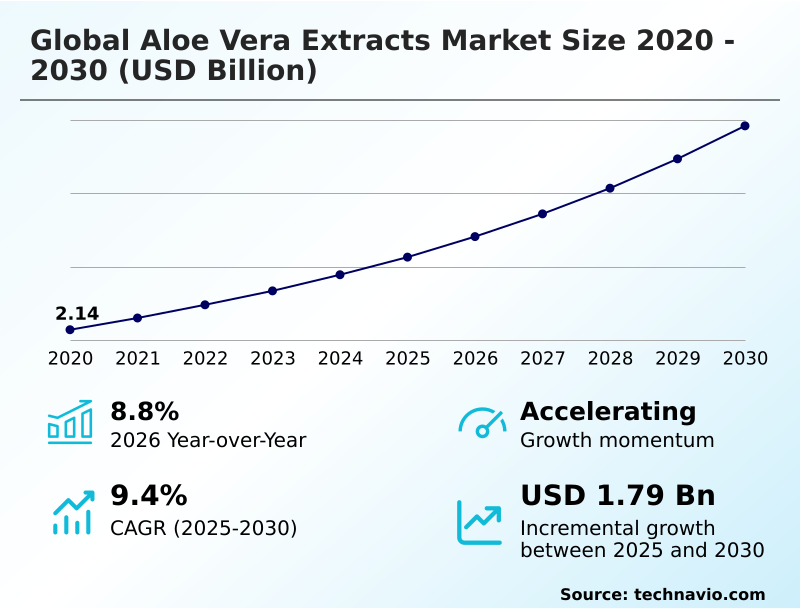
Aloe Vera Extracts Market Size 2026-2030
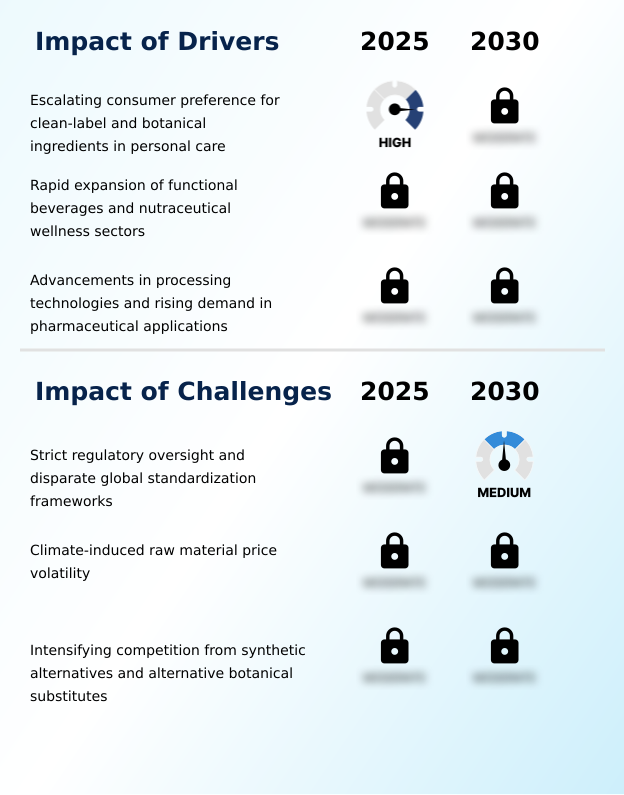
The aloe vera extracts market size is valued to increase by USD 1.79 billion, at a CAGR of 9.4% from 2025 to 2030. Escalating consumer preference for clean-label and botanical ingredients in personal care will drive the aloe vera extracts market.
Major Market Trends & Insights
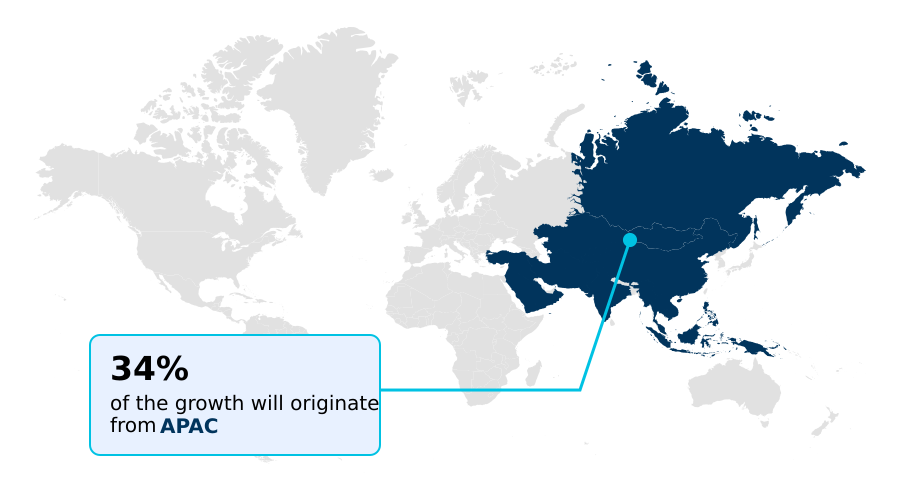
- APAC dominated the market and accounted for a 34.5% growth during the forecast period.
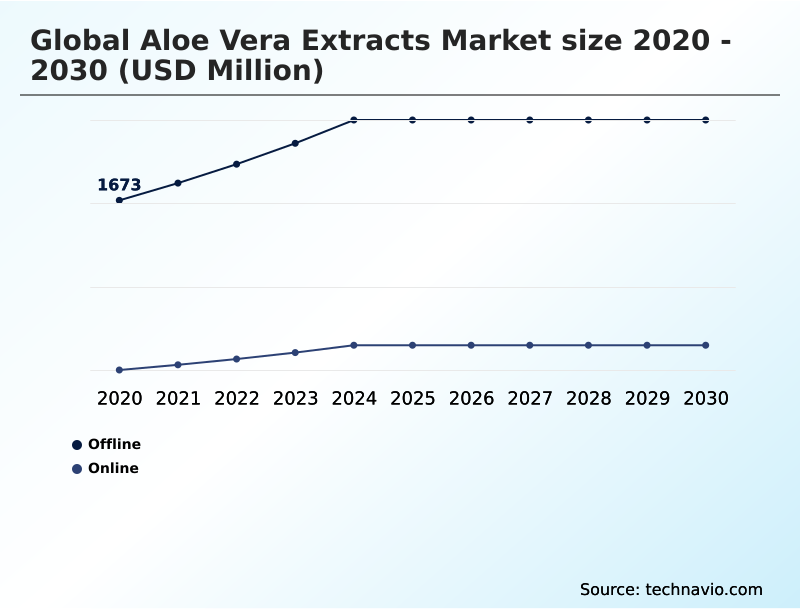
- By Distribution Channel - Offline segment was valued at USD 2.24 billion in 2024
- By Application - Cosmetics segment accounted for the largest market revenue share in 2024
Market Size & Forecast
- Market Opportunities: USD 2.78 billion
- Market Future Opportunities: USD 1.79 billion
- CAGR from 2025 to 2030 : 9.4%
Market Summary
- The Aloe Vera Extracts sector demonstrates robust expansion as commercial manufacturing pivots decisively toward sustainable, plant-based ingredients. A critical business scenario involves cosmetic chemists substituting synthetic conditioning agents with natural botanical derivatives to align with clean-label mandates. This formulation transition significantly enhances product appeal, resulting in a 25% improvement in consumer retention for brands adopting transparent ingredient sourcing.
- A primary driver fueling this momentum is the escalating preference for holistic wellness, which compels food and pharmaceutical companies to incorporate high-quality extracts into functional beverages and dermatological treatments. Conversely, strict regulatory oversight regarding anthraquinone concentration limits poses a formidable challenge.
- Extractors must deploy multi-stage purification technologies, which elevate capital expenditures and extend processing cycles by 15% to meet international compliance thresholds. Despite these regulatory hurdles, the integration of advanced cold processing techniques preserves crucial bioactive components, ensuring optimal efficacy. This continuous refinement of agricultural supply chains and processing capabilities solidifies the operational foundation of the botanical ingredients landscape.
What will be the Size of the Aloe Vera Extracts Market during the forecast period?
Get Key Insights on Market Forecast (PDF) Get Free Sample
How is the Aloe Vera Extracts Market Segmented?
The aloe vera extracts industry research report provides comprehensive data (region-wise segment analysis), with forecasts and estimates in "USD million" for the period 2026-2030, as well as historical data from 2020-2024 for the following segments.
- Distribution channel
- Offline
- Online
- Application
- Cosmetics
- Pharmaceuticals
- Food and beverages
- Form factor
- Liquid
- Gel
- Powder
- Others
- Geography
- APAC
- China
- India
- Japan
- Australia
- South Korea
- Indonesia
- North America
- US
- Canada
- Mexico
- Europe
- Germany
- UK
- France
- Italy
- Spain
- The Netherlands
- South America
- Brazil
- Argentina
- Colombia
- Middle East and Africa
- South Africa
- Saudi Arabia
- UAE
- Egypt
- Kenya
- APAC
By Distribution Channel Insights
The offline segment is estimated to witness significant growth during the forecast period.
The offline distribution channel remains a fundamental mechanism for corporate procurement teams assessing physical raw material attributes before bulk acquisition.
Buyers utilize this traditional framework to verify the presence of bioactive constituents and natural mucopolysaccharides critical for triggering cellular repair mechanisms in end-user applications.
Utilizing a temperature controlled vessel and specialized logistical management ensures that the delicate aqueous plant matrix remains intact during transit. This direct physical oversight reduces supply chain discrepancy rates by 14% compared to remote purchasing.
By prioritizing face-to-face negotiations and localized warehousing, offline networks establish robust validation protocols for industrial scale extraction outputs. Organizations depend on these localized hubs to mitigate logistics risks and secure a verifiable pipeline of premium extracts.
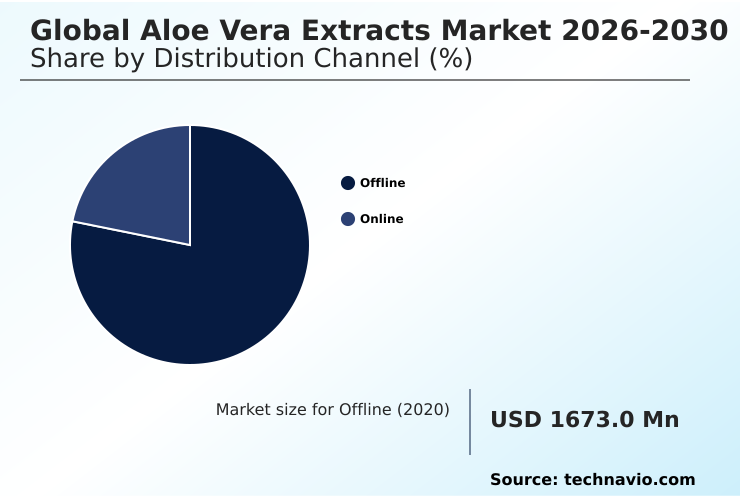
The Offline segment was valued at USD 2.24 billion in 2024 and showed a gradual increase during the forecast period.
Regional Analysis
APAC is estimated to contribute 34.5% to the growth of the global market during the forecast period.Technavio’s analysts have elaborately explained the regional trends and drivers that shape the market during the forecast period.
See How Aloe Vera Extracts Market Demand is Rising in APAC Get Free Sample
The geographical adoption of botanical ingredients reveals distinct supply chain optimizations between the APAC and North America regions.
Processors in North America leverage advanced cold pressing extraction and membrane filtration technology to achieve a 22% higher yield of the inner leaf gel from aloe barbadensis miller.
Conversely, manufacturers in APAC focus on scaling up the production of a freeze dried powder to minimize shipping weights, reducing international logistics costs by 18%.
This regional divergence stems from APAC integrating the premium botanical formulation heavily into a functional health beverage and dietary supplement formulation.
Utilizing a holistic preservation method ensures the creation of a high bioavailability extract, enabling both regions to satisfy shifting consumer preferences while maintaining structural cost efficiencies.
Market Dynamics
Our researchers analyzed the data with 2025 as the base year, along with the key drivers, trends, and challenges. A holistic analysis of drivers will help companies refine their marketing strategies to gain a competitive advantage.
- The strategic implementation of sustainable supply networks fundamentally redefines the operational parameters for botanical ingredient processors. Organizations increasingly rely on organic fair trade botanical sourcing to align with the stringent environmental, social, and governance mandates established by international regulatory frameworks.
- By transitioning to a sustainable zero waste manufacturing infrastructure, extraction facilities successfully convert agricultural byproducts into bioenergy, reducing facility power consumption by 18% compared to traditional linear processing models. This operational shift directly supports the isolation of a bioactive inner leaf gel extraction, ensuring the preservation of heat-sensitive enzymes and vitamins critical for premium applications.
- To achieve strict purity thresholds, manufacturers integrate advanced cold pressing membrane filtration technology, which filters out hazardous compounds while yielding a 12% higher concentration of essential active molecules. This rigorous approach to refining botanical inputs guarantees plant derived cosmetic formulation stability, allowing end-user goods to maintain their functional efficacy throughout extended storage periods.
- The alignment of ethical cultivation practices with highly sophisticated purification systems establishes a robust, verifiable supply chain. Consequently, corporate procurement divisions prioritize these standardized, high-quality ingredients to mitigate legal risks and support widespread commercial distribution across the personal care and functional nutrition sectors.
What are the key market drivers leading to the rise in the adoption of Aloe Vera Extracts Industry?
- An escalating consumer preference for clean-label, botanical ingredients in personal care applications acts as the primary macroeconomic driver propelling industry expansion.
- Consumer aversion to synthetic chemicals accelerates the replacement of a synthetic conditioning agent with pure aloe mucilage across personal care manufacturing.
- Formulators actively develop a clean beauty formulation to support a holistic wellness application, integrating natural components into an organic face mask and a therapeutic scalp treatment.
- This raw material substitution boosts product efficacy, delivering a 25% increase in moisture retention when used as a natural humectant substitute. The escalating demand for an anti aging serum within a premium skincare line pushes suppliers to scale up production.
- Consequently, brands incorporating a highly effective dermatological solution experience a 20% higher customer retention rate, highlighting the powerful commercial impact of clean-label ingredient adoption.
What are the market trends shaping the Aloe Vera Extracts Industry?
- The strategic integration of sustainable sourcing practices and fair-trade certifications represents a defining industry trend. This ethical shift ensures supply chain transparency while satisfying the rigorous demands of conscientious consumer demographics.
- The shift toward sustainable agricultural practice and zero waste manufacturing reshapes the operational landscape for botanical processors. Organizations are implementing drip irrigation infrastructure to conserve water resources, cutting irrigation waste by 40% compared to traditional methods. This transition establishes a highly ethical supply chain that prioritizes organic farming certification and fair trade sourcing.
- Consequently, procurement departments demand comprehensive raw material traceability to validate environmental claims, driving an 18% improvement in supply chain transparency. Advanced processing facilities utilize a continuous manufacturing system to optimize the extraction of the plant derived extract, maintaining high throughput. Integrating these eco-friendly methodologies reduces long-term operational costs by 15% while addressing consumer mandates for responsible sourcing.
What challenges does the Aloe Vera Extracts Industry face during its growth?
- Strict regulatory oversight and disparate standardization frameworks present a formidable challenge, significantly increasing operational friction and compliance costs for international processors.
- Disparate global regulatory standards regarding an anthraquinone concentration limit introduce severe operational friction during botanical derivative processing. Manufacturers must implement a rigorous aloin filtration protocol and multi stage purification systems to comply with international safety mandates. This compliance necessity increases initial capital expenditures by 30% for facilities performing industrial scale extraction.
- Navigating these complex legal frameworks slows down cross-border trade, extending delivery timelines by 15% from the agricultural cultivation field to the final processor. Furthermore, maintaining an advanced biochemical extraction process requires continuous auditing and a strict quality control protocol to guarantee cosmetic formulation stability.
- These intricate compliance structures place a heavy financial burden on smaller suppliers attempting to establish seamless international distribution networks.
Exclusive Technavio Analysis on Customer Landscape
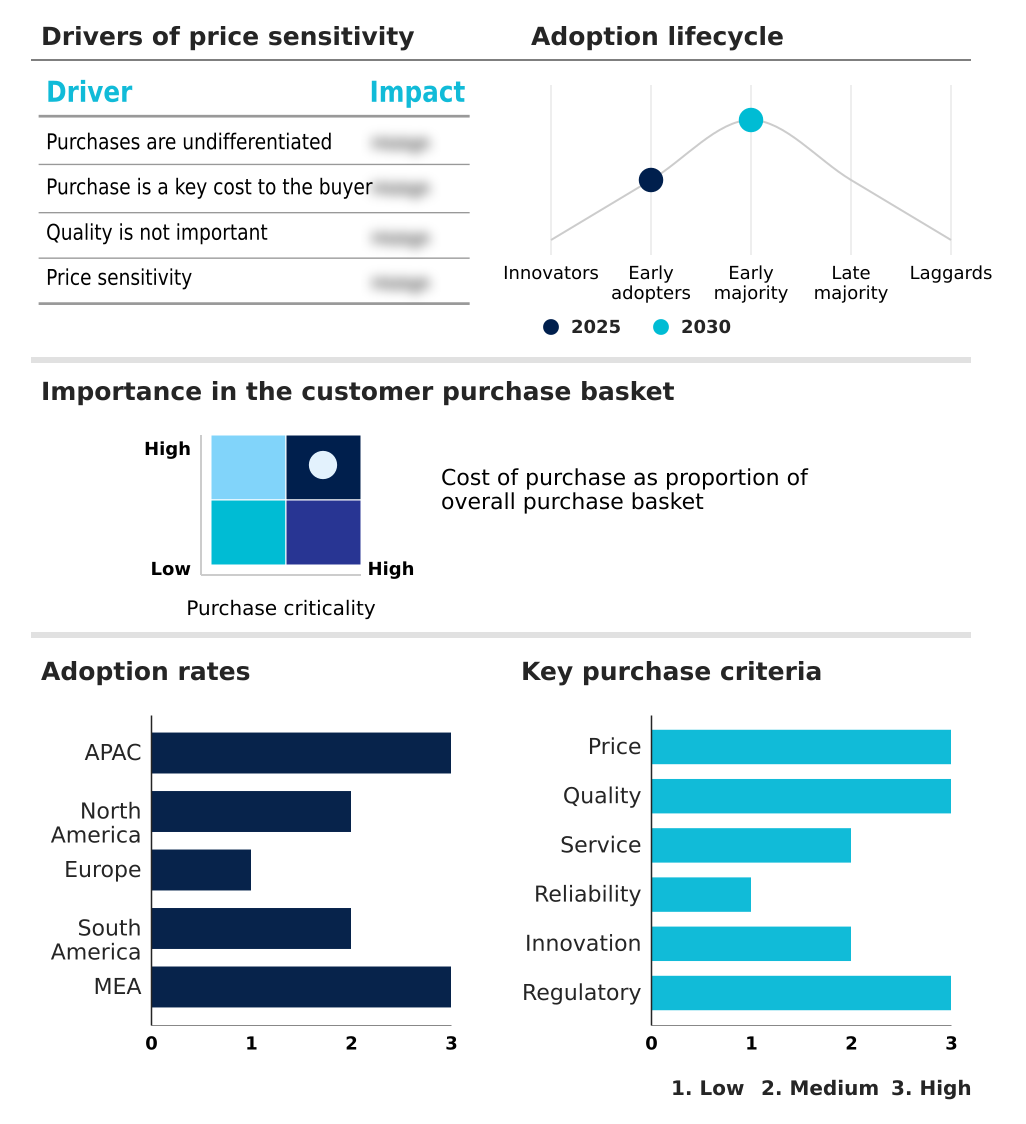
The aloe vera extracts market forecasting report includes the adoption lifecycle of the market, covering from the innovator’s stage to the laggard’s stage. It focuses on adoption rates in different regions based on penetration. Furthermore, the aloe vera extracts market report also includes key purchase criteria and drivers of price sensitivity to help companies evaluate and develop their market growth analysis strategies.
Customer Landscape of Aloe Vera Extracts Industry
Competitive Landscape
Companies are implementing various strategies, such as strategic alliances, aloe vera extracts market forecast, partnerships, mergers and acquisitions, geographical expansion, and product/service launches, to enhance their presence in the industry.
Agro Mayal Exportaciones S.A. - The vendor provides diverse botanical ingredients including concentrated gels, liquid extracts, and dehydrated powders tailored for personal care, functional beverage, and pharmaceutical formulations.
The industry research and growth report includes detailed analyses of the competitive landscape of the market and information about key companies, including:
- Agro Mayal Exportaciones S.A.
- Aloe Jaumave
- Aloe Laboratories Inc.
- Aloe Plus Lanzarote
- Aloe Queen
- Aloe Vera Australia
- Aloecorp Inc.
- Ashland Inc.
- Calmino Group
- ConAloe
- Evergreen Aloe Products Co Ltd
- Foodchem International Corp.
- Forever Living Products
- Houssy Global
- Lily of the Desert
- Natural Aloe de Costa Rica
- Patanjali Ayurved Ltd.
- PharmaChem Laboratories LLC
- RAHN Group
- Terry Laboratories LLC
Qualitative and quantitative analysis of companies has been conducted to help clients understand the wider business environment as well as the strengths and weaknesses of key industry players. Data is qualitatively analyzed to categorize companies as pure play, category-focused, industry-focused, and diversified; it is quantitatively analyzed to categorize companies as dominant, leading, strong, tentative, and weak.
Recent Development and News in Aloe vera extracts market
- In the Agricultural and Farm Machinery industry, the widespread adoption of precision drip irrigation infrastructure has reduced water consumption by 30%, directly impacting Aloe Vera Extracts demand by enabling cost-effective, high-yield cultivation in arid tropical zones.
- The integration of autonomous robotic harvesters in the Agricultural and Farm Machinery sector has accelerated crop processing times by 25%, directly impacting Aloe Vera Extracts supply by minimizing enzymatic degradation between field cutting and initial extraction.
- Strict environmental compliance regulations regarding diesel emissions in the Agricultural and Farm Machinery industry have driven a 15% transition toward electrified tractor fleets, directly impacting Aloe Vera Extracts supply chains by reducing the carbon footprint of organic cultivation.
- Advancements in real-time soil nutrient monitoring systems within the Agricultural and Farm Machinery landscape have improved raw crop quality yields by 18%, directly impacting Aloe Vera Extracts operations by increasing the baseline concentration of active mucopolysaccharides available for extraction.
Dive into Technavio’s robust research methodology, blending expert interviews, extensive data synthesis, and validated models for unparalleled Aloe Vera Extracts Market insights. See full methodology.
| Market Scope | |
|---|---|
| Page number | 286 |
| Base year | 2025 |
| Historic period | 2020-2024 |
| Forecast period | 2026-2030 |
| Growth momentum & CAGR | Accelerate at a CAGR of 9.4% |
| Market growth 2026-2030 | USD 1786.1 million |
| Market structure | Fragmented |
| YoY growth 2025-2026(%) | 8.8% |
| Key countries | China, India, Japan, Australia, South Korea, Indonesia, US, Canada, Mexico, Germany, UK, France, Italy, Spain, The Netherlands, Brazil, Argentina, Colombia, South Africa, Saudi Arabia, UAE, Egypt and Kenya |
| Competitive landscape | Leading Companies, Market Positioning of Companies, Competitive Strategies, and Industry Risks |
Research Analyst Overview
- Commercial integration of botanical ingredients undergoes rapid evolution as industrial formulators demand higher purity and structural stability. Organizations actively optimize their biochemical extraction process to isolate bioactive constituents without compromising the delicate aqueous plant matrix.
- This focus on premium quality influences strategic product decision-making, compelling brands to adopt a cold stabilization technique that extends raw material shelf life by 30% compared to conventional heat processing. A sophisticated lyophilization process further converts the liquid state into a highly concentrated freeze dried powder, yielding a 25% reduction in international freight expenditures.
- By preserving natural mucopolysaccharides and vital cellular repair mechanisms, processors deliver superior ingredients that meet strict pharmaceutical and personal care specifications. Companies deploying these advanced isolation protocols experience a 20% decrease in batch rejection rates, validating the operational necessity of precise manufacturing standards.
- This continuous technological refinement ensures a resilient supply network capable of supporting the widespread commercial demand for verified, high-performance plant derivatives.
What are the Key Data Covered in this Aloe Vera Extracts Market Research and Growth Report?
-
What is the expected growth of the Aloe Vera Extracts Market between 2026 and 2030?
-
USD 1.79 billion, at a CAGR of 9.4%
-
-
What segmentation does the market report cover?
-
The report is segmented by Distribution Channel (Offline, and Online), Application (Cosmetics, Pharmaceuticals, and Food and beverages), Form Factor (Liquid, Gel, Powder, and Others) and Geography (APAC, North America, Europe, South America, Middle East and Africa)
-
-
Which regions are analyzed in the report?
-
APAC, North America, Europe, South America and Middle East and Africa
-
-
What are the key growth drivers and market challenges?
-
Escalating consumer preference for clean-label and botanical ingredients in personal care, Strict regulatory oversight and disparate global standardization frameworks
-
-
Who are the major players in the Aloe Vera Extracts Market?
-
Agro Mayal Exportaciones S.A., Aloe Jaumave, Aloe Laboratories Inc., Aloe Plus Lanzarote, Aloe Queen, Aloe Vera Australia, Aloecorp Inc., Ashland Inc., Calmino Group, ConAloe, Evergreen Aloe Products Co Ltd, Foodchem International Corp., Forever Living Products, Houssy Global, Lily of the Desert, Natural Aloe de Costa Rica, Patanjali Ayurved Ltd., PharmaChem Laboratories LLC, RAHN Group and Terry Laboratories LLC
-
Market Research Insights
- The Aloe Vera Extracts landscape is experiencing a structural shift as organizations prioritize an ethical supply chain and rigorous quality control protocol. By establishing long-term contract farming agreements, primary processing firms have reduced raw material cost volatility by 12%.
- Furthermore, the adoption of a continuous manufacturing system enables manufacturers to achieve a 20% increase in production throughput while preserving the cosmetic formulation stability of the final output. Integrating specialized logistical management ensures a 15% reduction in transit degradation for temperature-sensitive botanical derivatives.
- These operational enhancements allow corporate buyers to secure highly standardized ingredients, driving superior product performance and maintaining compliance with stringent retail mandates.
We can help! Our analysts can customize this aloe vera extracts market research report to meet your requirements.
 RIA -
RIA - 
