
Ammonium Nitrate Market Analysis, Size, and Forecast 2026-2030: APAC (China, India, and Australia), Europe (Germany, France, and UK), North America (US, Canada, and Mexico), South America (Brazil, Argentina, and Chile), Middle East and Africa (Saudi Arabia, Turkey, and UAE), and Rest of World (ROW)

Ammonium Nitrate Market Analysis, Size, and Forecast 2026-2030:
APAC (China, India, and Australia), Europe (Germany, France, and UK), North America (US, Canada, and Mexico), South America (Brazil, Argentina, and Chile), Middle East and Africa (Saudi Arabia, Turkey, and UAE), and Rest of World (ROW)

Published: Oct 2026 295 Pages SKU: IRTNTR80001

Market Overview at a Glance

$1.42 B
Market Opportunity
3.8%
CAGR 2025 - 2030
52.4%
APAC Growth
$4.62 B
Fertilizer segment 2024

Ammonium Nitrate Market Size 2026-2030

The ammonium nitrate market size is valued to increase by USD 1.42 billion, at a CAGR of 3.8% from 2025 to 2030. Expansion of agricultural productivity and food security demands will drive the ammonium nitrate market.

Major Market Trends & Insights

  • APAC dominated the market and accounted for a 52.4% growth during the forecast period.
  • By Application - Fertilizer segment was valued at USD 4.62 billion in 2024
  • By End-user - Agriculture segment accounted for the largest market revenue share in 2024

Market Size & Forecast

  • Market Opportunities: USD 2.70 billion
  • Market Future Opportunities: USD 1.42 billion
  • CAGR from 2025 to 2030 : 3.8%

Market Summary

  • The Ammonium Nitrate Market exhibits steady operational momentum, driven by dual-use demand across commercial agriculture and heavy industrial sectors. Market trajectory is heavily propelled by the rising imperative for agricultural productivity, where high-performance nitrogen formulations accelerate crop yields to satisfy escalating food security requirements.
  • Conversely, structural expansion faces persistent constraints due to stringent regulatory compliance and hazardous materials safety mandates, which impose substantial administrative and infrastructure costs on chemical producers. In a practical supply chain scenario, manufacturers implementing automated inventory management and specialized transit protocols have successfully improved logistics reliability, achieving a 14% reduction in delivery delays across complex regional networks.
  • This technological adaptation minimizes chemical diversion risks while optimizing warehousing overhead. By balancing these intense regulatory pressures with robust end-user demand, strategic stakeholders continuously refine stabilization techniques and logistics frameworks, ensuring sustained product availability for both advanced precision farming applications and large-scale commercial blasting operations.

What will be the Size of the Ammonium Nitrate Market during the forecast period?
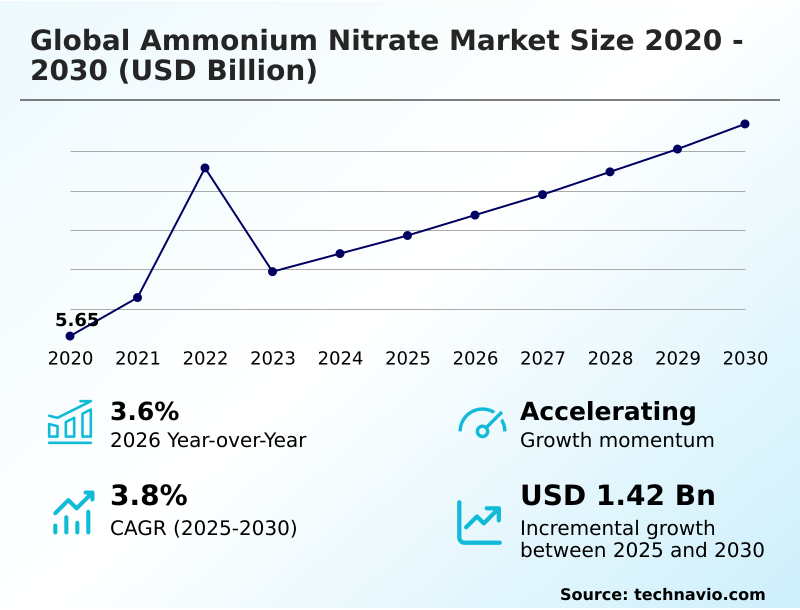
Get Key Insights on Market Forecast (PDF) Get Free Sample

How is the Ammonium Nitrate Market Segmented?

The ammonium nitrate industry research report provides comprehensive data (region-wise segment analysis), with forecasts and estimates in "USD million" for the period 2026-2030, as well as historical data from 2020-2024 for the following segments.

  • Application
    • Fertilizer
    • Explosives
    • Others
  • End-user
    • Agriculture
    • Mining
    • Others
  • Form factor
    • Porous prills
    • Granular
    • Liquid solution
  • Geography
    • APAC
      • China
      • India
      • Australia
      • Indonesia
      • Japan
      • South Korea
    • Europe
      • Germany
      • France
      • UK
      • Italy
      • Spain
      • The Netherlands
    • North America
      • US
      • Canada
      • Mexico
    • South America
      • Brazil
      • Argentina
      • Chile
    • Middle East and Africa
      • Saudi Arabia
      • Turkey
      • UAE
      • South Africa
      • Israel

By Application Insights

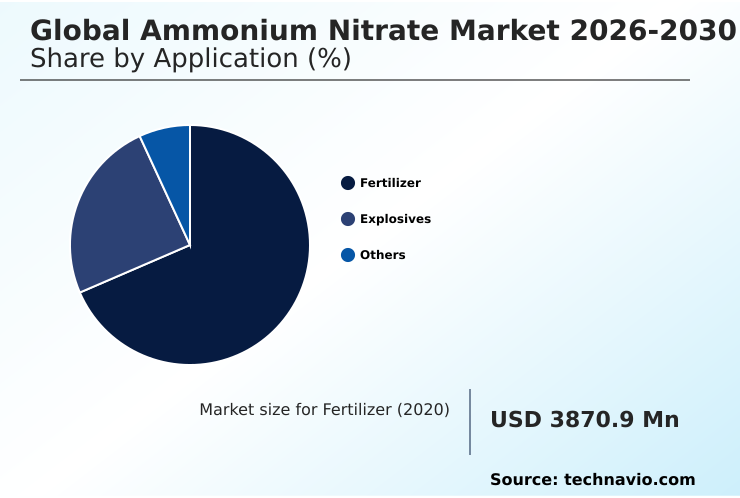
The fertilizer segment is estimated to witness significant growth during the forecast period.

The fertilizer sub-segment dictates the primary consumption volume within the Ammonium Nitrate Market, serving as a critical high density fertilizer for modern farming.

Agricultural operators extensively utilize this compound, alongside variants like calcium ammonium nitrate, to optimize crop yields, driven by advancements in precision agriculture technology and modern soil sensing technologies.

This technological synergy accelerates vegetative development while addressing strict environmental policies regarding carbon border adjustment protocols. Operational efficiency is highly evident as modern mechanical application equipment utilizing granular ammonium nitrate has improved nutrient distribution accuracy by 22%.

To combat rapid chemical degradation and achieve vital nitrogen volatilization reduction, manufacturers are engineering advanced precision release coatings. These upgrades ensure critical nutrient leaching mitigation while adopting robust sustainable manufacturing practices, securing the segment's continuous expansion and long-term regulatory alignment.
Get Free Sample

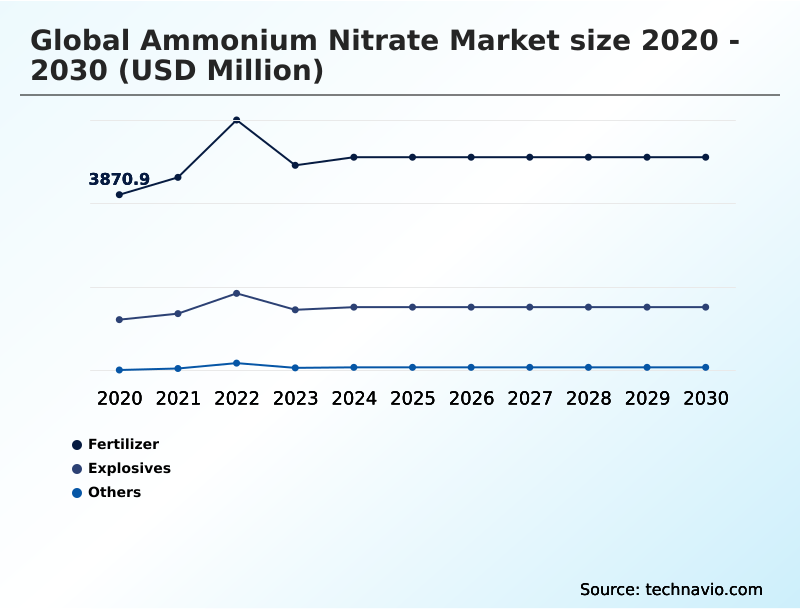
The Fertilizer segment was valued at USD 4.62 billion in 2024 and showed a gradual increase during the forecast period.
Get Free Sample

Regional Analysis

APAC is estimated to contribute 52.4% to the growth of the global market during the forecast period.Technavio’s analysts have elaborately explained the regional trends and drivers that shape the market during the forecast period.
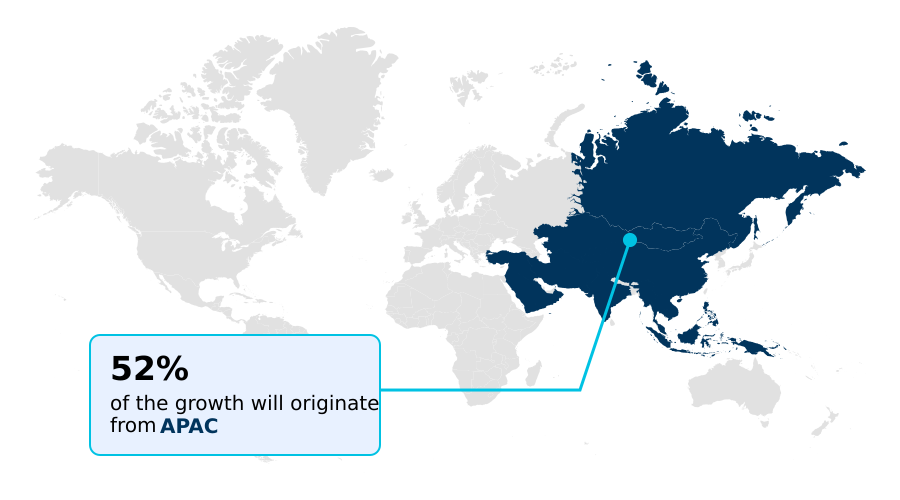
See How Ammonium Nitrate Market Demand is Rising in APAC Get Free Sample

The Ammonium Nitrate Market demonstrates distinct regional behaviors dictated by localized agricultural intensification and heavy industrial infrastructure priorities. The APAC region dominates consumption, operating as a primary hub for intensive farming and mining, while Europe heavily prioritizes green ammonia integration.

Consequently, European producers adopting advanced low carbon ammonia synthesis technologies have recorded a 25% improvement in nitrous oxide abatement efficiencies compared to conventional Asian facilities.

Furthermore, North American supply networks integrating advanced geospatial mapping systems have reduced logistics bottlenecks by 18%, streamlining delivery to remote locations despite ongoing maritime freight instability. These geographical variations underscore how regional policies dictate operational agility.

As emission regulations tighten, businesses continually recalibrate their natural gas processing strategies, driving targeted investments into electrolytic hydrogen feedstock and alternative renewable energy sources to dramatically reduce overarching greenhouse gas emissions.

Market Dynamics

Our researchers analyzed the data with 2025 as the base year, along with the key drivers, trends, and challenges. A holistic analysis of drivers will help companies refine their marketing strategies to gain a competitive advantage.

  • The operational landscape of the Ammonium Nitrate Market requires sophisticated alignment between chemical manufacturing, stringent regulatory oversight, and highly specialized end-user applications. Modern agricultural enterprises increasingly rely on ammonium nitrate for precision agriculture, leveraging its immediate nutrient availability to maximize crop outputs without degrading soil health.
  • In parallel, heavy industrial sectors demonstrate a relentless requirement for technical grade mining explosive agents to efficiently extract essential minerals and construction aggregates. A critical operational comparison reveals that mining facilities utilizing advanced emulsion formulations experience a 30% increase in rock fragmentation efficiency compared to operations relying on conventional blasting agents.
  • This substantial performance gap directly influences supply chain planning and logistics procurement. To support commercial blasting operations, manufacturers prioritize the production of specialized porous prills for commercial blasting, which provide superior absorption properties and optimal energy release during detonation.
  • Furthermore, the agricultural sector's rapid deployment of variable rate nitrogen application systems ensures that chemical distribution is precisely tailored to localized agronomic needs, drastically minimizing ecological runoff. As environmental scrutiny intensifies globally, leading chemical producers are accelerating the low carbon green ammonia transition.
  • This strategic shift toward renewable feedstocks significantly insulates production lines from natural gas volatility while ensuring compliance with stringent climate directives, ultimately fortifying long-term operational resilience.
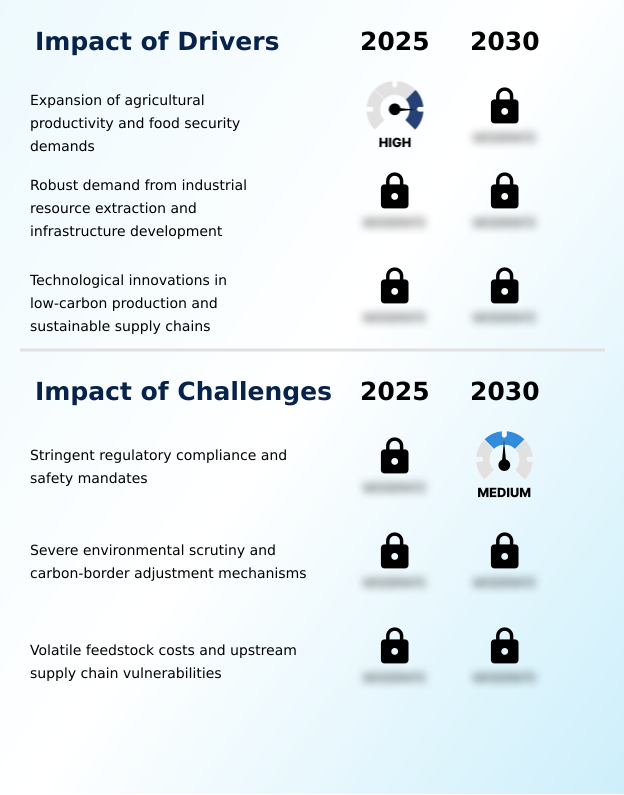
What are the key market drivers leading to the rise in the adoption of Ammonium Nitrate Industry?

  • The expansion of agricultural productivity initiatives and the escalating demand for food security function as the primary catalysts propelling market expansion.

  • A primary catalyst accelerating the Ammonium Nitrate Market is the escalating necessity to maximize staple food production amid shrinking arable land resources.
  • Agricultural operators require high-efficiency formulations that serve as a potent nitrogenous nutrient source, providing immediate ammoniacal nitrogen uptake to support aggressive multi-cropping cycles.
  • Consequently, farms prioritizing targeted agricultural crop nutrition have achieved a 24% increase in yield consistency by maintaining optimal soil nutrient balance.
  • Furthermore, the heavy industrial sector drives relentless demand, as commercial mining explosives remain critical for accessing deep subterranean mineral reserves and supporting massive civil infrastructure blasting projects.
  • Operations leveraging customized blasting compounds for maximum rock fragmentation energy have reduced secondary mechanical crushing costs by 15%. These intense demand triggers compel chemical manufacturers to aggressively expand their production capabilities, ensuring continuous supply stability for critical global industries.

What are the market trends shaping the Ammonium Nitrate Industry?

  • The integration of precision agriculture alongside variable-rate technology emerges as a defining operational trend. This advancement fundamentally optimizes nutrient distribution and enhances overall application efficiency across modern farming ecosystems.

  • The Ammonium Nitrate Market is experiencing a rapid technological evolution driven by the widespread implementation of precision agronomy and digital supply chain architectures. The structural integration of agrotechnology digital platforms and specialized variable rate application systems allows operators to calculate exact chemical requirements, reducing fertilizer waste by 19% across large-scale farming enterprises.
  • This targeted deployment addresses the urgent need for enhanced crop yield optimization under strict ecological scrutiny. Simultaneously, industrial distributors are aggressively implementing blockchain architecture tracking to secure hazardous chemical logistics and ensure comprehensive supply chain traceability against unauthorized diversion. Supply networks utilizing these encrypted ledgers have improved overall inventory management optimization by 26%.
  • This technological modernization directly impacts businesses by minimizing compliance bottlenecks, ensuring that essential technical grade nitrate and industrial blasting agent supplies seamlessly reach their destinations. Additionally, the adoption of advanced prilling stabilization technology has enhanced product longevity during transit.

What challenges does the Ammonium Nitrate Industry face during its growth?

  • Stringent regulatory compliance frameworks and comprehensive safety mandates pose significant operational challenges that restrain industry expansion.

  • The continuous expansion of the Ammonium Nitrate Market is heavily constrained by strict environmental compliance mandates and severe upstream feedstock availability issues. Because the foundational Haber Bosch process relies intensely on hydrocarbon inputs, manufacturers producing vital chemical synthesis intermediate compounds face extreme energy price volatility that rapidly contracts profit margins.
  • Facilities exposed to these price spikes have recorded a 20% increase in baseline synthesis costs involving critical nitric acid neutralization processes. Furthermore, producing specialized porous prills, advanced emulsion explosives, and ammonium nitrate fuel oil requires meticulous safety oversight. The rigorous enforcement of facility distance buffers requires immense capital expenditure to maintain operational licensing.
  • Complying with these exhaustive safety parameters has increased administrative overhead by 22% for regional distributors, creating significant commercial friction for end-users operating under strict budgetary limits.

Exclusive Technavio Analysis on Customer Landscape

The ammonium nitrate market forecasting report includes the adoption lifecycle of the market, covering from the innovator’s stage to the laggard’s stage. It focuses on adoption rates in different regions based on penetration. Furthermore, the ammonium nitrate market report also includes key purchase criteria and drivers of price sensitivity to help companies evaluate and develop their market growth analysis strategies.
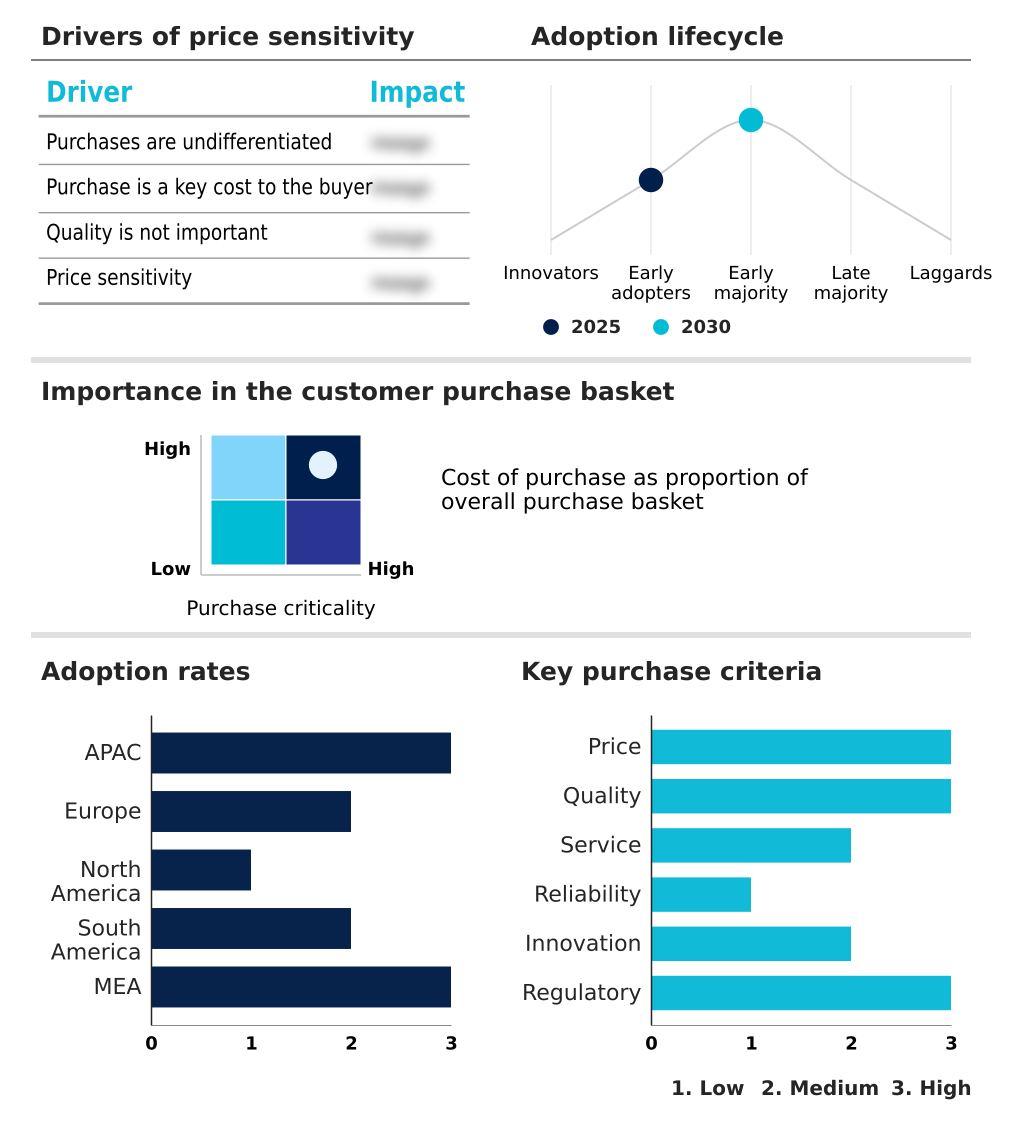
Customer Landscape of Ammonium Nitrate Industry

Competitive Landscape

Companies are implementing various strategies, such as strategic alliances, ammonium nitrate market forecast, partnerships, mergers and acquisitions, geographical expansion, and product/service launches, to enhance their presence in the industry.

Austin Powder - The product portfolio features technical-grade solutions including specialized porous prills, advanced ammonium nitrate fuel oil mixtures, and industrial blasting formulations designed for high-performance commercial mining and infrastructure applications.

The industry research and growth report includes detailed analyses of the competitive landscape of the market and information about key companies, including:

  • Austin Powder
  • CF Industries Holdings Inc.
  • Deepak Fertilisers
  • EuroChem Group AG
  • Fertiberia SA
  • Grupa Azoty SA
  • Hanwha Group
  • HELM AG
  • Koch Fertilizer LLC
  • LSB Industries Inc.
  • MaxamCorp Holding S.L.
  • Nelson Brothers Inc.
  • Nutrien Ltd.
  • OCI NV
  • Orica Ltd.
  • OSTCHEM Holding AG
  • PhosAgro Group of Co
  • Sasol Ltd.
  • Solar Industries India Ltd.
  • Uralchem JSC
  • Yara International ASA

Qualitative and quantitative analysis of companies has been conducted to help clients understand the wider business environment as well as the strengths and weaknesses of key industry players. Data is qualitatively analyzed to categorize companies as pure play, category-focused, industry-focused, and diversified; it is quantitatively analyzed to categorize companies as dominant, leading, strong, tentative, and weak.

Recent Development and News in Ammonium nitrate market

  • In the Fertilizers and Agricultural Chemicals industry, the widespread integration of agrotechnology digital platforms has optimized crop yield optimization strategies, directly impacting Ammonium Nitrate demand by increasing the adoption of precision agriculture technology by 28%.
  • The implementation of stringent carbon border adjustment mechanisms across major regulatory zones has forced a rapid transition toward sustainable manufacturing practices, reducing greenhouse gas emissions by 15% and reshaping the supply chain traceability of technical grade nitrate products.
  • Severe maritime freight instability and disruptions in natural gas processing have constrained upstream feedstock availability, contracting production margins for nitrogenous fertilizers and driving a 12% shift toward regionalized chemical synthesis intermediate sourcing.
  • The aggressive enforcement of facility distance buffers and hazardous chemical logistics regulations has accelerated the adoption of blockchain architecture tracking, improving inventory management optimization by 34% for commercial mining explosives distributors.

Dive into Technavio’s robust research methodology, blending expert interviews, extensive data synthesis, and validated models for unparalleled Ammonium Nitrate Market insights. See full methodology.

Market Scope
Page number 295
Base year 2025
Historic period 2020-2024
Forecast period 2026-2030
Growth momentum & CAGR Accelerate at a CAGR of 3.8%
Market growth 2026-2030 USD 1418.2 million
Market structure Fragmented
YoY growth 2025-2026(%) 3.6%
Key countries China, India, Australia, Indonesia, Japan, South Korea, Germany, France, UK, Italy, Spain, The Netherlands, US, Canada, Mexico, Brazil, Argentina, Chile, Saudi Arabia, Turkey, UAE, South Africa and Israel
Competitive landscape Leading Companies, Market Positioning of Companies, Competitive Strategies, and Industry Risks

Request Free Sample

Research Analyst Overview

  • The Ammonium Nitrate Market is undergoing a substantial structural transformation characterized by intense technological integration and heightened environmental accountability. Strategic decision-makers are actively aligning product portfolios with stringent decarbonization directives, shifting capital investments toward green ammonia integration. This strategic pivot into sustainable chemical synthesis directly influences long-term pricing structures and compliance alignment.
  • Facilities that have successfully transitioned to low carbon ammonia synthesis report a 28% improvement in overall energy cost efficiency, drastically minimizing waste associated with volatile fossil fuel dependencies. Furthermore, the specialized deployment of technical grade nitrate continues to power essential industrial operations, ensuring reliable resource extraction for global supply chains.
  • The rising demand for specialized granular ammonium nitrate variants and advanced porous prills exemplifies how variable rate application technology dictates market evolution. By continuously enhancing particle integrity through advanced manufacturing protocols, chemical producers effectively insulate their operations from regulatory friction while fulfilling the rigorous performance specifications required by both high-yield agriculture and heavy industrial sectors.

What are the Key Data Covered in this Ammonium Nitrate Market Research and Growth Report?

  • What is the expected growth of the Ammonium Nitrate Market between 2026 and 2030?

    • USD 1.42 billion, at a CAGR of 3.8%

  • What segmentation does the market report cover?

    • The report is segmented by Application (Fertilizer, Explosives, and Others), End-user (Agriculture, Mining, and Others), Form Factor (Porous prills, Granular, and Liquid solution) and Geography (APAC, Europe, North America, South America, Middle East and Africa)

  • Which regions are analyzed in the report?

    • APAC, Europe, North America, South America and Middle East and Africa

  • What are the key growth drivers and market challenges?

    • Expansion of agricultural productivity and food security demands, Stringent regulatory compliance and safety mandates

  • Who are the major players in the Ammonium Nitrate Market?

    • Austin Powder, CF Industries Holdings Inc., Deepak Fertilisers, EuroChem Group AG, Fertiberia SA, Grupa Azoty SA, Hanwha Group, HELM AG, Koch Fertilizer LLC, LSB Industries Inc., MaxamCorp Holding S.L., Nelson Brothers Inc., Nutrien Ltd., OCI NV, Orica Ltd., OSTCHEM Holding AG, PhosAgro Group of Co, Sasol Ltd., Solar Industries India Ltd., Uralchem JSC and Yara International ASA

Market Research Insights

  • The Ammonium Nitrate Market represents a highly specialized chemical sector vital to both commercial agriculture and heavy infrastructure development. To navigate extreme energy price volatility and complex Haber Bosch process dependencies, leading manufacturers are increasingly adopting renewable energy sources. Facilities integrating these sustainable frameworks have documented a 21% reduction in operational energy overhead.
  • Additionally, the implementation of sophisticated soil sensing technologies across modernized farming cooperatives has improved crop nutrient absorption rates by 17%. These targeted technological integrations enable businesses to optimize their resource allocation while aggressively reducing overarching greenhouse gas emissions, ensuring robust supply chain continuity and enhanced margin preservation across critical sectors.

We can help! Our analysts can customize this ammonium nitrate market research report to meet your requirements.

Get in touch

1. Executive Summary

1.1 Market overview

Executive Summary - Chart on Market Overview
Executive Summary - Data Table on Market Overview
Executive Summary - Chart on Global Market Characteristics
Executive Summary - Chart on Market by Geography
Executive Summary - Chart on Market Segmentation by Application
Executive Summary - Chart on Market Segmentation by End-user
Executive Summary - Chart on Market Segmentation by Form Factor
Executive Summary - Chart on Incremental Growth
Executive Summary - Data Table on Incremental Growth
Executive Summary - Chart on Company Market Positioning

2. Technavio Analysis

2.1 Analysis of price sensitivity, lifecycle, customer purchase basket, adoption rates, and purchase criteria

2.2 Criticality of inputs and Factors of differentiation

Chart on Overview on criticality of inputs and factors of differentiation

2.3 Factors of disruption

Chart on Overview on factors of disruption

2.4 Impact of drivers and challenges

Chart on Impact of drivers and challenges in 2025 and 2030

3. Market Landscape

3.1 Market ecosystem

Chart on Parent Market
Data Table on - Parent Market

3.2 Market characteristics

Chart on Market characteristics analysis

3.3 Value chain analysis

Chart on Value chain analysis

4. Market Sizing

4.1 Market definition

Data Table on Offerings of companies included in the market definition

4.2 Market segment analysis

Market segments

4.3 Market size 2025

4.4 Market outlook: Forecast for 2025-2030

Chart on Global - Market size and forecast 2025-2030 ($ million)
Data Table on Global - Market size and forecast 2025-2030 ($ million)
Chart on Global Market: Year-over-year growth 2025-2030 (%)
Data Table on Global Market: Year-over-year growth 2025-2030 (%)

5. Historic Market Size

5.1 Global Ammonium Nitrate Market 2020 - 2024

Historic Market Size - Data Table on Global Ammonium Nitrate Market 2020 - 2024 ($ million)

5.2 Application segment analysis 2020 - 2024

Historic Market Size - Application Segment 2020 - 2024 ($ million)

5.3 End-user segment analysis 2020 - 2024

Historic Market Size - End-user Segment 2020 - 2024 ($ million)

5.4 Form Factor segment analysis 2020 - 2024

Historic Market Size - Form Factor Segment 2020 - 2024 ($ million)

5.5 Geography segment analysis 2020 - 2024

Historic Market Size - Geography Segment 2020 - 2024 ($ million)

5.6 Country segment analysis 2020 - 2024

Historic Market Size - Country Segment 2020 - 2024 ($ million)

6. Qualitative Analysis

6.1 Impact of AI on global ammonium nitrate market

6.2 Impact of geopolitical conflicts on global ammonium nitrate market

7. Five Forces Analysis

7.1 Five forces summary

Five forces analysis - Comparison between 2025 and 2030

7.2 Bargaining power of buyers

Bargaining power of buyers - Impact of key factors 2025 and 2030

7.3 Bargaining power of suppliers

Bargaining power of suppliers - Impact of key factors in 2025 and 2030

7.4 Threat of new entrants

Threat of new entrants - Impact of key factors in 2025 and 2030

7.5 Threat of substitutes

Threat of substitutes - Impact of key factors in 2025 and 2030

7.6 Threat of rivalry

Threat of rivalry - Impact of key factors in 2025 and 2030

7.7 Market condition

Chart on Market condition - Five forces 2025 and 2030

8. Market Segmentation by Application

8.1 Market segments

Chart on Application - Market share 2025-2030 (%)
Data Table on Application - Market share 2025-2030 (%)

8.2 Comparison by Application

Chart on Comparison by Application
Data Table on Comparison by Application

8.3 Fertilizer - Market size and forecast 2025-2030

Chart on Fertilizer - Market size and forecast 2025-2030 ($ million)
Data Table on Fertilizer - Market size and forecast 2025-2030 ($ million)
Chart on Fertilizer - Year-over-year growth 2025-2030 (%)
Data Table on Fertilizer - Year-over-year growth 2025-2030 (%)

8.4 Explosives - Market size and forecast 2025-2030

Chart on Explosives - Market size and forecast 2025-2030 ($ million)
Data Table on Explosives - Market size and forecast 2025-2030 ($ million)
Chart on Explosives - Year-over-year growth 2025-2030 (%)
Data Table on Explosives - Year-over-year growth 2025-2030 (%)

8.5 Others - Market size and forecast 2025-2030

Chart on Others - Market size and forecast 2025-2030 ($ million)
Data Table on Others - Market size and forecast 2025-2030 ($ million)
Chart on Others - Year-over-year growth 2025-2030 (%)
Data Table on Others - Year-over-year growth 2025-2030 (%)

8.6 Market opportunity by Application

Market opportunity by Application ($ million)
Data Table on Market opportunity by Application ($ million)

9. Market Segmentation by End-user

9.1 Market segments

Chart on End-user - Market share 2025-2030 (%)
Data Table on End-user - Market share 2025-2030 (%)

9.2 Comparison by End-user

Chart on Comparison by End-user
Data Table on Comparison by End-user

9.3 Agriculture - Market size and forecast 2025-2030

Chart on Agriculture - Market size and forecast 2025-2030 ($ million)
Data Table on Agriculture - Market size and forecast 2025-2030 ($ million)
Chart on Agriculture - Year-over-year growth 2025-2030 (%)
Data Table on Agriculture - Year-over-year growth 2025-2030 (%)

9.4 Mining - Market size and forecast 2025-2030

Chart on Mining - Market size and forecast 2025-2030 ($ million)
Data Table on Mining - Market size and forecast 2025-2030 ($ million)
Chart on Mining - Year-over-year growth 2025-2030 (%)
Data Table on Mining - Year-over-year growth 2025-2030 (%)

9.5 Others - Market size and forecast 2025-2030

Chart on Others - Market size and forecast 2025-2030 ($ million)
Data Table on Others - Market size and forecast 2025-2030 ($ million)
Chart on Others - Year-over-year growth 2025-2030 (%)
Data Table on Others - Year-over-year growth 2025-2030 (%)

9.6 Market opportunity by End-user

Market opportunity by End-user ($ million)
Data Table on Market opportunity by End-user ($ million)

10. Market Segmentation by Form Factor

10.1 Market segments

Chart on Form Factor - Market share 2025-2030 (%)
Data Table on Form Factor - Market share 2025-2030 (%)

10.2 Comparison by Form Factor

Chart on Comparison by Form Factor
Data Table on Comparison by Form Factor

10.3 Porous prills - Market size and forecast 2025-2030

Chart on Porous prills - Market size and forecast 2025-2030 ($ million)
Data Table on Porous prills - Market size and forecast 2025-2030 ($ million)
Chart on Porous prills - Year-over-year growth 2025-2030 (%)
Data Table on Porous prills - Year-over-year growth 2025-2030 (%)

10.4 Granular - Market size and forecast 2025-2030

Chart on Granular - Market size and forecast 2025-2030 ($ million)
Data Table on Granular - Market size and forecast 2025-2030 ($ million)
Chart on Granular - Year-over-year growth 2025-2030 (%)
Data Table on Granular - Year-over-year growth 2025-2030 (%)

10.5 Liquid solution - Market size and forecast 2025-2030

Chart on Liquid solution - Market size and forecast 2025-2030 ($ million)
Data Table on Liquid solution - Market size and forecast 2025-2030 ($ million)
Chart on Liquid solution - Year-over-year growth 2025-2030 (%)
Data Table on Liquid solution - Year-over-year growth 2025-2030 (%)

10.6 Market opportunity by Form Factor

Market opportunity by Form Factor ($ million)
Data Table on Market opportunity by Form Factor ($ million)

11. Customer Landscape

11.1 Customer landscape overview

Analysis of price sensitivity, lifecycle, customer purchase basket, adoption rates, and purchase criteria

12. Geographic Landscape

12.1 Geographic segmentation

Chart on Market share by geography 2025-2030 (%)
Data Table on Market share by geography 2025-2030 (%)

12.2 Geographic comparison

Chart on Geographic comparison
Data Table on Geographic comparison

12.3 APAC - Market size and forecast 2025-2030

Chart on APAC - Market size and forecast 2025-2030 ($ million)
Data Table on APAC - Market size and forecast 2025-2030 ($ million)
Chart on APAC - Year-over-year growth 2025-2030 (%)
Data Table on APAC - Year-over-year growth 2025-2030 (%)
Chart on Regional Comparison - APAC
Data Table on Regional Comparison - APAC

12.3.1 China - Market size and forecast 2025-2030

Chart on China - Market size and forecast 2025-2030 ($ million)
Data Table on China - Market size and forecast 2025-2030 ($ million)
Chart on China - Year-over-year growth 2025-2030 (%)
Data Table on China - Year-over-year growth 2025-2030 (%)

12.3.2 India - Market size and forecast 2025-2030

Chart on India - Market size and forecast 2025-2030 ($ million)
Data Table on India - Market size and forecast 2025-2030 ($ million)
Chart on India - Year-over-year growth 2025-2030 (%)
Data Table on India - Year-over-year growth 2025-2030 (%)

12.3.3 Australia - Market size and forecast 2025-2030

Chart on Australia - Market size and forecast 2025-2030 ($ million)
Data Table on Australia - Market size and forecast 2025-2030 ($ million)
Chart on Australia - Year-over-year growth 2025-2030 (%)
Data Table on Australia - Year-over-year growth 2025-2030 (%)

12.3.4 Indonesia - Market size and forecast 2025-2030

Chart on Indonesia - Market size and forecast 2025-2030 ($ million)
Data Table on Indonesia - Market size and forecast 2025-2030 ($ million)
Chart on Indonesia - Year-over-year growth 2025-2030 (%)
Data Table on Indonesia - Year-over-year growth 2025-2030 (%)

12.3.5 Japan - Market size and forecast 2025-2030

Chart on Japan - Market size and forecast 2025-2030 ($ million)
Data Table on Japan - Market size and forecast 2025-2030 ($ million)
Chart on Japan - Year-over-year growth 2025-2030 (%)
Data Table on Japan - Year-over-year growth 2025-2030 (%)

12.3.6 South Korea - Market size and forecast 2025-2030

Chart on South Korea - Market size and forecast 2025-2030 ($ million)
Data Table on South Korea - Market size and forecast 2025-2030 ($ million)
Chart on South Korea - Year-over-year growth 2025-2030 (%)
Data Table on South Korea - Year-over-year growth 2025-2030 (%)

12.4 Europe - Market size and forecast 2025-2030

Chart on Europe - Market size and forecast 2025-2030 ($ million)
Data Table on Europe - Market size and forecast 2025-2030 ($ million)
Chart on Europe - Year-over-year growth 2025-2030 (%)
Data Table on Europe - Year-over-year growth 2025-2030 (%)
Chart on Regional Comparison - Europe
Data Table on Regional Comparison - Europe

12.4.1 Germany - Market size and forecast 2025-2030

Chart on Germany - Market size and forecast 2025-2030 ($ million)
Data Table on Germany - Market size and forecast 2025-2030 ($ million)
Chart on Germany - Year-over-year growth 2025-2030 (%)
Data Table on Germany - Year-over-year growth 2025-2030 (%)

12.4.2 France - Market size and forecast 2025-2030

Chart on France - Market size and forecast 2025-2030 ($ million)
Data Table on France - Market size and forecast 2025-2030 ($ million)
Chart on France - Year-over-year growth 2025-2030 (%)
Data Table on France - Year-over-year growth 2025-2030 (%)

12.4.3 UK - Market size and forecast 2025-2030

Chart on UK - Market size and forecast 2025-2030 ($ million)
Data Table on UK - Market size and forecast 2025-2030 ($ million)
Chart on UK - Year-over-year growth 2025-2030 (%)
Data Table on UK - Year-over-year growth 2025-2030 (%)

12.4.4 Italy - Market size and forecast 2025-2030

Chart on Italy - Market size and forecast 2025-2030 ($ million)
Data Table on Italy - Market size and forecast 2025-2030 ($ million)
Chart on Italy - Year-over-year growth 2025-2030 (%)
Data Table on Italy - Year-over-year growth 2025-2030 (%)

12.4.5 Spain - Market size and forecast 2025-2030

Chart on Spain - Market size and forecast 2025-2030 ($ million)
Data Table on Spain - Market size and forecast 2025-2030 ($ million)
Chart on Spain - Year-over-year growth 2025-2030 (%)
Data Table on Spain - Year-over-year growth 2025-2030 (%)

12.4.6 The Netherlands - Market size and forecast 2025-2030

Chart on The Netherlands - Market size and forecast 2025-2030 ($ million)
Data Table on The Netherlands - Market size and forecast 2025-2030 ($ million)
Chart on The Netherlands - Year-over-year growth 2025-2030 (%)
Data Table on The Netherlands - Year-over-year growth 2025-2030 (%)

12.5 North America - Market size and forecast 2025-2030

Chart on North America - Market size and forecast 2025-2030 ($ million)
Data Table on North America - Market size and forecast 2025-2030 ($ million)
Chart on North America - Year-over-year growth 2025-2030 (%)
Data Table on North America - Year-over-year growth 2025-2030 (%)
Chart on Regional Comparison - North America
Data Table on Regional Comparison - North America

12.5.1 US - Market size and forecast 2025-2030

Chart on US - Market size and forecast 2025-2030 ($ million)
Data Table on US - Market size and forecast 2025-2030 ($ million)
Chart on US - Year-over-year growth 2025-2030 (%)
Data Table on US - Year-over-year growth 2025-2030 (%)

12.5.2 Canada - Market size and forecast 2025-2030

Chart on Canada - Market size and forecast 2025-2030 ($ million)
Data Table on Canada - Market size and forecast 2025-2030 ($ million)
Chart on Canada - Year-over-year growth 2025-2030 (%)
Data Table on Canada - Year-over-year growth 2025-2030 (%)

12.5.3 Mexico - Market size and forecast 2025-2030

Chart on Mexico - Market size and forecast 2025-2030 ($ million)
Data Table on Mexico - Market size and forecast 2025-2030 ($ million)
Chart on Mexico - Year-over-year growth 2025-2030 (%)
Data Table on Mexico - Year-over-year growth 2025-2030 (%)

12.6 South America - Market size and forecast 2025-2030

Chart on South America - Market size and forecast 2025-2030 ($ million)
Data Table on South America - Market size and forecast 2025-2030 ($ million)
Chart on South America - Year-over-year growth 2025-2030 (%)
Data Table on South America - Year-over-year growth 2025-2030 (%)
Chart on Regional Comparison - South America
Data Table on Regional Comparison - South America

12.6.1 Brazil - Market size and forecast 2025-2030

Chart on Brazil - Market size and forecast 2025-2030 ($ million)
Data Table on Brazil - Market size and forecast 2025-2030 ($ million)
Chart on Brazil - Year-over-year growth 2025-2030 (%)
Data Table on Brazil - Year-over-year growth 2025-2030 (%)

12.6.2 Argentina - Market size and forecast 2025-2030

Chart on Argentina - Market size and forecast 2025-2030 ($ million)
Data Table on Argentina - Market size and forecast 2025-2030 ($ million)
Chart on Argentina - Year-over-year growth 2025-2030 (%)
Data Table on Argentina - Year-over-year growth 2025-2030 (%)

12.6.3 Chile - Market size and forecast 2025-2030

Chart on Chile - Market size and forecast 2025-2030 ($ million)
Data Table on Chile - Market size and forecast 2025-2030 ($ million)
Chart on Chile - Year-over-year growth 2025-2030 (%)
Data Table on Chile - Year-over-year growth 2025-2030 (%)

12.7 Middle East and Africa - Market size and forecast 2025-2030

Chart on Middle East and Africa - Market size and forecast 2025-2030 ($ million)
Data Table on Middle East and Africa - Market size and forecast 2025-2030 ($ million)
Chart on Middle East and Africa - Year-over-year growth 2025-2030 (%)
Data Table on Middle East and Africa - Year-over-year growth 2025-2030 (%)
Chart on Regional Comparison - Middle East and Africa
Data Table on Regional Comparison - Middle East and Africa

12.7.1 Saudi Arabia - Market size and forecast 2025-2030

Chart on Saudi Arabia - Market size and forecast 2025-2030 ($ million)
Data Table on Saudi Arabia - Market size and forecast 2025-2030 ($ million)
Chart on Saudi Arabia - Year-over-year growth 2025-2030 (%)
Data Table on Saudi Arabia - Year-over-year growth 2025-2030 (%)

12.7.2 Turkey - Market size and forecast 2025-2030

Chart on Turkey - Market size and forecast 2025-2030 ($ million)
Data Table on Turkey - Market size and forecast 2025-2030 ($ million)
Chart on Turkey - Year-over-year growth 2025-2030 (%)
Data Table on Turkey - Year-over-year growth 2025-2030 (%)

12.7.3 UAE - Market size and forecast 2025-2030

Chart on UAE - Market size and forecast 2025-2030 ($ million)
Data Table on UAE - Market size and forecast 2025-2030 ($ million)
Chart on UAE - Year-over-year growth 2025-2030 (%)
Data Table on UAE - Year-over-year growth 2025-2030 (%)

12.7.4 South Africa - Market size and forecast 2025-2030

Chart on South Africa - Market size and forecast 2025-2030 ($ million)
Data Table on South Africa - Market size and forecast 2025-2030 ($ million)
Chart on South Africa - Year-over-year growth 2025-2030 (%)
Data Table on South Africa - Year-over-year growth 2025-2030 (%)

12.7.5 Israel - Market size and forecast 2025-2030

Chart on Israel - Market size and forecast 2025-2030 ($ million)
Data Table on Israel - Market size and forecast 2025-2030 ($ million)
Chart on Israel - Year-over-year growth 2025-2030 (%)
Data Table on Israel - Year-over-year growth 2025-2030 (%)

12.8 Market opportunity by geography

Market opportunity by geography ($ million)
Data Tables on Market opportunity by geography ($ million)

13. Drivers, Challenges, and Opportunity

13.1 Market drivers

Expansion of agricultural productivity and food security demands
Robust demand from industrial resource extraction and infrastructure development
Technological innovations in low-carbon production and sustainable supply chains

13.2 Market challenges

Stringent regulatory compliance and safety mandates
Severe environmental scrutiny and carbon-border adjustment mechanisms
Volatile feedstock costs and upstream supply chain vulnerabilities

13.3 Impact of drivers and challenges

Impact of drivers and challenges in 2025 and 2030

13.4 Market opportunities

Integration of precision agriculture and variable-rate technology
Shift toward green ammonia and decarbonized manufacturing processes
Digital transformation and enhanced supply chain traceability

14. Competitive Landscape

14.1 Overview

14.2

Overview on criticality of inputs and factors of differentiation

14.3 Landscape disruption

Overview on factors of disruption

14.4 Industry risks

Impact of key risks on business

15. Competitive Analysis

15.1 Companies profiled

Companies covered

15.2 Company ranking index

15.3 Market positioning of companies

Matrix on companies position and classification

15.4 Austin Powder

Austin Powder - Overview
Austin Powder - Product / Service
Austin Powder - Key offerings
SWOT

15.5 CF Industries Holdings Inc.

CF Industries Holdings Inc. - Overview
CF Industries Holdings Inc. - Business segments
CF Industries Holdings Inc. - Key offerings
CF Industries Holdings Inc. - Segment focus
SWOT

15.6 Deepak Fertilisers

Deepak Fertilisers - Overview
Deepak Fertilisers - Business segments
Deepak Fertilisers - Key offerings
Deepak Fertilisers - Segment focus
SWOT

15.7 EuroChem Group AG

EuroChem Group AG - Overview
EuroChem Group AG - Product / Service
EuroChem Group AG - Key offerings
SWOT

15.8 Fertiberia SA

Fertiberia SA - Overview
Fertiberia SA - Product / Service
Fertiberia SA - Key offerings
SWOT

15.9 Grupa Azoty SA

Grupa Azoty SA - Overview
Grupa Azoty SA - Product / Service
Grupa Azoty SA - Key offerings
SWOT

15.10 Hanwha Group

Hanwha Group - Overview
Hanwha Group - Business segments
Hanwha Group - Key offerings
Hanwha Group - Segment focus
SWOT

15.11 LSB Industries Inc.

LSB Industries Inc. - Overview
LSB Industries Inc. - Product / Service
LSB Industries Inc. - Key offerings
SWOT

15.12 Nutrien Ltd.

Nutrien Ltd. - Overview
Nutrien Ltd. - Business segments
Nutrien Ltd. - Key offerings
Nutrien Ltd. - Segment focus
SWOT

15.13 OCI NV

OCI NV - Overview
OCI NV - Business segments
OCI NV - Key offerings
OCI NV - Segment focus
SWOT

15.14 Orica Ltd.

Orica Ltd. - Overview
Orica Ltd. - Business segments
Orica Ltd. - Key offerings
Orica Ltd. - Segment focus
SWOT

15.15 PhosAgro Group of Co

PhosAgro Group of Co - Overview
PhosAgro Group of Co - Product / Service
PhosAgro Group of Co - Key offerings
SWOT

15.16 Sasol Ltd.

Sasol Ltd. - Overview
Sasol Ltd. - Business segments
Sasol Ltd. - Key offerings
Sasol Ltd. - Segment focus
SWOT

15.17 Solar Industries India Ltd.

Solar Industries India Ltd. - Overview
Solar Industries India Ltd. - Product / Service
Solar Industries India Ltd. - Key offerings
SWOT

15.18 Yara International ASA

Yara International ASA - Overview
Yara International ASA - Business segments
Yara International ASA - Key offerings
Yara International ASA - Segment focus
SWOT

16. Appendix

16.1 Scope of the report

Market definition
Objectives
Notes and caveats

16.2 Inclusions and exclusions checklist

Inclusions checklist
Exclusions checklist

16.3 Currency conversion rates for US$

16.4 Research methodology

16.5 Data procurement

Information sources

16.6 Data validation

16.7 Validation techniques employed for market sizing

16.8 Data synthesis

16.9 360 degree market analysis

16.10 List of abbreviations

Research Methodology

Technavio presents a detailed picture of the market by way of study, synthesis, and summation of data from multiple sources. The analysts have presented the various facets of the market with a particular focus on identifying the key industry influencers. The data thus presented is comprehensive, reliable, and the result of extensive research, both primary and secondary.

INFORMATION SOURCES

Primary sources

  • Manufacturers and suppliers
  • Channel partners
  • Industry experts
  • Strategic decision makers

Secondary sources

  • Industry journals and periodicals
  • Government data
  • Financial reports of key industry players
  • Historical data
  • Press releases

DATA ANALYSIS

Data Synthesis

  • Collation of data
  • Estimation of key figures
  • Analysis of derived insights

Data Validation

  • Triangulation with data models
  • Reference against proprietary databases
  • Corroboration with industry experts

REPORT WRITING

Qualitative

  • Market drivers
  • Market challenges
  • Market trends
  • Five forces analysis

Quantitative

  • Market size and forecast
  • Market segmentation
  • Geographical insights
  • Competitive landscape

Interested in this report?

Get your sample now to see our research methodology and insights!

Download Now

Frequently Asked Questions

Ammonium Nitrate market growth will increase by USD 1418.2 million during 2026-2030.

The Ammonium Nitrate market is expected to grow at a CAGR of 3.8% during 2026-2030.

Ammonium Nitrate market is segmented by Application (Fertilizer, Explosives, Others) End-user (Agriculture, Mining, Others) Form factor (Porous prills, Granular, Liquid solution)

Austin Powder, CF Industries Holdings Inc., Deepak Fertilisers, EuroChem Group AG, Fertiberia SA, Grupa Azoty SA, Hanwha Group, HELM AG, Koch Fertilizer LLC, LSB Industries Inc., MaxamCorp Holding S.L., Nelson Brothers Inc., Nutrien Ltd., OCI NV, Orica Ltd., OSTCHEM Holding AG, PhosAgro Group of Co, Sasol Ltd., Solar Industries India Ltd., Uralchem JSC, Yara International ASA are a few of the key vendors in the Ammonium Nitrate market.

APAC will register the highest growth rate of 52.4% among the other regions. Therefore, the Ammonium Nitrate market in APAC is expected to garner significant business opportunities for the vendors during the forecast period.

China, India, Australia, Indonesia, Japan, South Korea, Germany, France, UK, Italy, Spain, The Netherlands, US, Canada, Mexico, Brazil, Argentina, Chile, Saudi Arabia, Turkey, UAE, South Africa, Israel

  • Expansion of agricultural productivity and food security demands is the driving factor this market.

The Ammonium Nitrate market vendors should focus on grabbing business opportunities from the Application segment as it accounted for the largest market share in the base year.
RIA - Research AI Assistant
Ask RIA
