Ammonium Sulfate Market Analysis, Size, and Forecast 2025-2029: APAC (China, India, and Japan), Europe (Germany, France, and UK), North America (US, Canada, and Mexico), South America (Brazil, Argentina, and Colombia), Middle East and Africa (Saudi Arabia, UAE, and South Africa), and Rest of World (ROW)

Ammonium Sulfate Market Analysis, Size, and Forecast 2025-2029:
APAC (China, India, and Japan), Europe (Germany, France, and UK), North America (US, Canada, and Mexico), South America (Brazil, Argentina, and Colombia), Middle East and Africa (Saudi Arabia, UAE, and South Africa), and Rest of World (ROW)

Published: Dec 2025 302 Pages SKU: IRTNTR81155

Market Overview at a Glance

$971.7 Mn
Market Opportunity
3.5%
CAGR 2024 - 2029
53.5%
APAC Growth
$4.02 B
Solid segment 2023

Ammonium Sulfate Market Size 2025-2029

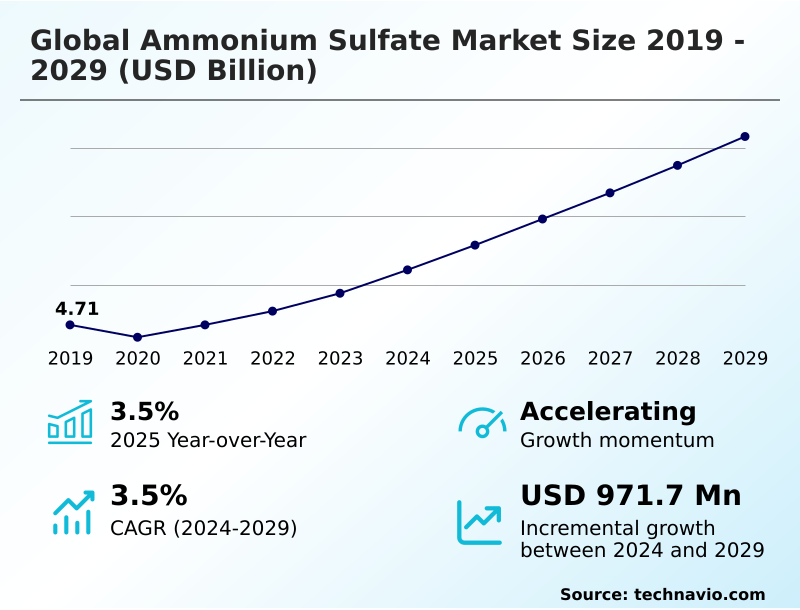
The ammonium sulfate market size is valued to increase by USD 971.7 million, at a CAGR of 3.5% from 2024 to 2029. Growing global food demand will drive the ammonium sulfate market.

Major Market Trends & Insights

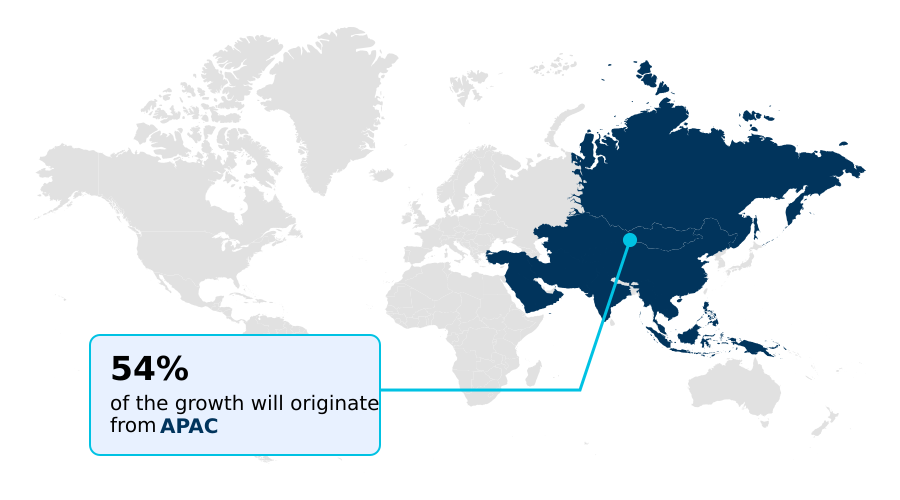
  • APAC dominated the market and accounted for a 53.5% growth during the forecast period.
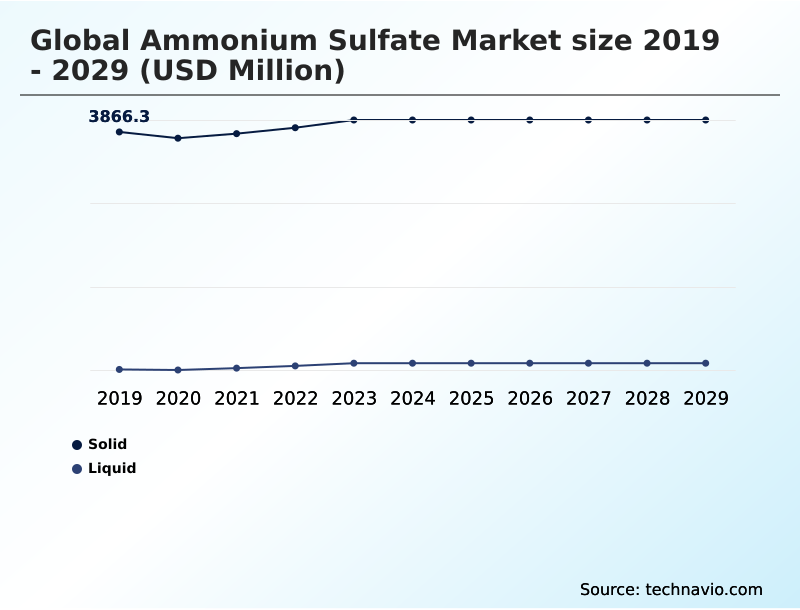
  • By Type - Solid segment was valued at USD 4.02 billion in 2023
  • By Application - Fertilizers segment accounted for the largest market revenue share in 2023

Market Size & Forecast

  • Market Opportunities: USD 1.37 billion
  • Market Future Opportunities: USD 971.7 million
  • CAGR from 2024 to 2029 : 3.5%

Market Summary

  • The ammonium sulfate market is shaped by a unique dual-supply structure, balancing byproduct streams from industrial manufacturing with on-purpose synthetic production. This dynamic creates distinct economic considerations for market participants. The primary demand driver remains the agricultural sector's unceasing need to improve crop yields through balanced nutrition, particularly by addressing widespread sulfur deficiencies in soil.
  • As a fertilizer, it provides both nitrogen and sulfur in a plant-available form. Trends such as precision agriculture are increasing demand for high-solubility and liquid grades, while a growing emphasis on the circular economy enhances the value of byproduct material.
  • For instance, a fertilizer blending company must navigate the supply-side complexities, where a slowdown in steel or chemical production could constrain the availability of cost-effective byproduct ammonium sulfate, forcing a pivot to potentially more expensive synthetic alternatives and impacting operational cost structures.
  • Simultaneously, the market contends with intense competition from other nitrogen fertilizers and increasing regulatory scrutiny over nutrient management and environmental impact.

What will be the Size of the Ammonium Sulfate Market during the forecast period?

Get Key Insights on Market Forecast (PDF) Request Free Sample

How is the Ammonium Sulfate Market Segmented?

The ammonium sulfate industry research report provides comprehensive data (region-wise segment analysis), with forecasts and estimates in "USD million" for the period 2025-2029, as well as historical data from 2019-2023 for the following segments.

  • Type
    • Solid
    • Liquid
  • Application
    • Fertilizers
    • Food and feed additive
    • Pharmaceuticals
    • Water treatment
    • Others
  • Production area
    • Synthetic production
    • By-product production
  • Geography
    • APAC
      • China
      • India
      • Japan
    • Europe
      • Germany
      • France
      • UK
    • North America
      • US
      • Canada
      • Mexico
    • South America
      • Brazil
      • Argentina
      • Colombia
    • Middle East and Africa
      • Saudi Arabia
      • UAE
      • South Africa
    • Rest of World (ROW)

By Type Insights

The solid segment is estimated to witness significant growth during the forecast period.

The solid segment, primarily comprising crystalline ammonium sulfate and granular ammonium sulfate, is central to the market's structure, driven by logistical efficiency in transport and storage.

As an agricultural grade fertilizer, its role in bulk blended fertilizer formulations is critical for improving nitrogen use efficiency and crop nutrient uptake.

The segment's stability is supported by byproduct fertilizer economics, where industrial byproduct valuation of material from sources like steel industry co-products makes it a cost-effective agricultural soil amendment.

This form accounts for over 81% of the total market volume, underscoring its dominance.

Beyond agriculture, industrial grade ammonium sulfate serves various sectors, while specialized forms are used as a food and feed grade additive, showcasing the material's versatility and strong position established through sound agronomic best practices.

Request Free Sample

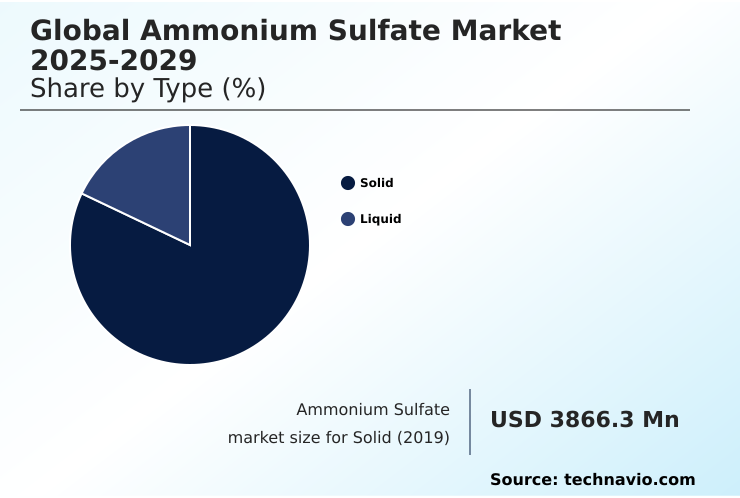
The Solid segment was valued at USD 4.02 billion in 2023 and showed a gradual increase during the forecast period.

Request Free Sample

Regional Analysis

APAC is estimated to contribute 53.5% to the growth of the global market during the forecast period.Technavio’s analysts have elaborately explained the regional trends and drivers that shape the market during the forecast period.

See How Ammonium Sulfate Market Demand is Rising in APAC Request Free Sample

The geographic landscape is dominated by APAC, which accounts for over 53% of the market's incremental growth, fueled by its vast agricultural sector and large-scale industrial byproduct capacity.

The region's growth rate of 4.2% significantly outpaces that of mature markets like North America and Europe. In these Western regions, demand is driven by advanced agricultural practices and the need for specialty products.

In contrast, South America, particularly Brazil, represents a high-growth market heavily reliant on imports to support its expanding cultivation of commodity crops. The soil acidification effect of the product is a key consideration in this region.

Industrial applications, including its use as a non-protein nitrogen source in animal feed or as a chemical intermediate for a pharmaceutical processing aid, also contribute to demand.

Strategic decisions are increasingly influenced by environmental, social, and governance (ESG) factors, impacting production and sourcing across all regions, including its use in water treatment chemistry and the chloramination process.

Market Dynamics

Our researchers analyzed the data with 2024 as the base year, along with the key drivers, trends, and challenges. A holistic analysis of drivers will help companies refine their marketing strategies to gain a competitive advantage.

  • Strategic decision-making in the ammonium sulfate market requires a nuanced understanding of both agricultural and industrial value chains. The debate over ammonium sulfate vs urea for corn is a recurring theme in agronomy, with choices influenced by soil type and the need for sulfur.
  • Application methods also vary, with granular vs liquid ammonium sulfate application being a key consideration for farmers investing in precision agriculture. The market's supply side is complex; byproduct ammonium sulfate quality standards are critical for producers in the caprolactam and steel industries. Understanding the ammonium sulfate production from caprolactam is essential for forecasting supply.
  • The price of ammonium sulfate per ton is closely watched, as it dictates the cost-effectiveness of byproduct fertilizers. From a use-case perspective, using ammonium sulfate in alkaline soils is a primary agricultural benefit, particularly for high sulfur crops.
  • The ammonium sulfate supply chain logistics are a major factor in regional pricing, with firms that manage nutrient runoff from ammonium sulfate more effectively gaining a compliance advantage. This is crucial as regulatory limits on nitrogen fertilizer use become stricter.
  • In industrial sectors, the role of ammonium sulfate in baking and its function as a fire retardant represent stable demand segments. The benefits of ammonium sulfate in fertigation are driving growth in the specialty agriculture sector. Further, the use of ammonium sulfate in pharmaceutical protein precipitation and for turfgrass management showcases its versatility.
  • Proper blending of ammonium sulfate with other fertilizers and its role in water treatment disinfection highlight its importance beyond farming.

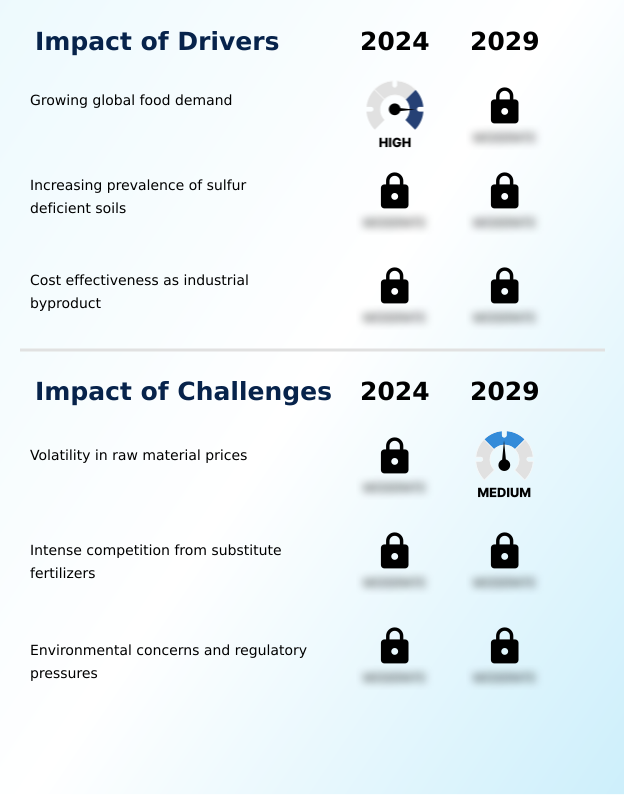
What are the key market drivers leading to the rise in the adoption of Ammonium Sulfate Industry?

  • The fundamental need to enhance agricultural productivity to meet growing global food demand serves as the primary driver for the market.

  • Market growth is fundamentally driven by the dual imperatives of agricultural productivity and industrial sustainability.
  • As a potent nitrogen and sulfur fertilizer, ammonium sulfate directly addresses the widespread issue of sulfur deficient soil correction, with balanced fertilization capable of boosting crop yields by 10-20% in affected areas.
  • The product's high solubility fertilizer characteristics, providing both ammoniacal nitrogen and sulfate sulfur nutrient, make it ideal for modern farming. A major economic driver is its production as a caprolactam byproduct, a cornerstone of the circular economy in chemicals.
  • This byproduct route, resulting from the beckmann rearrangement byproduct in caprolactam manufacturing, is significantly less energy-intensive than direct synthesis production.
  • This inherent cost advantage makes it a preferred choice for alkaline soil treatment and enhances sulfur nutrition for crops, aligning economic benefits with environmental advantages.

What are the market trends shaping the Ammonium Sulfate Industry?

  • A prominent trend is the agricultural industry's shift toward balanced fertilization, moving beyond primary macronutrients. This holistic approach emphasizes the critical role of secondary nutrients like sulfur for optimizing crop health and yield.

  • Key market trends are driving a shift toward more sophisticated nutrient management. The adoption of precision agriculture application technologies, including variable rate technology (VRT), is boosting demand for high-quality liquid fertilizer solution and fertigation-grade soluble salt products. This approach enhances the delivery of plant available sulfur, with some systems improving nutrient placement efficiency by up to 25%.
  • A robust nutrient management plan now frequently incorporates a soil pH regulator to optimize growing conditions. Furthermore, the push for sustainable agriculture inputs is increasing the use of advanced NPK+S formulation products and customized fertilizer blending, which can reduce nutrient waste by over 15%.
  • The versatility of the product is also seen in its use as a foliar spray nutrient, offering another route for targeted fertigation systems and liquid fertilizer formulation.

What challenges does the Ammonium Sulfate Industry face during its growth?

  • Significant price volatility in key raw materials, namely ammonia and sulfuric acid, presents a key challenge to market stability and producer profitability.

  • The market faces significant headwinds from input cost instability and competitive pressures. The volatility in synthetic ammonia price and sulfuric acid cost directly impacts producers, with price swings of over 30% in a single quarter creating profound margin uncertainty. This raw material price volatility makes long-term planning difficult.
  • Furthermore, intense fertilizer substitute competition, primarily from higher-nitrogen products, requires continuous value-based selling focused on the product's secondary nutrient benefits. On the regulatory front, concerns over nutrient runoff mitigation are leading to stricter environmental controls, such as the carbon border adjustment mechanism, which could increase compliance costs.
  • Beyond agriculture, byproduct streams from coke oven gas purification and flue gas desulfurization product must meet quality standards for diverse applications, including as a water disinfectant agent, flame retardant composition, and even as a dough conditioner agent or yeast nutrient for baking.

Exclusive Technavio Analysis on Customer Landscape

The ammonium sulfate market forecasting report includes the adoption lifecycle of the market, covering from the innovator’s stage to the laggard’s stage. It focuses on adoption rates in different regions based on penetration. Furthermore, the ammonium sulfate market report also includes key purchase criteria and drivers of price sensitivity to help companies evaluate and develop their market growth analysis strategies.

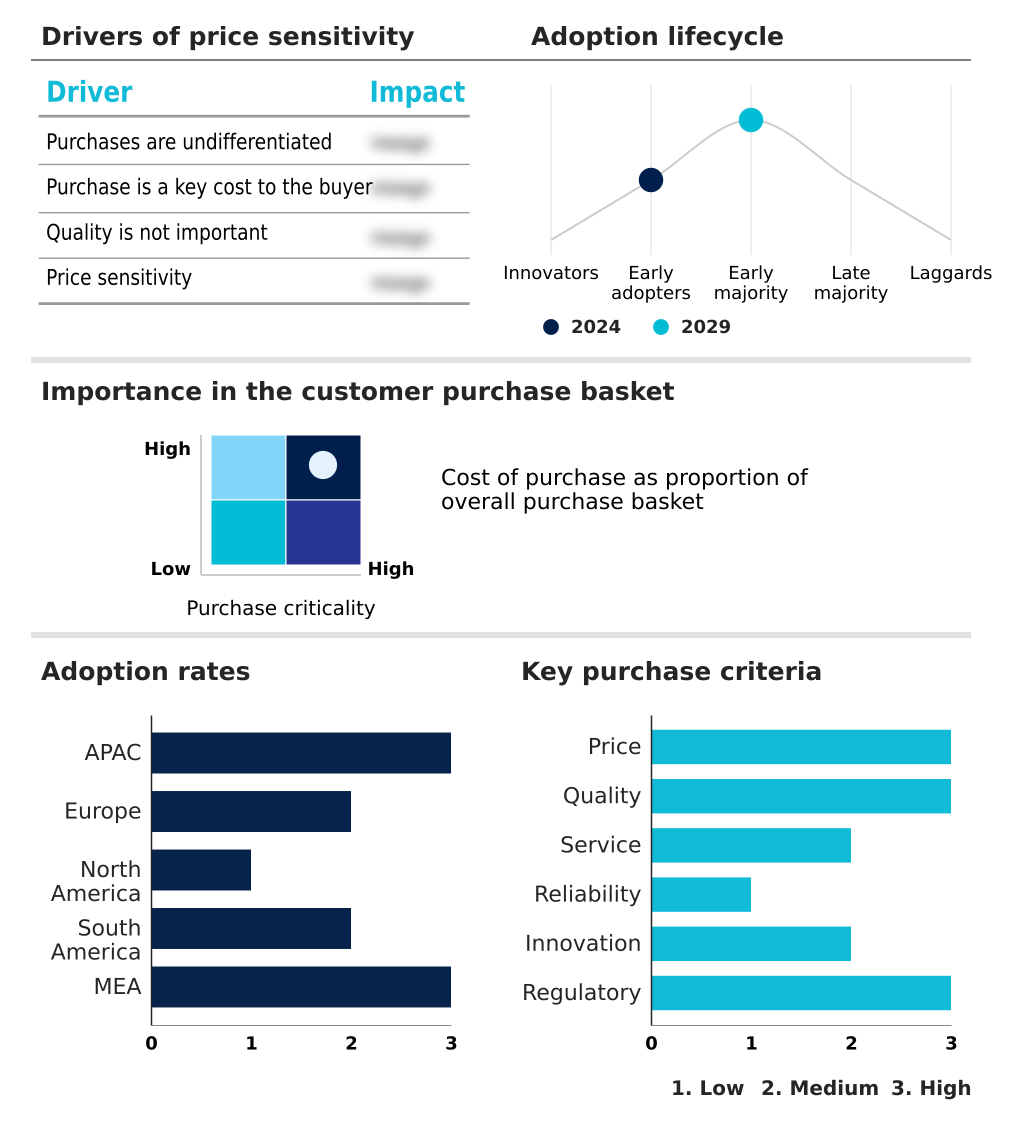
Customer Landscape of Ammonium Sulfate Industry

Competitive Landscape

Companies are implementing various strategies, such as strategic alliances, ammonium sulfate market forecast, partnerships, mergers and acquisitions, geographical expansion, and product/service launches, to enhance their presence in the industry.

Arkema Group - Offerings center on versatile ammonium sulfate for agricultural nutrient management and diverse industrial processes, addressing both crop nutrition and technical chemical requirements.

The industry research and growth report includes detailed analyses of the competitive landscape of the market and information about key companies, including:

  • Arkema Group
  • BASF SE
  • China Petrochemical Corp.
  • Domo Chemicals GmbH
  • DSM Firmenich AG
  • Evonik Industries AG
  • Honeywell International Inc.
  • Indorama Ventures Public Co. Ltd.
  • Lanxess AG
  • Martin Midstream Partners L.P.
  • Nutrien Ltd.
  • Solvay SA
  • Sumitomo Chemical Co. Ltd.
  • Ube Corp.
  • Yara International ASA

Qualitative and quantitative analysis of companies has been conducted to help clients understand the wider business environment as well as the strengths and weaknesses of key industry players. Data is qualitatively analyzed to categorize companies as pure play, category-focused, industry-focused, and diversified; it is quantitatively analyzed to categorize companies as dominant, leading, strong, tentative, and weak.

Recent Development and News in Ammonium sulfate market

  • In September, 2024, Evonik Industries AG announced the launch of a new high-purity, soluble-grade ammonium sulfate, specifically engineered for advanced fertigation systems in high-value horticulture, enhancing nutrient delivery precision.
  • In November, 2024, Nutrien Ltd. completed the acquisition of a regional fertilizer blending and distribution company, expanding its logistical footprint to improve the supply of customized NPK+S formulations to key agricultural zones.
  • In February, 2025, Lanxess AG reported the successful completion of a capacity expansion project at its European facility, increasing its output of byproduct ammonium sulfate by 15% to meet rising demand from the agricultural sector.
  • In April, 2025, BASF SE entered into a strategic partnership with a green energy firm to pilot a new production process for low-carbon ammonium sulfate, utilizing green hydrogen to reduce the carbon footprint of synthetic ammonia feedstock.

Dive into Technavio’s robust research methodology, blending expert interviews, extensive data synthesis, and validated models for unparalleled Ammonium Sulfate Market insights. See full methodology.

Market Scope
Page number 302
Base year 2024
Historic period 2019-2023
Forecast period 2025-2029
Growth momentum & CAGR Accelerate at a CAGR of 3.5%
Market growth 2025-2029 USD 971.7 million
Market structure Fragmented
YoY growth 2024-2025(%) 3.5%
Key countries China, India, Japan, Indonesia, South Korea, Australia, Germany, France, UK, The Netherlands, Spain, Italy, US, Canada, Mexico, Brazil, Argentina, Colombia, Saudi Arabia, UAE, South Africa, Israel and Turkey
Competitive landscape Leading Companies, Market Positioning of Companies, Competitive Strategies, and Industry Risks

Request Free Sample

Research Analyst Overview

  • The ammonium sulfate market operates on a complex interplay between industrial symbiosis and agricultural necessity. Its production as a caprolactam byproduct or through coke oven gas purification underpins a significant portion of the global supply, offering a cost-effective agricultural grade fertilizer.
  • Firms utilizing byproduct streams report a cost of goods sold that is on average 15-20% lower than those relying on synthetic production. This dual-source dynamic influences everything from supply chain stability to pricing. Agronomically, the product's value lies in delivering both ammoniacal nitrogen and sulfate sulfur nutrient, making it ideal for sulfur deficient soil correction and improving crop nutrient uptake.
  • The plant available sulfur it contains enhances overall nitrogen use efficiency. The market is segmented into crystalline ammonium sulfate and granular ammonium sulfate for various applications, including as a key ingredient in NPK+S formulation for a nutrient management plan.
  • Beyond the farm, it serves as an industrial grade ammonium sulfate in applications such as a flame retardant composition, a water disinfectant agent, and as a protein purification reagent via the salting out technique in biotech. It is also used as a dough conditioner agent and yeast nutrient for baking.
  • The market's future hinges on balancing the economics of direct synthesis production against byproduct streams while promoting its benefits as a soil pH regulator and a component in high-solubility fertilizer solutions.

What are the Key Data Covered in this Ammonium Sulfate Market Research and Growth Report?

  • What is the expected growth of the Ammonium Sulfate Market between 2025 and 2029?

    • USD 971.7 million, at a CAGR of 3.5%

  • What segmentation does the market report cover?

    • The report is segmented by Type (Solid, and Liquid), Application (Fertilizers, Food and feed additive, Pharmaceuticals, Water treatment, and Others), Production Area (Synthetic production, and By-product production) and Geography (APAC, Europe, North America, South America, Middle East and Africa)

  • Which regions are analyzed in the report?

    • APAC, Europe, North America, South America and Middle East and Africa

  • What are the key growth drivers and market challenges?

    • Growing global food demand, Volatility in raw material prices

  • Who are the major players in the Ammonium Sulfate Market?

    • Arkema Group, BASF SE, China Petrochemical Corp., Domo Chemicals GmbH, DSM Firmenich AG, Evonik Industries AG, Honeywell International Inc., Indorama Ventures Public Co. Ltd., Lanxess AG, Martin Midstream Partners L.P., Nutrien Ltd., Solvay SA, Sumitomo Chemical Co. Ltd., Ube Corp. and Yara International ASA

Market Research Insights

  • Market dynamics are defined by the pursuit of agricultural efficiency and sustainable industrial practices. The adoption of advanced agronomic practices leads to a greater emphasis on dual nutrient fertilizers that can correct specific soil deficiencies. This shift improves nutrient uptake by up to 15%, directly enhancing crop yields.
  • The economics of byproduct production, a core component of the circular economy in chemicals, allows for a more competitive cost structure compared to purely synthetic routes. For instance, leveraging byproduct streams can reduce the overall energy intensity of fertilizer manufacturing by over 30%.
  • However, the market is constrained by intense fertilizer substitute competition and significant raw material price volatility, which can impact producer margins and create pricing uncertainty for end-users. Firms must navigate these competing forces by emphasizing the agronomic value and cost-effectiveness of their products.

We can help! Our analysts can customize this ammonium sulfate market research report to meet your requirements.

Get in touch

1. Executive Summary

1.1 Market overview

Executive Summary - Chart on Market Overview
Executive Summary - Data Table on Market Overview
Executive Summary - Chart on Global Market Characteristics
Executive Summary - Chart on Market by Geography
Executive Summary - Chart on Market Segmentation by Type
Executive Summary - Chart on Market Segmentation by Application
Executive Summary - Chart on Market Segmentation by Production Area
Executive Summary - Chart on Incremental Growth
Executive Summary - Data Table on Incremental Growth
Executive Summary - Chart on Company Market Positioning

2. Technavio Analysis

2.1 Analysis of price sensitivity, lifecycle, customer purchase basket, adoption rates, and purchase criteria

2.2 Criticality of inputs and Factors of differentiation

Chart on Overview on criticality of inputs and factors of differentiation

2.3 Factors of disruption

Chart on Overview on factors of disruption

2.4 Impact of drivers and challenges

Chart on Impact of drivers and challenges in 2024 and 2029

3. Market Landscape

3.1 Market ecosystem

Chart on Parent Market
Data Table on - Parent Market

3.2 Market characteristics

Chart on Market characteristics analysis

3.3 Value chain analysis

Chart on Value chain analysis

4. Market Sizing

4.1 Market definition

Data Table on Offerings of companies included in the market definition

4.2 Market segment analysis

Market segments

4.3 Market size 2024

4.4 Market outlook: Forecast for 2024-2029

Chart on Global - Market size and forecast 2024-2029 ($ million)
Data Table on Global - Market size and forecast 2024-2029 ($ million)
Chart on Global Market: Year-over-year growth 2024-2029 (%)
Data Table on Global Market: Year-over-year growth 2024-2029 (%)

5. Historic Market Size

5.1 Global Ammonium Sulfate Market 2019 - 2023

Historic Market Size - Data Table on Global Ammonium Sulfate Market 2019 - 2023 ($ million)

5.2 Type segment analysis 2019 - 2023

Historic Market Size - Type Segment 2019 - 2023 ($ million)

5.3 Application segment analysis 2019 - 2023

Historic Market Size - Application Segment 2019 - 2023 ($ million)

5.4 Production Area segment analysis 2019 - 2023

Historic Market Size - Production Area Segment 2019 - 2023 ($ million)

5.5 Geography segment analysis 2019 - 2023

Historic Market Size - Geography Segment 2019 - 2023 ($ million)

5.6 Country segment analysis 2019 - 2023

Historic Market Size - Country Segment 2019 - 2023 ($ million)

6. Qualitative Analysis

6.1 Impact of AI in Global Ammonium Sulfate Market

7. Five Forces Analysis

7.1 Five forces summary

Five forces analysis - Comparison between 2024 and 2029

7.2 Bargaining power of buyers

Bargaining power of buyers - Impact of key factors 2024 and 2029

7.3 Bargaining power of suppliers

Bargaining power of suppliers - Impact of key factors in 2024 and 2029

7.4 Threat of new entrants

Threat of new entrants - Impact of key factors in 2024 and 2029

7.5 Threat of substitutes

Threat of substitutes - Impact of key factors in 2024 and 2029

7.6 Threat of rivalry

Threat of rivalry - Impact of key factors in 2024 and 2029

7.7 Market condition

Chart on Market condition - Five forces 2024 and 2029

8. Market Segmentation by Type

8.1 Market segments

Chart on Type - Market share 2024-2029 (%)
Data Table on Type - Market share 2024-2029 (%)

8.2 Comparison by Type

Chart on Comparison by Type
Data Table on Comparison by Type

8.3 Solid - Market size and forecast 2024-2029

Chart on Solid - Market size and forecast 2024-2029 ($ million)
Data Table on Solid - Market size and forecast 2024-2029 ($ million)
Chart on Solid - Year-over-year growth 2024-2029 (%)
Data Table on Solid - Year-over-year growth 2024-2029 (%)

8.4 Liquid - Market size and forecast 2024-2029

Chart on Liquid - Market size and forecast 2024-2029 ($ million)
Data Table on Liquid - Market size and forecast 2024-2029 ($ million)
Chart on Liquid - Year-over-year growth 2024-2029 (%)
Data Table on Liquid - Year-over-year growth 2024-2029 (%)

8.5 Market opportunity by Type

Market opportunity by Type ($ million)
Data Table on Market opportunity by Type ($ million)

9. Market Segmentation by Application

9.1 Market segments

Chart on Application - Market share 2024-2029 (%)
Data Table on Application - Market share 2024-2029 (%)

9.2 Comparison by Application

Chart on Comparison by Application
Data Table on Comparison by Application

9.3 Fertilizers - Market size and forecast 2024-2029

Chart on Fertilizers - Market size and forecast 2024-2029 ($ million)
Data Table on Fertilizers - Market size and forecast 2024-2029 ($ million)
Chart on Fertilizers - Year-over-year growth 2024-2029 (%)
Data Table on Fertilizers - Year-over-year growth 2024-2029 (%)

9.4 Food and feed additive - Market size and forecast 2024-2029

Chart on Food and feed additive - Market size and forecast 2024-2029 ($ million)
Data Table on Food and feed additive - Market size and forecast 2024-2029 ($ million)
Chart on Food and feed additive - Year-over-year growth 2024-2029 (%)
Data Table on Food and feed additive - Year-over-year growth 2024-2029 (%)

9.5 Pharmaceuticals - Market size and forecast 2024-2029

Chart on Pharmaceuticals - Market size and forecast 2024-2029 ($ million)
Data Table on Pharmaceuticals - Market size and forecast 2024-2029 ($ million)
Chart on Pharmaceuticals - Year-over-year growth 2024-2029 (%)
Data Table on Pharmaceuticals - Year-over-year growth 2024-2029 (%)

9.6 Water treatment - Market size and forecast 2024-2029

Chart on Water treatment - Market size and forecast 2024-2029 ($ million)
Data Table on Water treatment - Market size and forecast 2024-2029 ($ million)
Chart on Water treatment - Year-over-year growth 2024-2029 (%)
Data Table on Water treatment - Year-over-year growth 2024-2029 (%)

9.7 Others - Market size and forecast 2024-2029

Chart on Others - Market size and forecast 2024-2029 ($ million)
Data Table on Others - Market size and forecast 2024-2029 ($ million)
Chart on Others - Year-over-year growth 2024-2029 (%)
Data Table on Others - Year-over-year growth 2024-2029 (%)

9.8 Market opportunity by Application

Market opportunity by Application ($ million)
Data Table on Market opportunity by Application ($ million)

10. Market Segmentation by Production Area

10.1 Market segments

Chart on Production Area - Market share 2024-2029 (%)
Data Table on Production Area - Market share 2024-2029 (%)

10.2 Comparison by Production Area

Chart on Comparison by Production Area
Data Table on Comparison by Production Area

10.3 Synthetic production - Market size and forecast 2024-2029

Chart on Synthetic production - Market size and forecast 2024-2029 ($ million)
Data Table on Synthetic production - Market size and forecast 2024-2029 ($ million)
Chart on Synthetic production - Year-over-year growth 2024-2029 (%)
Data Table on Synthetic production - Year-over-year growth 2024-2029 (%)

10.4 By-product production - Market size and forecast 2024-2029

Chart on By-product production - Market size and forecast 2024-2029 ($ million)
Data Table on By-product production - Market size and forecast 2024-2029 ($ million)
Chart on By-product production - Year-over-year growth 2024-2029 (%)
Data Table on By-product production - Year-over-year growth 2024-2029 (%)

10.5 Market opportunity by Production Area

Market opportunity by Production Area ($ million)
Data Table on Market opportunity by Production Area ($ million)

11. Customer Landscape

11.1 Customer landscape overview

Analysis of price sensitivity, lifecycle, customer purchase basket, adoption rates, and purchase criteria

12. Geographic Landscape

12.1 Geographic segmentation

Chart on Market share by geography 2024-2029 (%)
Data Table on Market share by geography 2024-2029 (%)

12.2 Geographic comparison

Chart on Geographic comparison
Data Table on Geographic comparison

12.3 APAC - Market size and forecast 2024-2029

Chart on APAC - Market size and forecast 2024-2029 ($ million)
Data Table on APAC - Market size and forecast 2024-2029 ($ million)
Chart on APAC - Year-over-year growth 2024-2029 (%)
Data Table on APAC - Year-over-year growth 2024-2029 (%)
Chart on Regional Comparison - APAC
Data Table on Regional Comparison - APAC

12.3.1 China - Market size and forecast 2024-2029

Chart on China - Market size and forecast 2024-2029 ($ million)
Data Table on China - Market size and forecast 2024-2029 ($ million)
Chart on China - Year-over-year growth 2024-2029 (%)
Data Table on China - Year-over-year growth 2024-2029 (%)

12.3.2 India - Market size and forecast 2024-2029

Chart on India - Market size and forecast 2024-2029 ($ million)
Data Table on India - Market size and forecast 2024-2029 ($ million)
Chart on India - Year-over-year growth 2024-2029 (%)
Data Table on India - Year-over-year growth 2024-2029 (%)

12.3.3 Japan - Market size and forecast 2024-2029

Chart on Japan - Market size and forecast 2024-2029 ($ million)
Data Table on Japan - Market size and forecast 2024-2029 ($ million)
Chart on Japan - Year-over-year growth 2024-2029 (%)
Data Table on Japan - Year-over-year growth 2024-2029 (%)

12.3.4 Indonesia - Market size and forecast 2024-2029

Chart on Indonesia - Market size and forecast 2024-2029 ($ million)
Data Table on Indonesia - Market size and forecast 2024-2029 ($ million)
Chart on Indonesia - Year-over-year growth 2024-2029 (%)
Data Table on Indonesia - Year-over-year growth 2024-2029 (%)

12.3.5 South Korea - Market size and forecast 2024-2029

Chart on South Korea - Market size and forecast 2024-2029 ($ million)
Data Table on South Korea - Market size and forecast 2024-2029 ($ million)
Chart on South Korea - Year-over-year growth 2024-2029 (%)
Data Table on South Korea - Year-over-year growth 2024-2029 (%)

12.3.6 Australia - Market size and forecast 2024-2029

Chart on Australia - Market size and forecast 2024-2029 ($ million)
Data Table on Australia - Market size and forecast 2024-2029 ($ million)
Chart on Australia - Year-over-year growth 2024-2029 (%)
Data Table on Australia - Year-over-year growth 2024-2029 (%)

12.4 Europe - Market size and forecast 2024-2029

Chart on Europe - Market size and forecast 2024-2029 ($ million)
Data Table on Europe - Market size and forecast 2024-2029 ($ million)
Chart on Europe - Year-over-year growth 2024-2029 (%)
Data Table on Europe - Year-over-year growth 2024-2029 (%)
Chart on Regional Comparison - Europe
Data Table on Regional Comparison - Europe

12.4.1 Germany - Market size and forecast 2024-2029

Chart on Germany - Market size and forecast 2024-2029 ($ million)
Data Table on Germany - Market size and forecast 2024-2029 ($ million)
Chart on Germany - Year-over-year growth 2024-2029 (%)
Data Table on Germany - Year-over-year growth 2024-2029 (%)

12.4.2 France - Market size and forecast 2024-2029

Chart on France - Market size and forecast 2024-2029 ($ million)
Data Table on France - Market size and forecast 2024-2029 ($ million)
Chart on France - Year-over-year growth 2024-2029 (%)
Data Table on France - Year-over-year growth 2024-2029 (%)

12.4.3 UK - Market size and forecast 2024-2029

Chart on UK - Market size and forecast 2024-2029 ($ million)
Data Table on UK - Market size and forecast 2024-2029 ($ million)
Chart on UK - Year-over-year growth 2024-2029 (%)
Data Table on UK - Year-over-year growth 2024-2029 (%)

12.4.4 The Netherlands - Market size and forecast 2024-2029

Chart on The Netherlands - Market size and forecast 2024-2029 ($ million)
Data Table on The Netherlands - Market size and forecast 2024-2029 ($ million)
Chart on The Netherlands - Year-over-year growth 2024-2029 (%)
Data Table on The Netherlands - Year-over-year growth 2024-2029 (%)

12.4.5 Spain - Market size and forecast 2024-2029

Chart on Spain - Market size and forecast 2024-2029 ($ million)
Data Table on Spain - Market size and forecast 2024-2029 ($ million)
Chart on Spain - Year-over-year growth 2024-2029 (%)
Data Table on Spain - Year-over-year growth 2024-2029 (%)

12.4.6 Italy - Market size and forecast 2024-2029

Chart on Italy - Market size and forecast 2024-2029 ($ million)
Data Table on Italy - Market size and forecast 2024-2029 ($ million)
Chart on Italy - Year-over-year growth 2024-2029 (%)
Data Table on Italy - Year-over-year growth 2024-2029 (%)

12.5 North America - Market size and forecast 2024-2029

Chart on North America - Market size and forecast 2024-2029 ($ million)
Data Table on North America - Market size and forecast 2024-2029 ($ million)
Chart on North America - Year-over-year growth 2024-2029 (%)
Data Table on North America - Year-over-year growth 2024-2029 (%)
Chart on Regional Comparison - North America
Data Table on Regional Comparison - North America

12.5.1 US - Market size and forecast 2024-2029

Chart on US - Market size and forecast 2024-2029 ($ million)
Data Table on US - Market size and forecast 2024-2029 ($ million)
Chart on US - Year-over-year growth 2024-2029 (%)
Data Table on US - Year-over-year growth 2024-2029 (%)

12.5.2 Canada - Market size and forecast 2024-2029

Chart on Canada - Market size and forecast 2024-2029 ($ million)
Data Table on Canada - Market size and forecast 2024-2029 ($ million)
Chart on Canada - Year-over-year growth 2024-2029 (%)
Data Table on Canada - Year-over-year growth 2024-2029 (%)

12.5.3 Mexico - Market size and forecast 2024-2029

Chart on Mexico - Market size and forecast 2024-2029 ($ million)
Data Table on Mexico - Market size and forecast 2024-2029 ($ million)
Chart on Mexico - Year-over-year growth 2024-2029 (%)
Data Table on Mexico - Year-over-year growth 2024-2029 (%)

12.6 South America - Market size and forecast 2024-2029

Chart on South America - Market size and forecast 2024-2029 ($ million)
Data Table on South America - Market size and forecast 2024-2029 ($ million)
Chart on South America - Year-over-year growth 2024-2029 (%)
Data Table on South America - Year-over-year growth 2024-2029 (%)
Chart on Regional Comparison - South America
Data Table on Regional Comparison - South America

12.6.1 Brazil - Market size and forecast 2024-2029

Chart on Brazil - Market size and forecast 2024-2029 ($ million)
Data Table on Brazil - Market size and forecast 2024-2029 ($ million)
Chart on Brazil - Year-over-year growth 2024-2029 (%)
Data Table on Brazil - Year-over-year growth 2024-2029 (%)

12.6.2 Argentina - Market size and forecast 2024-2029

Chart on Argentina - Market size and forecast 2024-2029 ($ million)
Data Table on Argentina - Market size and forecast 2024-2029 ($ million)
Chart on Argentina - Year-over-year growth 2024-2029 (%)
Data Table on Argentina - Year-over-year growth 2024-2029 (%)

12.6.3 Colombia - Market size and forecast 2024-2029

Chart on Colombia - Market size and forecast 2024-2029 ($ million)
Data Table on Colombia - Market size and forecast 2024-2029 ($ million)
Chart on Colombia - Year-over-year growth 2024-2029 (%)
Data Table on Colombia - Year-over-year growth 2024-2029 (%)

12.7 Middle East and Africa - Market size and forecast 2024-2029

Chart on Middle East and Africa - Market size and forecast 2024-2029 ($ million)
Data Table on Middle East and Africa - Market size and forecast 2024-2029 ($ million)
Chart on Middle East and Africa - Year-over-year growth 2024-2029 (%)
Data Table on Middle East and Africa - Year-over-year growth 2024-2029 (%)
Chart on Regional Comparison - Middle East and Africa
Data Table on Regional Comparison - Middle East and Africa

12.7.1 Saudi Arabia - Market size and forecast 2024-2029

Chart on Saudi Arabia - Market size and forecast 2024-2029 ($ million)
Data Table on Saudi Arabia - Market size and forecast 2024-2029 ($ million)
Chart on Saudi Arabia - Year-over-year growth 2024-2029 (%)
Data Table on Saudi Arabia - Year-over-year growth 2024-2029 (%)

12.7.2 UAE - Market size and forecast 2024-2029

Chart on UAE - Market size and forecast 2024-2029 ($ million)
Data Table on UAE - Market size and forecast 2024-2029 ($ million)
Chart on UAE - Year-over-year growth 2024-2029 (%)
Data Table on UAE - Year-over-year growth 2024-2029 (%)

12.7.3 South Africa - Market size and forecast 2024-2029

Chart on South Africa - Market size and forecast 2024-2029 ($ million)
Data Table on South Africa - Market size and forecast 2024-2029 ($ million)
Chart on South Africa - Year-over-year growth 2024-2029 (%)
Data Table on South Africa - Year-over-year growth 2024-2029 (%)

12.7.4 Israel - Market size and forecast 2024-2029

Chart on Israel - Market size and forecast 2024-2029 ($ million)
Data Table on Israel - Market size and forecast 2024-2029 ($ million)
Chart on Israel - Year-over-year growth 2024-2029 (%)
Data Table on Israel - Year-over-year growth 2024-2029 (%)

12.7.5 Turkey - Market size and forecast 2024-2029

Chart on Turkey - Market size and forecast 2024-2029 ($ million)
Data Table on Turkey - Market size and forecast 2024-2029 ($ million)
Chart on Turkey - Year-over-year growth 2024-2029 (%)
Data Table on Turkey - Year-over-year growth 2024-2029 (%)

12.8 Market opportunity by geography

Market opportunity by geography ($ million)
Data Tables on Market opportunity by geography ($ million)

13. Drivers, Challenges, and Opportunity

13.1 Market drivers

Growing global food demand
Increasing prevalence of sulfur deficient soils
Cost effectiveness as industrial byproduct

13.2 Market challenges

Volatility in raw material prices
Intense competition from substitute fertilizers
Environmental concerns and regulatory pressures

13.3 Impact of drivers and challenges

Impact of drivers and challenges in 2024 and 2029

13.4 Market opportunities

Increasing focus on balanced fertilization
Adoption of precision agriculture technologies
Growing emphasis on circular economy

14. Competitive Landscape

14.1 Overview

14.2

Overview on criticality of inputs and factors of differentiation

14.3 Landscape disruption

Overview on factors of disruption

14.4 Industry risks

Impact of key risks on business

15. Competitive Analysis

15.1 Companies profiled

Companies covered

15.2 Company ranking index

15.3 Market positioning of companies

Matrix on companies position and classification

15.4 Arkema Group

Arkema Group - Overview
Arkema Group - Business segments
Arkema Group - Key news
Arkema Group - Key offerings
Arkema Group - Segment focus
SWOT

15.5 BASF SE

BASF SE - Overview
BASF SE - Business segments
BASF SE - Key news
BASF SE - Key offerings
BASF SE - Segment focus
SWOT

15.6 China Petrochemical Corp.

China Petrochemical Corp. - Overview
China Petrochemical Corp. - Business segments
China Petrochemical Corp. - Key offerings
China Petrochemical Corp. - Segment focus
SWOT

15.7 Domo Chemicals GmbH

Domo Chemicals GmbH - Overview
Domo Chemicals GmbH - Product / Service
Domo Chemicals GmbH - Key offerings
SWOT

15.8 DSM Firmenich AG

DSM Firmenich AG - Overview
DSM Firmenich AG - Product / Service
DSM Firmenich AG - Key offerings
SWOT

15.9 Evonik Industries AG

Evonik Industries AG - Overview
Evonik Industries AG - Business segments
Evonik Industries AG - Key news
Evonik Industries AG - Key offerings
Evonik Industries AG - Segment focus
SWOT

15.10 Honeywell International Inc.

Honeywell International Inc. - Overview
Honeywell International Inc. - Business segments
Honeywell International Inc. - Key news
Honeywell International Inc. - Key offerings
Honeywell International Inc. - Segment focus
SWOT

15.11 Indorama Ventures Public Co. Ltd.

Indorama Ventures Public Co. Ltd. - Overview
Indorama Ventures Public Co. Ltd. - Business segments
Indorama Ventures Public Co. Ltd. - Key offerings
Indorama Ventures Public Co. Ltd. - Segment focus
SWOT

15.12 Lanxess AG

Lanxess AG - Overview
Lanxess AG - Business segments
Lanxess AG - Key news
Lanxess AG - Key offerings
Lanxess AG - Segment focus
SWOT

15.13 Martin Midstream Partners L.P.

Martin Midstream Partners L.P. - Overview
Martin Midstream Partners L.P. - Product / Service
Martin Midstream Partners L.P. - Key offerings
SWOT

15.14 Nutrien Ltd.

Nutrien Ltd. - Overview
Nutrien Ltd. - Business segments
Nutrien Ltd. - Key offerings
Nutrien Ltd. - Segment focus
SWOT

15.15 Solvay SA

Solvay SA - Overview
Solvay SA - Business segments
Solvay SA - Key news
Solvay SA - Key offerings
Solvay SA - Segment focus
SWOT

15.16 Sumitomo Chemical Co. Ltd.

Sumitomo Chemical Co. Ltd. - Overview
Sumitomo Chemical Co. Ltd. - Business segments
Sumitomo Chemical Co. Ltd. - Key offerings
Sumitomo Chemical Co. Ltd. - Segment focus
SWOT

15.17 Ube Corp.

Ube Corp. - Overview
Ube Corp. - Business segments
Ube Corp. - Key offerings
Ube Corp. - Segment focus
SWOT

15.18 Yara International ASA

Yara International ASA - Overview
Yara International ASA - Business segments
Yara International ASA - Key offerings
Yara International ASA - Segment focus
SWOT

16. Appendix

16.1 Scope of the report

Market definition
Objectives
Notes and caveats

16.2 Inclusions and exclusions checklist

Inclusions checklist
Exclusions checklist

16.3 Currency conversion rates for US$

16.4 Research methodology

16.5 Data procurement

Information sources

16.6 Data validation

16.7 Validation techniques employed for market sizing

16.8 Data synthesis

16.9 360 degree market analysis

16.10 List of abbreviations

Research Methodology

Technavio presents a detailed picture of the market by way of study, synthesis, and summation of data from multiple sources. The analysts have presented the various facets of the market with a particular focus on identifying the key industry influencers. The data thus presented is comprehensive, reliable, and the result of extensive research, both primary and secondary.

INFORMATION SOURCES

Primary sources

  • Manufacturers and suppliers
  • Channel partners
  • Industry experts
  • Strategic decision makers

Secondary sources

  • Industry journals and periodicals
  • Government data
  • Financial reports of key industry players
  • Historical data
  • Press releases

DATA ANALYSIS

Data Synthesis

  • Collation of data
  • Estimation of key figures
  • Analysis of derived insights

Data Validation

  • Triangulation with data models
  • Reference against proprietary databases
  • Corroboration with industry experts

REPORT WRITING

Qualitative

  • Market drivers
  • Market challenges
  • Market trends
  • Five forces analysis

Quantitative

  • Market size and forecast
  • Market segmentation
  • Geographical insights
  • Competitive landscape

Interested in this report?

Get your sample now to see our research methodology and insights!

Download Now

Frequently Asked Questions

Ammonium Sulfate market growth will increase by USD 971.7 million during 2025-2029 .

The Ammonium Sulfate market is expected to grow at a CAGR of 3.5% during 2025-2029 .

Ammonium Sulfate market is segmented by Type (Solid, Liquid) Application (Fertilizers, Food and feed additive, Pharmaceuticals, Water treatment, Others) Production area (Synthetic production, By-product production)

Arkema Group, BASF SE, China Petrochemical Corp., Domo Chemicals GmbH, DSM Firmenich AG, Evonik Industries AG, Honeywell International Inc., Indorama Ventures Public Co. Ltd., Lanxess AG, Martin Midstream Partners L.P., Nutrien Ltd., Solvay SA, Sumitomo Chemical Co. Ltd., Ube Corp., Yara International ASA are a few of the key vendors in the Ammonium Sulfate market.

APAC will register the highest growth rate of 53.5% among the other regions. Therefore, the Ammonium Sulfate market in APAC is expected to garner significant business opportunities for the vendors during the forecast period.

China, India, Japan, Indonesia, South Korea, Australia, Germany, France, UK, The Netherlands, Spain, Italy, US, Canada, Mexico, Brazil, Argentina, Colombia, Saudi Arabia, UAE, South Africa, Israel, Turkey

  • Growing global food demand is the driving factor this market.

The Ammonium Sulfate market vendors should focus on grabbing business opportunities from the Type segment as it accounted for the largest market share in the base year.