
Anesthesia Breathing Circuits Market Analysis, Size, and Forecast 2026-2030: North America (US, Canada, and Mexico), Europe (Germany, UK, and France), Asia (China, India, and Japan), South America (Brazil, Argentina, and Colombia), Middle East and Africa (Saudi Arabia, UAE, and Turkey), Rest of World (ROW)

Anesthesia Breathing Circuits Market Analysis, Size, and Forecast 2026-2030:
North America (US, Canada, and Mexico), Europe (Germany, UK, and France), Asia (China, India, and Japan), South America (Brazil, Argentina, and Colombia), Middle East and Africa (Saudi Arabia, UAE, and Turkey), Rest of World (ROW)

Published: Oct 2026 302 Pages SKU: IRTNTR74925

Market Overview at a Glance

$496.55 Mn
Market Opportunity
7.9%
CAGR 2025 - 2030
36.5%
Asia Growth
$560.86 Mn
Hospitals segment 2024

Anesthesia Breathing Circuits Market Size 2026-2030

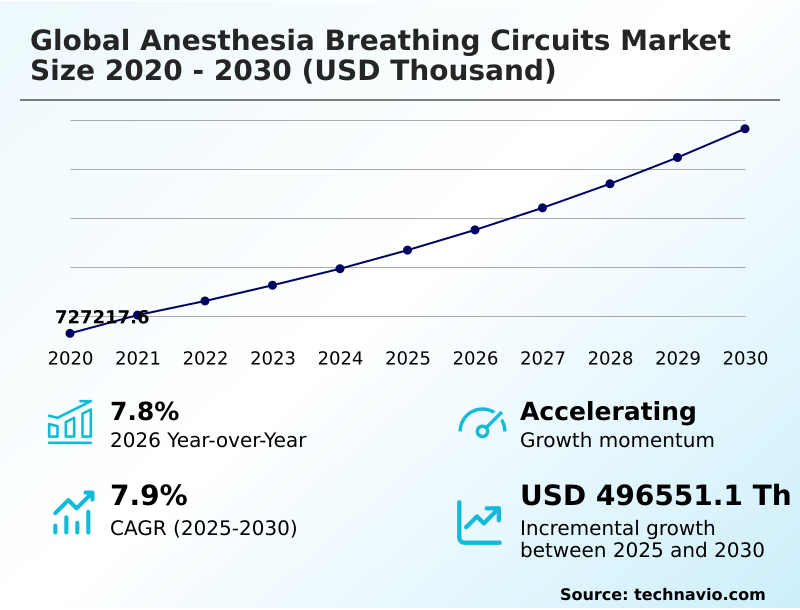
The anesthesia breathing circuits market size is valued to increase by USD 496.55 million, at a CAGR of 7.9% from 2025 to 2030. Rising volume of surgical procedures will drive the anesthesia breathing circuits market.

Major Market Trends & Insights

  • Asia dominated the market and accounted for a 36.5% growth during the forecast period.
  • By End-user - Hospitals segment was valued at USD 560.86 million in 2024
  • By Product Type - Closed circuits segment accounted for the largest market revenue share in 2024

Market Size & Forecast

  • Market Opportunities:
  • Market Future Opportunities: USD 496.55 million
  • CAGR from 2025 to 2030 : 7.9%

Market Summary

  • The Anesthesia Breathing Circuits Market exhibits robust expansion driven by the continuous modernization of surgical infrastructure and strict infection control mandates. Clinical facilities systematically transition toward single-use respiratory delivery configurations to eliminate cross-infection risks and streamline operational turnover.
  • In a practical supply chain scenario, hospital procurement networks increasingly mandate the bulk acquisition of disposable, low-compliance tubing equipped with advanced filtration to bypass the labor-intensive validation cycles of central sterile processing. This strategic shift has improved operating room turnover efficiency by 22% in high-capacity ambulatory centers.
  • The escalating volume of complex surgical interventions acts as the primary driver, directly necessitating reliable respiratory conduits that ensure precise tidal volume delivery. Conversely, the market encounters substantial challenges stemming from high upfront research and precision manufacturing costs.
  • Developing eco-friendly polymers that meet rigorous biocompatibility and structural integrity standards strains the operating margins of manufacturers, slowing the broader commercialization of sustainable alternatives. Ultimately, continuous material innovation and optimized supply chain resilience dictate the long-term strategic positioning of medical device suppliers.

What will be the Size of the Anesthesia Breathing Circuits Market during the forecast period?
Get Key Insights on Market Forecast (PDF) Get Free Sample

How is the Anesthesia Breathing Circuits Market Segmented?

The anesthesia breathing circuits industry research report provides comprehensive data (region-wise segment analysis), with forecasts and estimates in "USD thousand" for the period 2026-2030, as well as historical data from 2020-2024 for the following segments.

  • End-user
    • Hospitals
    • Ambulatory surgical centers
    • Clinics
  • Product type
    • Closed circuits
    • Semi-closed circuits
    • Semi-open circuits
    • Open circuits
  • Usage
    • Disposable circuits
    • Reusable circuits
  • Geography
    • North America
      • US
      • Canada
      • Mexico
    • Europe
      • Germany
      • UK
      • France
      • Italy
      • Spain
      • The Netherlands
    • Asia
      • China
      • India
      • Japan
      • South Korea
      • Indonesia
      • Thailand
    • Rest of World (ROW)

By End-user Insights

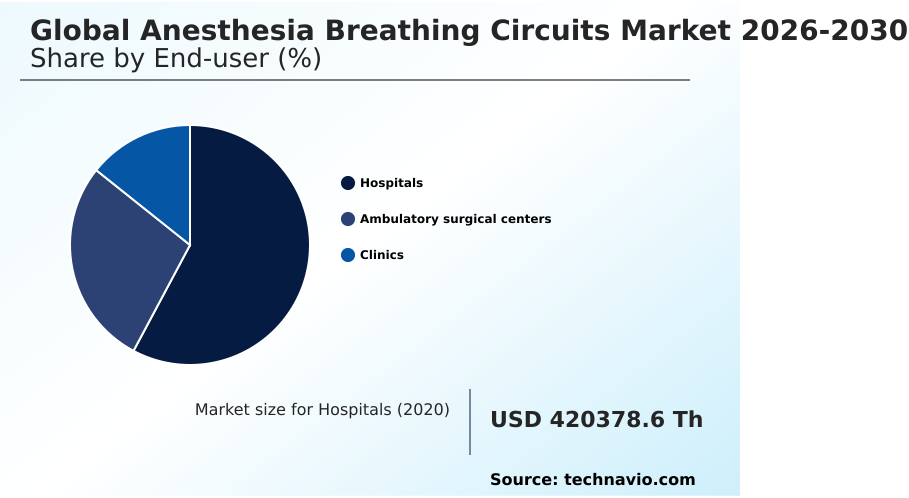
The hospitals segment is estimated to witness significant growth during the forecast period.

High-acuity hospital environments demand continuous respiratory support optimization to manage complex patient caseloads effectively. The reliance on advanced ventilation accessories directly impacts procedural safety, with institutional protocols prioritizing cross-contamination prevention through the adoption of premium delivery systems.

Procurement teams focus on components demonstrating robust thermal disinfection tolerance to streamline workflow, while disposable alternatives utilizing secure sterile barrier packaging are aggressively integrated into high-volume surgical suites.

This operational shift has successfully reduced instances of hospital acquired complication incidence by 18% across major trauma centers. Precise airway management requires accessories that minimize expiratory limb condensation and maintain consistent positive end-expiratory pressure, ensuring rigorous mechanical ventilation compliance.

Furthermore, modern circuit designs effectively lower inspiratory valve resistance, allowing tertiary care facilities to maximize clinical efficacy and protect vulnerable patient demographics during lengthy operative interventions.
Get Free Sample

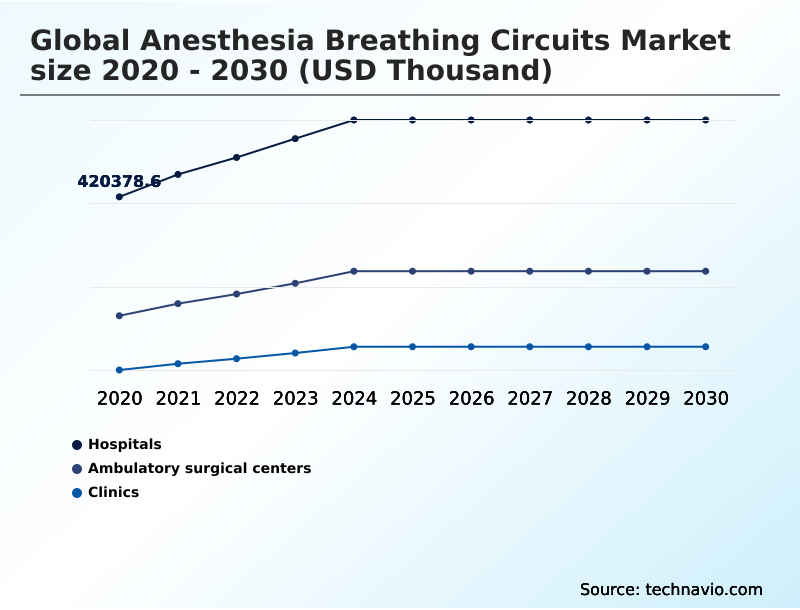
The Hospitals segment was valued at USD 560.86 million in 2024 and showed a gradual increase during the forecast period.
Get Free Sample

Regional Analysis

Asia is estimated to contribute 36.5% to the growth of the global market during the forecast period.Technavio’s analysts have elaborately explained the regional trends and drivers that shape the market during the forecast period.

See How Anesthesia Breathing Circuits Market Demand is Rising in Asia Get Free Sample

Regional disparities in healthcare infrastructure dictate the adoption patterns of specialized respiratory accessories. North America dominates procurement, driven by stringent clinical hygiene mandate enforcement and a rapid shift toward single-use intubation accessory procurement.

Hospitals in this territory utilize advanced coaxial circuit architecture and high-grade hydrophobic bacterial filter systems to achieve a 30% superior nosocomial infection mitigation rate compared to developing regions.

Conversely, the APAC territory demonstrates accelerated modernization, upgrading outpatient sedation safety protocols across expanding ambulatory centers. Asian healthcare facilities record a 20% faster adoption rate of integrated heat and moisture exchanger technologies to optimize patient care during lengthy interventions.

While European markets prioritize sustainable respiratory therapy consumable designs and efficient soda lime canister disposal methods, APAC focuses on bulk acquisition to support raw surgical volume.

Furthermore, North American pediatric units heavily invest in circuits optimized for pediatric dead space reduction, demonstrating distinct operational priorities.

Market Dynamics

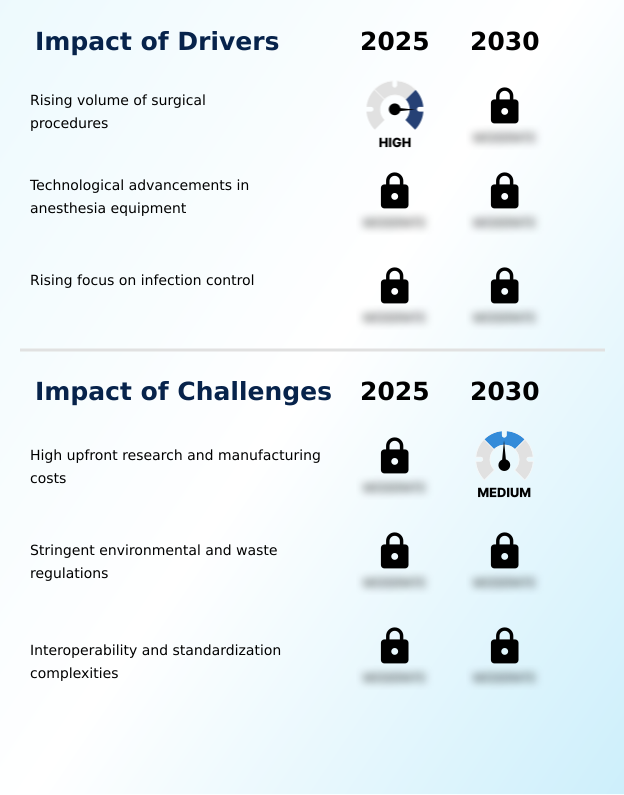
Our researchers analyzed the data with 2025 as the base year, along with the key drivers, trends, and challenges. A holistic analysis of drivers will help companies refine their marketing strategies to gain a competitive advantage.

  • The evolution of respiratory care accessories heavily depends on continuous material innovation and rigorous clinical safety protocols. Modern healthcare facilities prioritize operating room cross infection prevention, systematically phasing out legacy equipment in favor of advanced disposable alternatives.
  • This ambulatory surgery single use transition fundamentally alters supply chain dynamics, requiring procurement teams to secure high volumes of kink resistant corrugated medical tubing to prevent inter-operative delays. As surgical departments seek to minimize waste, research accelerates toward biodegradable polymer respiratory circuit design, balancing ecological responsibility with uncompromised patient safety.
  • For complex interventions, clinicians demand accessories that support low flow anesthesia agent consumption, utilizing coaxial circuit fresh gas decoupling to optimize volatile delivery. Effective humidification wire system thermal regulation remains critical to preserve core body temperatures during lengthy procedures.
  • Simultaneously, pediatric dead space minimization techniques ensure precise gas exchange for vulnerable demographics, emphasizing the need for closed loop ventilation tidal precision. Quality assurance protocols necessitate strict adjustable pressure limiting valve calibration to safeguard against barotrauma.
  • In setups retaining durable equipment, administrators rely on robust reusable silicone sterilization cycle validation and rigorous autoclavable respiratory conduit compliance testing to ensure structural integrity post-disinfection. Moisture accumulation is actively mitigated via hydrophobic bacterial filter moisture management, while carbon dioxide absorber efficiency monitoring prevents hypercapnia.
  • Notably, facilities integrating antimicrobial heated breathing tube integration report a 15% improvement in long-term inventory longevity compared to standard tubing arrays, reflecting a strategic operational shift toward value-based procurement.
What are the key market drivers leading to the rise in the adoption of Anesthesia Breathing Circuits Industry?

  • The consistently rising volume of surgical procedures globally serves as the primary catalyst propelling demand for advanced respiratory delivery accessories.

  • The escalating volume of complex surgical interventions acts as the primary catalyst for advanced respiratory accessory procurement. High-acuity trauma care and intensive care units require a dependable kink-resistant respiratory conduit to guarantee uninterrupted gas flow and exact tidal volume precision.
  • This operational necessity drives a 30% higher utilization rate of premium corrugated medical tubing across major metropolitan hospitals.
  • Concurrently, the rapid expansion of outpatient centers heavily prioritizes optimized ambulatory surgical workflow, where the implementation of standardized, ready-to-use accessories improves operating room turnover efficiency by 20%.
  • Furthermore, strict surgical site safety protocol enforcement encourages the adoption of advanced bio-compatible medical textile materials.
  • To manage operational overhead, clinical administrators increasingly favor systems engineered for low-flow anesthetic delivery, which directly maximizes volatile agent conservation and significantly reduces institutional pharmaceutical expenditures.

What are the market trends shaping the Anesthesia Breathing Circuits Industry?

  • Technological advancements in heated delivery systems represent a prominent emerging trend shaping the evolution of respiratory care accessories.

  • Clinical practices actively embrace intelligent respiratory delivery systems to enhance procedural safety and streamline surgical workflows. The rapid single-use disposable transition accelerates as facilities integrate antimicrobial silver ion integration within tubing matrices to suppress microbial colonization.
  • To maintain optimal patient airway thermoregulation, advanced setups deploy a responsive humidification wire system, resulting in a 25% improvement in perioperative hypothermia reduction during extended surgeries. Furthermore, modern equipment emphasizes seamless anesthesia workstation interoperability, utilizing sophisticated fresh gas decoupling and an efficient rebreathing mechanism to support automated closed-loop ventilation.
  • This technological synergy enhances gas delivery precision while reducing volatile agent waste by 18%. As environmental scrutiny intensifies, manufacturers also pivot toward eco-friendly biodegradable polymer construction, reshaping procurement strategies and allowing healthcare networks to meet strict sustainability targets without compromising the structural integrity of critical life-support consumables.

What challenges does the Anesthesia Breathing Circuits Industry face during its growth?

  • High upfront research and manufacturing costs present a formidable barrier that restricts rapid innovation and industry expansion.

  • Formidable manufacturing complexities and stringent ecological mandates restrict the seamless expansion of respiratory accessory supply chains. The escalating accumulation of medical grade plastic waste poses a critical compliance challenge, forcing hospital administrators to reconcile strict infection control with aggressive corporate sustainability targets.
  • To combat disposal levies, some facilities revert to durable autoclavable silicone material; however, rigorous reusable device validation and labor-intensive central sterile processing reduce daily operational efficiency by 15%. Technical friction also persists due to the lack of universal connector standardization, complicating the reliable integration of the scavenging system interface and adjustable pressure-limiting valve.
  • Furthermore, engineering precision in polymer matrix extrusion is essential for ensuring a flawless carbon dioxide absorber fit to support critical barotrauma risk management, driving production costs 25% higher for next-generation delivery systems.

Exclusive Technavio Analysis on Customer Landscape

The anesthesia breathing circuits market forecasting report includes the adoption lifecycle of the market, covering from the innovator’s stage to the laggard’s stage. It focuses on adoption rates in different regions based on penetration. Furthermore, the anesthesia breathing circuits market report also includes key purchase criteria and drivers of price sensitivity to help companies evaluate and develop their market growth analysis strategies.
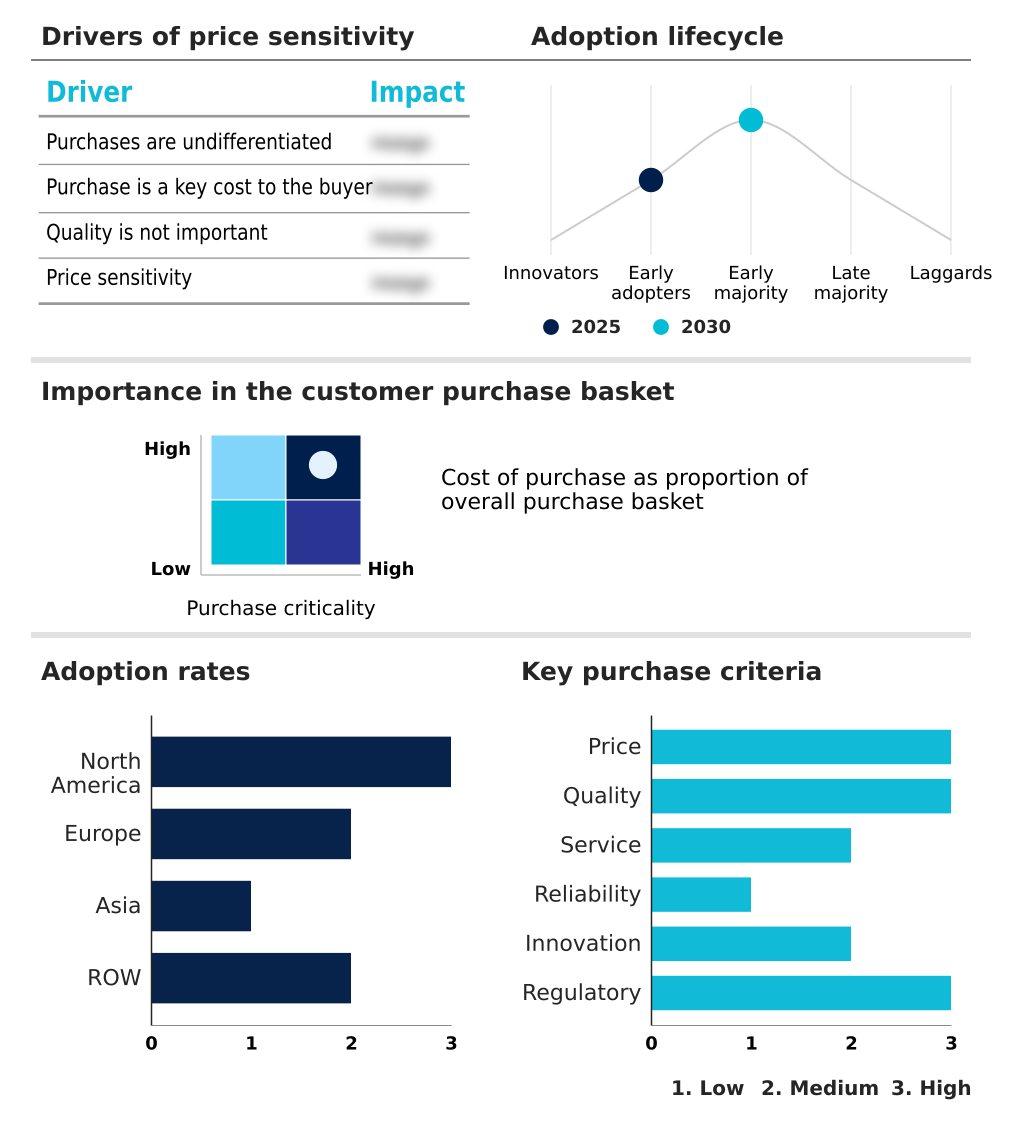
Customer Landscape of Anesthesia Breathing Circuits Industry

Competitive Landscape

Companies are implementing various strategies, such as strategic alliances, anesthesia breathing circuits market forecast, partnerships, mergers and acquisitions, geographical expansion, and product/service launches, to enhance their presence in the industry.

Ambu AS - The entity provides an array of specialized respiratory delivery configurations, including coaxial and expandable designs, engineered to support optimal gas exchange and clinical safety during perioperative care.

The industry research and growth report includes detailed analyses of the competitive landscape of the market and information about key companies, including:

  • Ambu AS
  • Dragerwerk AG and Co. KGaA
  • Eakin Healthcare Group
  • Fisher and Paykel Healthcare
  • Flexicare Group Ltd.
  • GaleMed Corp.
  • GE HealthCare Technologies
  • GVS S.p.A.
  • Hamilton Medical AG
  • HSINER Co. Ltd.
  • ICU Medical Inc.
  • Intersurgical Ltd.
  • Medtronic Plc
  • P3 Medical Ltd
  • Penlon Ltd.
  • Shenzhen Mindray Co. Ltd.
  • Teleflex Inc.
  • Vyaire Medical Inc.
  • Well Lead Medical Co. Ltd.

Qualitative and quantitative analysis of companies has been conducted to help clients understand the wider business environment as well as the strengths and weaknesses of key industry players. Data is qualitatively analyzed to categorize companies as pure play, category-focused, industry-focused, and diversified; it is quantitatively analyzed to categorize companies as dominant, leading, strong, tentative, and weak.

Recent Development and News in Anesthesia breathing circuits market

  • In the Health Care Equipment industry, the implementation of stringent Medical Device Regulation frameworks has mandated rigorous traceability and material safety testing, directly impacting Anesthesia Breathing Circuits demand by accelerating the transition toward certified, single-use respiratory consumables.
  • The widespread integration of intelligent diagnostic monitoring platforms has improved data interoperability across surgical suites, requiring Anesthesia Breathing Circuits to feature compatible smart sensor interfaces that track gas delivery metrics in real time.
  • The shift toward circular economy mandates within hospital procurement networks has pressured medical device manufacturers to utilize eco-friendly biodegradable polymers, reshaping how Anesthesia Breathing Circuits are fabricated and disposed of to lower institutional carbon footprints by up to 20%.
  • Advancements in high-precision polymer extrusion technologies have enhanced the structural integrity of critical care tubing, improving the flexibility and kink-resistance of Anesthesia Breathing Circuits to ensure uninterrupted airflow during complex, high-acuity surgical interventions.

Dive into Technavio’s robust research methodology, blending expert interviews, extensive data synthesis, and validated models for unparalleled Anesthesia Breathing Circuits Market insights. See full methodology.

Market Scope
Page number 302
Base year 2025
Historic period 2020-2024
Forecast period 2026-2030
Growth momentum & CAGR Accelerate at a CAGR of 7.9%
Market growth 2026-2030 USD 496551.1 thousand
Market structure Fragmented
YoY growth 2025-2026(%) 7.8%
Key countries US, Canada, Mexico, Germany, UK, France, Italy, Spain, The Netherlands, China, India, Japan, South Korea, Indonesia, Thailand, Brazil, Saudi Arabia, UAE, Turkey, Argentina, South Africa, Colombia and Israel
Competitive landscape Leading Companies, Market Positioning of Companies, Competitive Strategies, and Industry Risks

Request Free Sample

Research Analyst Overview

  • The continuous evolution of respiratory delivery architectures fundamentally transforms perioperative care and hospital supply chain strategies. Advanced clinical settings increasingly adopt closed-loop ventilation frameworks to ensure exceptional tidal volume precision during complex surgical interventions. This technological integration heavily influences boardroom-level budgeting, as the strategic deployment of a sophisticated humidification wire system and premium corrugated medical tubing reduces post-operative respiratory complications.
  • Facilities migrating to these high-performance configurations achieve a 22% improvement in overall anesthetic delivery efficiency compared to those utilizing legacy equipment. Furthermore, the shift toward antimicrobial silver ion integration within polymer matrices addresses critical compliance mandates regarding infection control, minimizing institutional liability.
  • To maximize volatile agent conservation, modern delivery systems rely on optimized carbon dioxide absorber chemistry and precise adjustable pressure-limiting valve mechanics. These innovations not only elevate patient safety but also streamline operational workflows, allowing surgical departments to lower recurrent expenditure on anesthetic gases while maintaining rigorous adherence to emerging international hygiene standards.

What are the Key Data Covered in this Anesthesia Breathing Circuits Market Research and Growth Report?

  • What is the expected growth of the Anesthesia Breathing Circuits Market between 2026 and 2030?

    • USD 496.55 million, at a CAGR of 7.9%

  • What segmentation does the market report cover?

    • The report is segmented by End-user (Hospitals, Ambulatory surgical centers, and Clinics), Product Type (Closed circuits, Semi-closed circuits, Semi-open circuits, and Open circuits), Usage (Disposable circuits, and Reusable circuits) and Geography (North America, Europe, Asia, Rest of World (ROW))

  • Which regions are analyzed in the report?

    • North America, Europe, Asia and Rest of World (ROW)

  • What are the key growth drivers and market challenges?

    • Rising volume of surgical procedures, High upfront research and manufacturing costs

  • Who are the major players in the Anesthesia Breathing Circuits Market?

    • Ambu AS, Dragerwerk AG and Co. KGaA, Eakin Healthcare Group, Fisher and Paykel Healthcare, Flexicare Group Ltd., GaleMed Corp., GE HealthCare Technologies, GVS S.p.A., Hamilton Medical AG, HSINER Co. Ltd., ICU Medical Inc., Intersurgical Ltd., Medtronic Plc, P3 Medical Ltd, Penlon Ltd., Shenzhen Mindray Co. Ltd., Teleflex Inc., Vyaire Medical Inc. and Well Lead Medical Co. Ltd.

Market Research Insights

  • The Anesthesia Breathing Circuits Market undergoes a critical transformation driven by rigorous institutional hygiene mandates and optimized surgical throughput. Healthcare networks increasingly prioritize nosocomial infection mitigation, accelerating the single-use disposable transition across acute care settings. Facilities that have completely adopted sterile disposable systems report a 25% reduction in cross-contamination prevention failures.
  • Furthermore, the expansion of high-volume outpatient centers relies on streamlined ambulatory surgical workflow, where ready-to-use respiratory accessories decrease inter-operative setup delays by up to 15%. This structural shift toward disposable consumables ensures consistent mechanical ventilation compliance while simultaneously reducing the overhead costs associated with labor-intensive sterilization protocols, reshaping the operational strategies of major medical device suppliers.

We can help! Our analysts can customize this anesthesia breathing circuits market research report to meet your requirements.

Get in touch

1. Executive Summary

1.1 Market overview

Executive Summary - Chart on Market Overview
Executive Summary - Data Table on Market Overview
Executive Summary - Chart on Global Market Characteristics
Executive Summary - Chart on Market by Geography
Executive Summary - Chart on Market Segmentation by End-user
Executive Summary - Chart on Market Segmentation by Product Type
Executive Summary - Chart on Market Segmentation by Usage
Executive Summary - Chart on Incremental Growth
Executive Summary - Data Table on Incremental Growth
Executive Summary - Chart on Company Market Positioning

2. Technavio Analysis

2.1 Analysis of price sensitivity, lifecycle, customer purchase basket, adoption rates, and purchase criteria

2.2 Criticality of inputs and Factors of differentiation

Chart on Overview on criticality of inputs and factors of differentiation

2.3 Factors of disruption

Chart on Overview on factors of disruption

2.4 Impact of drivers and challenges

Chart on Impact of drivers and challenges in 2025 and 2030

3. Market Landscape

3.1 Market ecosystem

Chart on Parent Market
Data Table on - Parent Market

3.2 Market characteristics

Chart on Market characteristics analysis

3.3 Value chain analysis

Chart on Value chain analysis

4. Market Sizing

4.1 Market definition

Data Table on Offerings of companies included in the market definition

4.2 Market segment analysis

Market segments

4.3 Market size 2025

4.4 Market outlook: Forecast for 2025-2030

Chart on Global - Market size and forecast 2025-2030 ($ thousand)
Data Table on Global - Market size and forecast 2025-2030 ($ thousand)
Chart on Global Market: Year-over-year growth 2025-2030 (%)
Data Table on Global Market: Year-over-year growth 2025-2030 (%)

5. Historic Market Size

5.1 Global Anesthesia Breathing Circuits Market 2020 - 2024

Historic Market Size - Data Table on Global Anesthesia Breathing Circuits Market 2020 - 2024 ($ thousand)

5.2 End-user segment analysis 2020 - 2024

Historic Market Size - End-user Segment 2020 - 2024 ($ thousand)

5.3 Product Type segment analysis 2020 - 2024

Historic Market Size - Product Type Segment 2020 - 2024 ($ thousand)

5.4 Usage segment analysis 2020 - 2024

Historic Market Size - Usage Segment 2020 - 2024 ($ thousand)

5.5 Geography segment analysis 2020 - 2024

Historic Market Size - Geography Segment 2020 - 2024 ($ thousand)

5.6 Country segment analysis 2020 - 2024

Historic Market Size - Country Segment 2020 - 2024 ($ thousand)

6. Qualitative Analysis

6.1 Impact of AI on Global Anesthesia Breathing Circuits Market

6.2 Impact of geopolitical conflicts on Global Anesthesia Breathing Circuits Market

7. Five Forces Analysis

7.1 Five forces summary

Five forces analysis - Comparison between 2025 and 2030

7.2 Bargaining power of buyers

Bargaining power of buyers - Impact of key factors 2025 and 2030

7.3 Bargaining power of suppliers

Bargaining power of suppliers - Impact of key factors in 2025 and 2030

7.4 Threat of new entrants

Threat of new entrants - Impact of key factors in 2025 and 2030

7.5 Threat of substitutes

Threat of substitutes - Impact of key factors in 2025 and 2030

7.6 Threat of rivalry

Threat of rivalry - Impact of key factors in 2025 and 2030

7.7 Market condition

Chart on Market condition - Five forces 2025 and 2030

8. Market Segmentation by End-user

8.1 Market segments

Chart on End-user - Market share 2025-2030 (%)
Data Table on End-user - Market share 2025-2030 (%)

8.2 Comparison by End-user

Chart on Comparison by End-user
Data Table on Comparison by End-user

8.3 Hospitals - Market size and forecast 2025-2030

Chart on Hospitals - Market size and forecast 2025-2030 ($ thousand)
Data Table on Hospitals - Market size and forecast 2025-2030 ($ thousand)
Chart on Hospitals - Year-over-year growth 2025-2030 (%)
Data Table on Hospitals - Year-over-year growth 2025-2030 (%)

8.4 Ambulatory surgical centers - Market size and forecast 2025-2030

Chart on Ambulatory surgical centers - Market size and forecast 2025-2030 ($ thousand)
Data Table on Ambulatory surgical centers - Market size and forecast 2025-2030 ($ thousand)
Chart on Ambulatory surgical centers - Year-over-year growth 2025-2030 (%)
Data Table on Ambulatory surgical centers - Year-over-year growth 2025-2030 (%)

8.5 Clinics - Market size and forecast 2025-2030

Chart on Clinics - Market size and forecast 2025-2030 ($ thousand)
Data Table on Clinics - Market size and forecast 2025-2030 ($ thousand)
Chart on Clinics - Year-over-year growth 2025-2030 (%)
Data Table on Clinics - Year-over-year growth 2025-2030 (%)

8.6 Market opportunity by End-user

Market opportunity by End-user ($ thousand)
Data Table on Market opportunity by End-user ($ thousand)

9. Market Segmentation by Product Type

9.1 Market segments

Chart on Product Type - Market share 2025-2030 (%)
Data Table on Product Type - Market share 2025-2030 (%)

9.2 Comparison by Product Type

Chart on Comparison by Product Type
Data Table on Comparison by Product Type

9.3 Closed circuits - Market size and forecast 2025-2030

Chart on Closed circuits - Market size and forecast 2025-2030 ($ thousand)
Data Table on Closed circuits - Market size and forecast 2025-2030 ($ thousand)
Chart on Closed circuits - Year-over-year growth 2025-2030 (%)
Data Table on Closed circuits - Year-over-year growth 2025-2030 (%)

9.4 Semi-closed circuits - Market size and forecast 2025-2030

Chart on Semi-closed circuits - Market size and forecast 2025-2030 ($ thousand)
Data Table on Semi-closed circuits - Market size and forecast 2025-2030 ($ thousand)
Chart on Semi-closed circuits - Year-over-year growth 2025-2030 (%)
Data Table on Semi-closed circuits - Year-over-year growth 2025-2030 (%)

9.5 Semi-open circuits - Market size and forecast 2025-2030

Chart on Semi-open circuits - Market size and forecast 2025-2030 ($ thousand)
Data Table on Semi-open circuits - Market size and forecast 2025-2030 ($ thousand)
Chart on Semi-open circuits - Year-over-year growth 2025-2030 (%)
Data Table on Semi-open circuits - Year-over-year growth 2025-2030 (%)

9.6 Open circuits - Market size and forecast 2025-2030

Chart on Open circuits - Market size and forecast 2025-2030 ($ thousand)
Data Table on Open circuits - Market size and forecast 2025-2030 ($ thousand)
Chart on Open circuits - Year-over-year growth 2025-2030 (%)
Data Table on Open circuits - Year-over-year growth 2025-2030 (%)

9.7 Market opportunity by Product Type

Market opportunity by Product Type ($ thousand)
Data Table on Market opportunity by Product Type ($ thousand)

10. Market Segmentation by Usage

10.1 Market segments

Chart on Usage - Market share 2025-2030 (%)
Data Table on Usage - Market share 2025-2030 (%)

10.2 Comparison by Usage

Chart on Comparison by Usage
Data Table on Comparison by Usage

10.3 Disposable circuits - Market size and forecast 2025-2030

Chart on Disposable circuits - Market size and forecast 2025-2030 ($ thousand)
Data Table on Disposable circuits - Market size and forecast 2025-2030 ($ thousand)
Chart on Disposable circuits - Year-over-year growth 2025-2030 (%)
Data Table on Disposable circuits - Year-over-year growth 2025-2030 (%)

10.4 Reusable circuits - Market size and forecast 2025-2030

Chart on Reusable circuits - Market size and forecast 2025-2030 ($ thousand)
Data Table on Reusable circuits - Market size and forecast 2025-2030 ($ thousand)
Chart on Reusable circuits - Year-over-year growth 2025-2030 (%)
Data Table on Reusable circuits - Year-over-year growth 2025-2030 (%)

10.5 Market opportunity by Usage

Market opportunity by Usage ($ thousand)
Data Table on Market opportunity by Usage ($ thousand)

11. Customer Landscape

11.1 Customer landscape overview

Analysis of price sensitivity, lifecycle, customer purchase basket, adoption rates, and purchase criteria

12. Geographic Landscape

12.1 Geographic segmentation

Chart on Market share by geography 2025-2030 (%)
Data Table on Market share by geography 2025-2030 (%)

12.2 Geographic comparison

Chart on Geographic comparison
Data Table on Geographic comparison

12.3 North America - Market size and forecast 2025-2030

Chart on North America - Market size and forecast 2025-2030 ($ thousand)
Data Table on North America - Market size and forecast 2025-2030 ($ thousand)
Chart on North America - Year-over-year growth 2025-2030 (%)
Data Table on North America - Year-over-year growth 2025-2030 (%)
Chart on Regional Comparison - North America
Data Table on Regional Comparison - North America

12.3.1 US - Market size and forecast 2025-2030

Chart on US - Market size and forecast 2025-2030 ($ thousand)
Data Table on US - Market size and forecast 2025-2030 ($ thousand)
Chart on US - Year-over-year growth 2025-2030 (%)
Data Table on US - Year-over-year growth 2025-2030 (%)

12.3.2 Canada - Market size and forecast 2025-2030

Chart on Canada - Market size and forecast 2025-2030 ($ thousand)
Data Table on Canada - Market size and forecast 2025-2030 ($ thousand)
Chart on Canada - Year-over-year growth 2025-2030 (%)
Data Table on Canada - Year-over-year growth 2025-2030 (%)

12.3.3 Mexico - Market size and forecast 2025-2030

Chart on Mexico - Market size and forecast 2025-2030 ($ thousand)
Data Table on Mexico - Market size and forecast 2025-2030 ($ thousand)
Chart on Mexico - Year-over-year growth 2025-2030 (%)
Data Table on Mexico - Year-over-year growth 2025-2030 (%)

12.4 Europe - Market size and forecast 2025-2030

Chart on Europe - Market size and forecast 2025-2030 ($ thousand)
Data Table on Europe - Market size and forecast 2025-2030 ($ thousand)
Chart on Europe - Year-over-year growth 2025-2030 (%)
Data Table on Europe - Year-over-year growth 2025-2030 (%)
Chart on Regional Comparison - Europe
Data Table on Regional Comparison - Europe

12.4.1 Germany - Market size and forecast 2025-2030

Chart on Germany - Market size and forecast 2025-2030 ($ thousand)
Data Table on Germany - Market size and forecast 2025-2030 ($ thousand)
Chart on Germany - Year-over-year growth 2025-2030 (%)
Data Table on Germany - Year-over-year growth 2025-2030 (%)

12.4.2 UK - Market size and forecast 2025-2030

Chart on UK - Market size and forecast 2025-2030 ($ thousand)
Data Table on UK - Market size and forecast 2025-2030 ($ thousand)
Chart on UK - Year-over-year growth 2025-2030 (%)
Data Table on UK - Year-over-year growth 2025-2030 (%)

12.4.3 France - Market size and forecast 2025-2030

Chart on France - Market size and forecast 2025-2030 ($ thousand)
Data Table on France - Market size and forecast 2025-2030 ($ thousand)
Chart on France - Year-over-year growth 2025-2030 (%)
Data Table on France - Year-over-year growth 2025-2030 (%)

12.4.4 Italy - Market size and forecast 2025-2030

Chart on Italy - Market size and forecast 2025-2030 ($ thousand)
Data Table on Italy - Market size and forecast 2025-2030 ($ thousand)
Chart on Italy - Year-over-year growth 2025-2030 (%)
Data Table on Italy - Year-over-year growth 2025-2030 (%)

12.4.5 Spain - Market size and forecast 2025-2030

Chart on Spain - Market size and forecast 2025-2030 ($ thousand)
Data Table on Spain - Market size and forecast 2025-2030 ($ thousand)
Chart on Spain - Year-over-year growth 2025-2030 (%)
Data Table on Spain - Year-over-year growth 2025-2030 (%)

12.4.6 The Netherlands - Market size and forecast 2025-2030

Chart on The Netherlands - Market size and forecast 2025-2030 ($ thousand)
Data Table on The Netherlands - Market size and forecast 2025-2030 ($ thousand)
Chart on The Netherlands - Year-over-year growth 2025-2030 (%)
Data Table on The Netherlands - Year-over-year growth 2025-2030 (%)

12.5 Asia - Market size and forecast 2025-2030

Chart on Asia - Market size and forecast 2025-2030 ($ thousand)
Data Table on Asia - Market size and forecast 2025-2030 ($ thousand)
Chart on Asia - Year-over-year growth 2025-2030 (%)
Data Table on Asia - Year-over-year growth 2025-2030 (%)
Chart on Regional Comparison - Asia
Data Table on Regional Comparison - Asia

12.5.1 China - Market size and forecast 2025-2030

Chart on China - Market size and forecast 2025-2030 ($ thousand)
Data Table on China - Market size and forecast 2025-2030 ($ thousand)
Chart on China - Year-over-year growth 2025-2030 (%)
Data Table on China - Year-over-year growth 2025-2030 (%)

12.5.2 India - Market size and forecast 2025-2030

Chart on India - Market size and forecast 2025-2030 ($ thousand)
Data Table on India - Market size and forecast 2025-2030 ($ thousand)
Chart on India - Year-over-year growth 2025-2030 (%)
Data Table on India - Year-over-year growth 2025-2030 (%)

12.5.3 Japan - Market size and forecast 2025-2030

Chart on Japan - Market size and forecast 2025-2030 ($ thousand)
Data Table on Japan - Market size and forecast 2025-2030 ($ thousand)
Chart on Japan - Year-over-year growth 2025-2030 (%)
Data Table on Japan - Year-over-year growth 2025-2030 (%)

12.5.4 South Korea - Market size and forecast 2025-2030

Chart on South Korea - Market size and forecast 2025-2030 ($ thousand)
Data Table on South Korea - Market size and forecast 2025-2030 ($ thousand)
Chart on South Korea - Year-over-year growth 2025-2030 (%)
Data Table on South Korea - Year-over-year growth 2025-2030 (%)

12.5.5 Indonesia - Market size and forecast 2025-2030

Chart on Indonesia - Market size and forecast 2025-2030 ($ thousand)
Data Table on Indonesia - Market size and forecast 2025-2030 ($ thousand)
Chart on Indonesia - Year-over-year growth 2025-2030 (%)
Data Table on Indonesia - Year-over-year growth 2025-2030 (%)

12.5.6 Thailand - Market size and forecast 2025-2030

Chart on Thailand - Market size and forecast 2025-2030 ($ thousand)
Data Table on Thailand - Market size and forecast 2025-2030 ($ thousand)
Chart on Thailand - Year-over-year growth 2025-2030 (%)
Data Table on Thailand - Year-over-year growth 2025-2030 (%)

12.6 Rest of World (ROW) - Market size and forecast 2025-2030

Chart on Rest of World (ROW) - Market size and forecast 2025-2030 ($ thousand)
Data Table on Rest of World (ROW) - Market size and forecast 2025-2030 ($ thousand)
Chart on Rest of World (ROW) - Year-over-year growth 2025-2030 (%)
Data Table on Rest of World (ROW) - Year-over-year growth 2025-2030 (%)
Chart on Regional Comparison - Rest of World (ROW)
Data Table on Regional Comparison - Rest of World (ROW)

12.6.1 Brazil - Market size and forecast 2025-2030

Chart on Brazil - Market size and forecast 2025-2030 ($ thousand)
Data Table on Brazil - Market size and forecast 2025-2030 ($ thousand)
Chart on Brazil - Year-over-year growth 2025-2030 (%)
Data Table on Brazil - Year-over-year growth 2025-2030 (%)

12.6.2 Saudi Arabia - Market size and forecast 2025-2030

Chart on Saudi Arabia - Market size and forecast 2025-2030 ($ thousand)
Data Table on Saudi Arabia - Market size and forecast 2025-2030 ($ thousand)
Chart on Saudi Arabia - Year-over-year growth 2025-2030 (%)
Data Table on Saudi Arabia - Year-over-year growth 2025-2030 (%)

12.6.3 UAE - Market size and forecast 2025-2030

Chart on UAE - Market size and forecast 2025-2030 ($ thousand)
Data Table on UAE - Market size and forecast 2025-2030 ($ thousand)
Chart on UAE - Year-over-year growth 2025-2030 (%)
Data Table on UAE - Year-over-year growth 2025-2030 (%)

12.6.4 Turkey - Market size and forecast 2025-2030

Chart on Turkey - Market size and forecast 2025-2030 ($ thousand)
Data Table on Turkey - Market size and forecast 2025-2030 ($ thousand)
Chart on Turkey - Year-over-year growth 2025-2030 (%)
Data Table on Turkey - Year-over-year growth 2025-2030 (%)

12.6.5 Argentina - Market size and forecast 2025-2030

Chart on Argentina - Market size and forecast 2025-2030 ($ thousand)
Data Table on Argentina - Market size and forecast 2025-2030 ($ thousand)
Chart on Argentina - Year-over-year growth 2025-2030 (%)
Data Table on Argentina - Year-over-year growth 2025-2030 (%)

12.6.6 South Africa - Market size and forecast 2025-2030

Chart on South Africa - Market size and forecast 2025-2030 ($ thousand)
Data Table on South Africa - Market size and forecast 2025-2030 ($ thousand)
Chart on South Africa - Year-over-year growth 2025-2030 (%)
Data Table on South Africa - Year-over-year growth 2025-2030 (%)

12.6.7 Colombia - Market size and forecast 2025-2030

Chart on Colombia - Market size and forecast 2025-2030 ($ thousand)
Data Table on Colombia - Market size and forecast 2025-2030 ($ thousand)
Chart on Colombia - Year-over-year growth 2025-2030 (%)
Data Table on Colombia - Year-over-year growth 2025-2030 (%)

12.6.8 Israel - Market size and forecast 2025-2030

Chart on Israel - Market size and forecast 2025-2030 ($ thousand)
Data Table on Israel - Market size and forecast 2025-2030 ($ thousand)
Chart on Israel - Year-over-year growth 2025-2030 (%)
Data Table on Israel - Year-over-year growth 2025-2030 (%)

12.7 Market opportunity by geography

Market opportunity by geography ($ thousand)
Data Tables on Market opportunity by geography ($ thousand)

13. Drivers, Challenges, and Opportunity

13.1 Market drivers

Rising volume of surgical procedures
Technological advancements in anesthesia equipment
Rising focus on infection control

13.2 Market challenges

High upfront research and manufacturing costs
Stringent environmental and waste regulations
Interoperability and standardization complexities

13.3 Impact of drivers and challenges

Impact of drivers and challenges in 2025 and 2030

13.4 Market opportunities

Technological advancements in heated systems
Antimicrobial integration and material science
Shift toward single-use disposable systems

14. Competitive Landscape

14.1 Overview

14.2

Overview on criticality of inputs and factors of differentiation

14.3 Landscape disruption

Overview on factors of disruption

14.4 Industry risks

Impact of key risks on business

15. Competitive Analysis

15.1 Companies profiled

Companies covered

15.2 Company ranking index

15.3 Market positioning of companies

Matrix on companies position and classification

15.4 Ambu AS

Ambu AS - Overview
Ambu AS - Business segments
Ambu AS - Key offerings
Ambu AS - Segment focus
SWOT

15.5 Dragerwerk AG and Co. KGaA

Dragerwerk AG and Co. KGaA - Overview
Dragerwerk AG and Co. KGaA - Business segments
Dragerwerk AG and Co. KGaA - Key offerings
Dragerwerk AG and Co. KGaA - Segment focus
SWOT

15.6 Eakin Healthcare Group

Eakin Healthcare Group - Overview
Eakin Healthcare Group - Product / Service
Eakin Healthcare Group - Key offerings
SWOT

15.7 Fisher and Paykel Healthcare

Fisher and Paykel Healthcare - Overview
Fisher and Paykel Healthcare - Product / Service
Fisher and Paykel Healthcare - Key offerings
SWOT

15.8 GaleMed Corp.

GaleMed Corp. - Overview
GaleMed Corp. - Product / Service
GaleMed Corp. - Key offerings
SWOT

15.9 GE HealthCare Technologies

GE HealthCare Technologies - Overview
GE HealthCare Technologies - Business segments
GE HealthCare Technologies - Key news
GE HealthCare Technologies - Key offerings
GE HealthCare Technologies - Segment focus
SWOT

15.10 GVS S.p.A.

GVS S.p.A. - Overview
GVS S.p.A. - Product / Service
GVS S.p.A. - Key offerings
SWOT

15.11 Hamilton Medical AG

Hamilton Medical AG - Overview
Hamilton Medical AG - Product / Service
Hamilton Medical AG - Key offerings
SWOT

15.12 ICU Medical Inc.

ICU Medical Inc. - Overview
ICU Medical Inc. - Product / Service
ICU Medical Inc. - Key offerings
SWOT

15.13 Intersurgical Ltd.

Intersurgical Ltd. - Overview
Intersurgical Ltd. - Product / Service
Intersurgical Ltd. - Key offerings
SWOT

15.14 Medtronic Plc

Medtronic Plc - Overview
Medtronic Plc - Business segments
Medtronic Plc - Key news
Medtronic Plc - Key offerings
Medtronic Plc - Segment focus
SWOT

15.15 Shenzhen Mindray Co. Ltd.

Shenzhen Mindray Co. Ltd. - Overview
Shenzhen Mindray Co. Ltd. - Business segments
Shenzhen Mindray Co. Ltd. - Key offerings
Shenzhen Mindray Co. Ltd. - Segment focus
SWOT

15.16 Teleflex Inc.

Teleflex Inc. - Overview
Teleflex Inc. - Business segments
Teleflex Inc. - Key news
Teleflex Inc. - Key offerings
Teleflex Inc. - Segment focus
SWOT

15.17 Vyaire Medical Inc.

Vyaire Medical Inc. - Overview
Vyaire Medical Inc. - Product / Service
Vyaire Medical Inc. - Key offerings
SWOT

15.18 Well Lead Medical Co. Ltd.

Well Lead Medical Co. Ltd. - Overview
Well Lead Medical Co. Ltd. - Product / Service
Well Lead Medical Co. Ltd. - Key offerings
SWOT

16. Appendix

16.1 Scope of the report

Market definition
Objectives
Notes and caveats

16.2 Inclusions and exclusions checklist

Inclusions checklist
Exclusions checklist

16.3 Currency conversion rates for US$

16.4 Research methodology

16.5 Data procurement

Information sources

16.6 Data validation

16.7 Validation techniques employed for market sizing

16.8 Data synthesis

16.9 360 degree market analysis

16.10 List of abbreviations

Research Methodology

Technavio presents a detailed picture of the market by way of study, synthesis, and summation of data from multiple sources. The analysts have presented the various facets of the market with a particular focus on identifying the key industry influencers. The data thus presented is comprehensive, reliable, and the result of extensive research, both primary and secondary.

INFORMATION SOURCES

Primary sources

  • Manufacturers and suppliers
  • Channel partners
  • Industry experts
  • Strategic decision makers

Secondary sources

  • Industry journals and periodicals
  • Government data
  • Financial reports of key industry players
  • Historical data
  • Press releases

DATA ANALYSIS

Data Synthesis

  • Collation of data
  • Estimation of key figures
  • Analysis of derived insights

Data Validation

  • Triangulation with data models
  • Reference against proprietary databases
  • Corroboration with industry experts

REPORT WRITING

Qualitative

  • Market drivers
  • Market challenges
  • Market trends
  • Five forces analysis

Quantitative

  • Market size and forecast
  • Market segmentation
  • Geographical insights
  • Competitive landscape

Interested in this report?

Get your sample now to see our research methodology and insights!

Download Now

Frequently Asked Questions

Anesthesia Breathing Circuits market growth will increase by USD 496551.1 thousand thousand during 2026-2030.

The Anesthesia Breathing Circuits market is expected to grow at a CAGR of 7.9% during 2026-2030.

Anesthesia Breathing Circuits market is segmented by End-user (Hospitals, Ambulatory surgical centers, Clinics) Product type (Closed circuits, Semi-closed circuits, Semi-open circuits, Open circuits) Usage (Disposable circuits, Reusable circuits)

Ambu AS, Dragerwerk AG and Co. KGaA, Eakin Healthcare Group, Fisher and Paykel Healthcare, Flexicare Group Ltd., GaleMed Corp., GE HealthCare Technologies, GVS S.p.A., Hamilton Medical AG, HSINER Co. Ltd., ICU Medical Inc., Intersurgical Ltd., Medtronic Plc, P3 Medical Ltd, Penlon Ltd., Shenzhen Mindray Co. Ltd., Teleflex Inc., Vyaire Medical Inc., Well Lead Medical Co. Ltd. are a few of the key vendors in the Anesthesia Breathing Circuits market.

Asia will register the highest growth rate of 36.5% among the other regions. Therefore, the Anesthesia Breathing Circuits market in Asia is expected to garner significant business opportunities for the vendors during the forecast period.

US, Canada, Mexico, Germany, UK, France, Italy, Spain, The Netherlands, China, India, Japan, South Korea, Indonesia, Thailand, Brazil, Saudi Arabia, UAE, Turkey, Argentina, South Africa, Colombia, Israel

  • Rising volume of surgical procedures is the driving factor this market.

The Anesthesia Breathing Circuits market vendors should focus on grabbing business opportunities from the End-user segment as it accounted for the largest market share in the base year.
RIA - Research AI Assistant
Ask RIA
