Anesthesia Laryngeal Masks Market Size 2025-2029
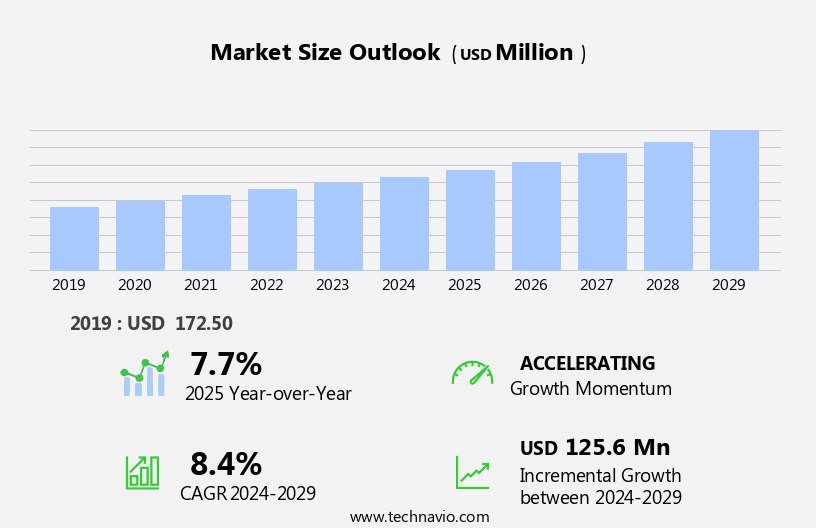
The anesthesia laryngeal masks market size is forecast to increase by USD 125.6 million, at a CAGR of 8.4% between 2024 and 2029.
- The market is experiencing significant growth due to the increasing number of surgeries and emergency cases that require the use of these masks. The market is driven by the rising demand for minimally invasive surgical procedures and the preference for laryngeal masks over endotracheal tubes in such cases. The importance of maintaining patient safety and comfort during surgical procedures is leading healthcare professionals to prefer these masks, especially for fasting patients. Furthermore, advancements in materials, design, and customization of laryngeal masks are fueling market growth. However, intense competition among market players is leading to price reductions, which may put pressure on profit margins.
- Reusable medical devices, such as reusable LMAs, offer cost savings but require rigorous cleaning and maintenance procedures to ensure safety. Companies must focus on innovation and differentiation to maintain their market position. Additionally, regulatory requirements and safety concerns pose challenges to market growth, requiring strict adherence to quality standards and continuous improvement efforts. To capitalize on market opportunities and navigate challenges effectively, companies should invest in research and development, collaborate with healthcare institutions, and prioritize patient safety and comfort.
What will be the Size of the Anesthesia Laryngeal Masks Market during the forecast period?
- The market is witnessing significant growth, driven by the increasing demand for safer and more effective anesthesia equipment in surgical procedures. Anesthesia equipment, a subset of surgical equipment, plays a crucial role in ensuring patient safety and optimal anesthesia outcomes during intubation. Healthcare workers in ambulatory surgical centers and hospitals frequently use reusable laryngeal masks for airway interventions, including nitrous oxide anesthesia. Difficult intubation and airway obstruction are common challenges faced in emergency medical services and intensive care units, leading to increased focus on rapid sequence intonation and neuromuscular blockade. In the critical care setting, hemodynamic stability and cardiovascular instability are critical concerns during anesthesia administration. Anesthesia mortality remains a significant issue, emphasizing the importance of medical innovation and clinical practice guidelines in the medical device industry.
- Pain management and patient comfort are also essential considerations, driving the adoption of regional anesthesia and awake intubation techniques. The medical device market for anesthesia equipment is expanding, with a focus on improving patient safety and perioperative management. Anesthesia complications, such as respiratory failure, are a major concern, necessitating the development of advanced technologies for monitoring and addressing hemodynamic instability. Medical device regulation plays a crucial role in ensuring the safety and efficacy of anesthesia equipment, ensuring that healthcare providers have access to reliable and effective tools for managing anesthesia during surgical procedures.
How is this Anesthesia Laryngeal Masks Industry segmented?
The anesthesia laryngeal masks industry research report provides comprehensive data (region-wise segment analysis), with forecasts and estimates in "USD million" for the period 2025-2029, as well as historical data from 2019-2023 for the following segments.
- Product
- Single-use
- Reusable
- End-user
- Hospitals and clinics
- Ambulatory surgical centers
- Material
- Silicone
- Polyvinyl chloride
- Latex
- Others
- Geography
- North America
- US
- Canada
- Mexico
- Europe
- France
- Germany
- Italy
- UK
- APAC
- China
- India
- Japan
- Rest of World (ROW)
- North America
By Product Insights
The single-use segment is estimated to witness significant growth during the forecast period. The single-use laryngeal mask is a sterile, disposable respiratory device that seals the larynx for safe respiration without intubation of the trachea. Additionally, laryngeal masks maintain a consistent intracuff pressure during nitrous oxide anesthesia, enhancing segment growth. Made from materials like silicone, polypropylene, and polycarbonate, these masks are soft, inflatable, and less invasive than endotracheal tubes (ETTs). Single-use laryngeal masks offer several advantages, including rapid airway access, reduced irritation to the airway, and elimination of the risk of infection and cross-contamination associated with reusable devices. The market for these masks is growing due to their cost-effectiveness, ease of use, and effectiveness in managing difficult airways. Anesthesia suppliers provide a range of laryngeal mask products, from standard sizes to design advancements, to cater to various surgical procedures and patient needs.
Laryngeal mask manufacturers prioritize biocompatibility, sterilization, and quality control to ensure patient safety and efficacy. Innovations in material science and manufacturing processes continue to drive product development, with clinical trials and industry standards guiding best practices. The competitive landscape is characterized by intellectual property protection, regulatory compliance, and marketing strategies to differentiate offerings. Laryngeal mask airways are available in various sizes and designs, with single-use devices being the preferred choice due to their convenience and reduced risk of complications. Despite their advantages, proper handling, insertion technique, and patient selection are crucial for successful use. In airway management, laryngeal masks play a significant role in minimally invasive procedures and anesthesia, offering a cost-effective alternative to intubation. The market's environmental impact is a growing concern, with efforts being made to reduce waste and promote sustainability in the production and disposal of these devices. The future of laryngeal mask technology lies in advancements in design, biocompatibility, and patient comfort, ensuring safe and effective airway management for various surgical procedures.
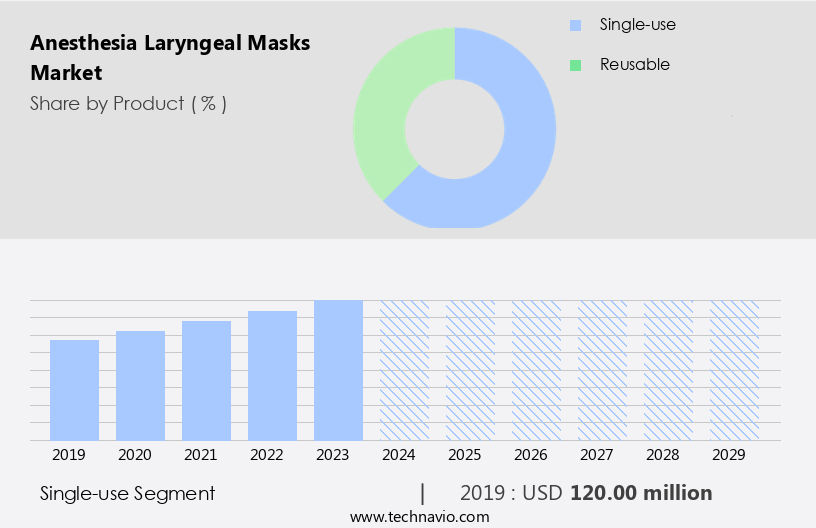
The Single-use segment was valued at USD 120.00 million in 2019 and showed a gradual increase during the forecast period.
Regional Analysis
North America is estimated to contribute 32% to the growth of the global market during the forecast period. Technavio's analysts have elaborately explained the regional trends and drivers that shape the market during the forecast period.
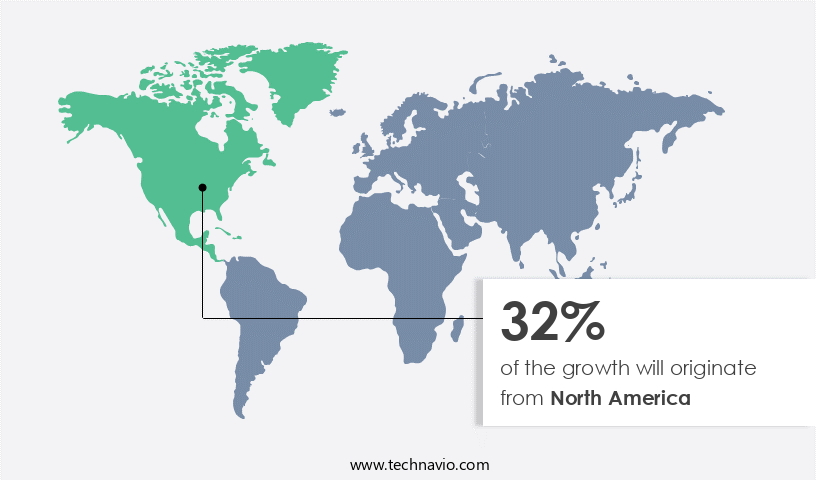
The market in North America is experiencing significant growth due to several factors. The increasing prevalence of chronic diseases, leading to a higher demand for surgical procedures, is a major driver. According to the Centers for Disease Control and Prevention (CDC), over 60% of adults in the US have a chronic disease, and 40% have more than one. These conditions necessitate surgical interventions, thereby increasing the demand for anesthesia laryngeal masks for airway management. Advancements in technology and healthcare infrastructure are also contributing to market growth. Anesthesia supplies companies are focusing on product development, introducing new designs, materials, and manufacturing processes to enhance patient safety, efficacy, and comfort.
Intellectual property protection through patents is a crucial aspect of market competition, with companies investing in research and development to innovate and differentiate their offerings. Anesthesia laryngeal masks come in various forms, including disposable and reusable devices, catering to diverse clinical needs and budgets. Multi-use devices offer cost-effectiveness, while single-use devices ensure biocompatibility and elimination of cross-contamination risks. Standardization and guidelines are essential to ensure consistent quality and patient safety, with industry bodies and regulatory authorities setting stringent requirements. Marketing strategies and distribution networks play a significant role in reaching healthcare providers and end-users. Companies focus on training and education to increase physician preference and patient satisfaction.
Laryngeal mask airway devices are used in various surgical procedures, making them an essential component of medical devices. The competitive landscape is characterized by prominent players, each offering unique value propositions and product differentiation strategies. Risk management is a critical consideration, with companies focusing on handling, insertion, removal, and patient selection to minimize complications. Laryngeal mask airway devices have a high success rate, making them a preferred choice for airway management in various clinical settings. The market's environmental impact and cost-effectiveness are essential factors, with companies focusing on sustainable practices and reducing waste.
Market Dynamics
Our researchers analyzed the data with 2024 as the base year, along with the key drivers, trends, and challenges. A holistic analysis of drivers will help companies refine their marketing strategies to gain a competitive advantage.
What are the Anesthesia Laryngeal Masks market drivers leading to the rise in the adoption of Industry?
- The increase in the number of surgeries and emergency cases serves as the primary growth catalyst for the market. Anesthesia LMAs (Laryngeal Mask Airways) play a crucial role in ensuring patient comfort and safety during surgical procedures. The global market for LMAs is driven by the increasing number of surgical procedures due to the rising prevalence of chronic and lifestyle diseases. According to estimates, approximately 313 million surgical procedures are performed annually worldwide. Factors such as advancements in LMA design and material science, adherence to LMA guidelines, and effective marketing strategies contribute to the growth of this market. Manufacturers focus on developing single-use devices to ensure biocompatibility and maintain sterility. Stringent regulations ensure the safety and efficacy of LMAs.
- Proper patient selection, labeling, and training are essential to optimize the clinical outcomes of LMA usage. LMA distribution networks are expanding to cater to the increasing demand for anesthesia devices. Manufacturing processes are becoming more efficient, emphasizing collaboration between technology and human expertise. Clinical trials and research continue to focus on improving LMA biocompatibility and enhancing patient safety. Market dynamics, including material science advancements, regulatory compliance, and marketing strategies, are shaping the future of this market.
What are the Anesthesia Laryngeal Masks market trends shaping the Industry?
- The use of advanced materials, innovative designs, and customizable features is currently shaping the market trend for laryngeal masks. This progression in technology aims to enhance patient comfort and effectiveness during intubation procedures. Anesthesia laryngeal masks have become a significant focus in the healthcare industry due to their effectiveness and versatility. Companies are investing in research and development to innovate these masks with advanced technologies, designs, and materials. LMA sizes and styles vary, catering to diverse patient needs and preferences. For instance, Teleflex's LMA Gastro Airway with Cuff Pilot Technology offers increased comfort and efficiency, featuring a gastric channel for upper endoscopy procedures. Its patented Cuff Pilot technology enables physicians to confirm proper cuff inflation and monitor pressure levels, enhancing safety and efficacy. Quality control and sterilization are crucial aspects of the LMA market.
- Companies employ rigorous quality control measures and utilize various sterilization methods to ensure product safety and effectiveness. Lma materials are carefully selected to ensure durability, flexibility, and biocompatibility. The LMA industry adheres to stringent standards and regulations to maintain safety and efficacy. Lma sales channels include direct sales, distributors, and e-commerce platforms. The LMA supply chain is streamlined to ensure timely delivery and inventory management. Despite their benefits, LMAs have potential complications, such as airway obstruction, aspiration, and esophageal injury. However, advancements in design and technology aim to mitigate these risks. The LMA market is continuously evolving, with a focus on cost-effectiveness, environmental impact, and patient safety. Companies are exploring sustainable materials and manufacturing processes to minimize their carbon footprint.
How does Anesthesia Laryngeal Masks market face challenges during its growth?
- The intense competition among companies, characterized by significant price reductions, poses a significant challenge to the industry's growth trajectory. The market is experiencing intense competition among manufacturers, leading to significant price reductions and slim profit margins. With numerous players, both established and new, vying for market share, price wars are becoming commonplace. This aggressive pricing strategy, while beneficial for end-users and healthcare providers in the short term, puts immense pressure on companies to maintain profitability while ensuring product quality and innovation. The commoditization of laryngeal masks, coupled with the availability of low-cost alternatives from emerging markets, further intensifies the competition. LMA product development continues, with a focus on sustainability, best practices, and standardization. Disposable LMAs, which account for a significant portion of the market, are being replaced by reusable devices in some settings to reduce waste and costs.
- LMA packaging is also being redesigned to improve storage and transportation. Patents continue to play a crucial role in product differentiation and intellectual property protection. Anesthesia suppliers are exploring various strategies to add value to their offerings, including training and education programs for healthcare professionals and integrated solutions that combine LMAs with other anesthesia supplies. The LMA value proposition remains strong, with its ease of use, effectiveness, and safety making it a preferred choice for anesthesia providers worldwide. Despite the challenges, the market for laryngeal mask airways is expected to continue growing, driven by increasing surgical procedures and the ongoing need for safe and effective anesthesia delivery.
Exclusive Customer Landscape
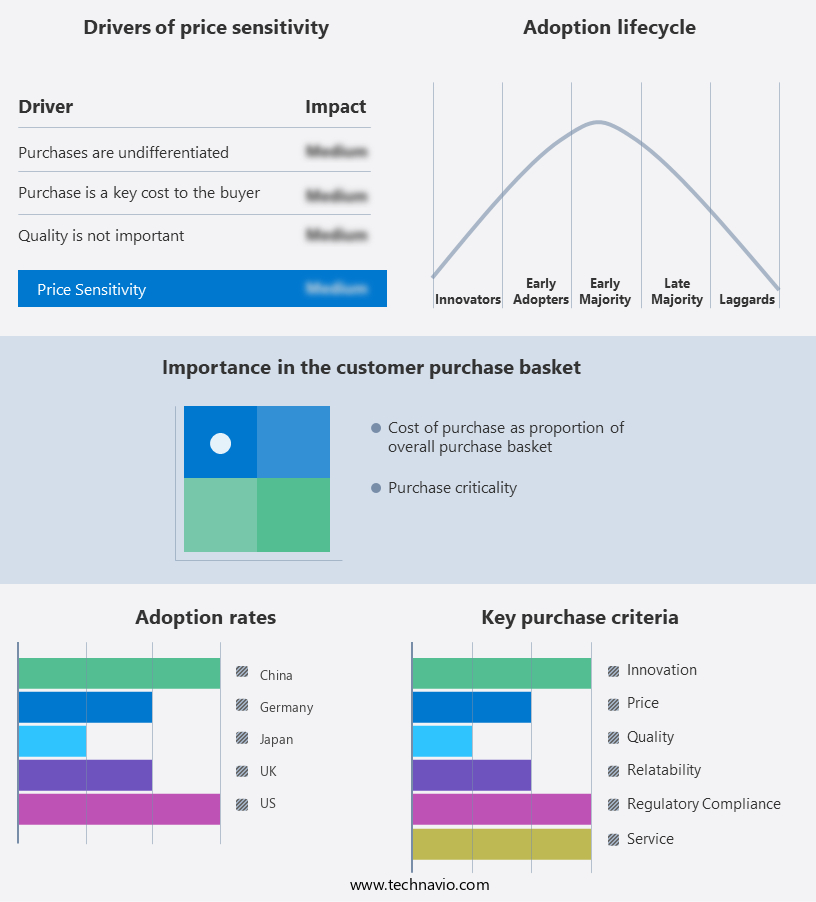
The anesthesia laryngeal masks market forecasting report includes the adoption lifecycle of the market, covering from the innovator's stage to the laggard's stage. It focuses on adoption rates in different regions based on penetration. Furthermore, the anesthesia laryngeal masks market report also includes key purchase criteria and drivers of price sensitivity to help companies evaluate and develop their market growth analysis strategies.
Customer Landscape
Key Companies & Market Insights
Companies are implementing various strategies, such as strategic alliances, anesthesia laryngeal masks market forecast, partnerships, mergers and acquisitions, geographical expansion, and product/service launches, to enhance their presence in the industry.
Ambu AS - The company specializes in supplying advanced anesthesia laryngeal masks, including the disposable AuraGain model.
The industry research and growth report includes detailed analyses of the competitive landscape of the market and information about key companies, including:
- Ambu AS
- Anandic Medical Systems AG
- Besmed Health Business Corp.
- Cardinal Health Inc.
- Dynarex Corp.
- Flexicare Group Ltd.
- HiTech Medical Co. Ltd.
- HSINER Co. Ltd.
- Intersurgical Ltd.
- Marshall Airway Products Ltd.
- McKesson Corp.
- Medtronic Plc
- Narang Medical Ltd.
- Sharn Inc.
- Sterimed Medical Devices Pvt. Ltd.
- SunMed
- Teleflex Inc.
- Vogt Medical Vertrieb GmbH
Qualitative and quantitative analysis of companies has been conducted to help clients understand the wider business environment as well as the strengths and weaknesses of key industry players. Data is qualitatively analyzed to categorize companies as pure play, category-focused, industry-focused, and diversified; it is quantitatively analyzed to categorize companies as dominant, leading, strong, tentative, and weak.
Recent Development and News in Anesthesia Laryngeal Masks Market
- In February 2023, Teleflex Incorporated, a leading global provider of medical technologies, announced the FDA approval of its new laryngeal mask, the LMA Supreme 3 Supreme, featuring an improved design for enhanced patient comfort and safety (Teleflex Press Release, 2023). This approval marks a significant advancement in the market, as it addresses the growing demand for more effective and patient-friendly solutions.
- In June 2024, Smiths Medical, a global leader in medical devices, entered into a strategic partnership with Merck KGaA, Darmstadt, Germany, to co-develop and commercialize a new generation of laryngeal mask systems (Smiths Medical Press Release, 2024). This collaboration is expected to bring innovative products to the market, strengthening both companies' positions and expanding their offerings in the market.
- In October 2024, Medtronic plc, a leading healthcare solutions company, completed the acquisition of Intersurgical, a global manufacturer of anesthesia equipment and laryngeal masks (Medtronic Press Release, 2024). This acquisition significantly bolstered Medtronic's presence in the anesthesia market and provided them with a broader product portfolio, including a range of laryngeal masks.
- In January 2025, the European Commission approved the marketing authorization for the LMA Flexible Suction Laryngoscope, a new product from LMA North America, Inc. (LMA North America Press Release, 2025). This approval marks a significant technological advancement in the market, as the new device combines the functions of a laryngoscope and a laryngeal mask, potentially streamlining the intubation process and improving patient safety.
Research Analyst Overview
The anesthesia laryngeal mask market continues to evolve, driven by ongoing research, industry standards, and technological advancements. LMAs, or laryngeal mask airways, are essential components of airway management during surgical procedures. These devices come in various forms, including disposable and reusable options, each with unique benefits and challenges. LMA design and technology are continually advancing, leading to improvements in patient comfort, safety, and efficacy. LMA industry standards and guidelines ensure consistent quality and safety, while research and clinical trials drive innovation and differentiation. The market size and growth are influenced by factors such as patient selection, availability, and physician preference.
The Anesthesia Laryngeal Masks Market is experiencing significant growth due to advancements in supraglottic airway device technology, improving patient outcomes in difficult airway scenarios. The rising demand for disposable devices ensures hygiene and efficiency. Innovations in LMA insertion technique and LMA removal enhance procedural safety, reducing LMA complications. A high LMA success rate depends on proper LMA patient selection and comprehensive LMA training. Industry focus on LMA safety, LMA efficacy, and affordability drives adoption, influencing LMA cost and LMA availability globally. Expansion in LMA market size, boosted by LMA market growth and LMA market trends, fosters LMA innovation. Regulatory efforts promote LMA regulation, LMA standardization, and LMA quality control, while ongoing LMA research and LMA clinical trials refine LMA best practices. Increasing LMA patient satisfaction and LMA physician preference shape the LMA competitive landscape, driving LMA differentiation and LMA marketing strategies. Advances in LMA technology, LMA manufacturing processes, and LMA material science improve design, while LMA sterilization, LMA labeling, LMA storage, and LMA disposal impact usability. Growing concerns over LMA environmental impact fuel discussions on LMA sustainability, ensuring a balance between innovation and responsibility.
LMA sales channels and distribution networks are expanding, making these devices more accessible to healthcare providers worldwide. Sustainability and environmental impact are becoming increasingly important considerations in the LMA market. LMA manufacturers are exploring new materials, sterilization methods, and manufacturing processes to reduce waste and improve biocompatibility. LMA cost-effectiveness and risk management are crucial factors in the competitive landscape. Supraglottic airway devices, including LMAs, are subject to rigorous regulation to ensure safety and efficacy. LMA handling, insertion, removal, and patient satisfaction are key areas of focus for best practices and training. LMA design advancements and safety features are continually being developed to address complications and improve overall patient outcomes. In the dynamic and evolving world of anesthesia supplies and medical devices, LMAs remain a vital and innovative solution for airway management during surgical procedures.
Dive into Technavio's strong research methodology, blending expert interviews, extensive data synthesis, and validated models for unparalleled Anesthesia Laryngeal Masks Market insights. See full methodology.
|
Market Scope |
|
|
Report Coverage |
Details |
|
Page number |
217 |
|
Base year |
2024 |
|
Historic period |
2019-2023 |
|
Forecast period |
2025-2029 |
|
Growth momentum & CAGR |
Accelerate at a CAGR of 8.4% |
|
Market growth 2025-2029 |
USD 125.6 million |
|
Market structure |
Fragmented |
|
YoY growth 2024-2025(%) |
7.7 |
|
Key countries |
US, Canada, Germany, UK, France, China, Italy, Japan, Mexico, and India |
|
Competitive landscape |
Leading Companies, Market Positioning of Companies, Competitive Strategies, and Industry Risks |
What are the Key Data Covered in this Anesthesia Laryngeal Masks Market Research and Growth Report?
- CAGR of the Anesthesia Laryngeal Masks industry during the forecast period
- Detailed information on factors that will drive the growth and forecasting between 2025 and 2029
- Precise estimation of the size of the market and its contribution of the industry in focus to the parent market
- Accurate predictions about upcoming growth and trends and changes in consumer behaviour
- Growth of the market across North America, Europe, Asia, and Rest of World (ROW)
- Thorough analysis of the market's competitive landscape and detailed information about companies
- Comprehensive analysis of factors that will challenge the anesthesia laryngeal masks market growth of industry companies
We can help! Our analysts can customize this anesthesia laryngeal masks market research report to meet your requirements.
 RIA -
RIA - 
