Angiography Devices Market Size 2025-2029
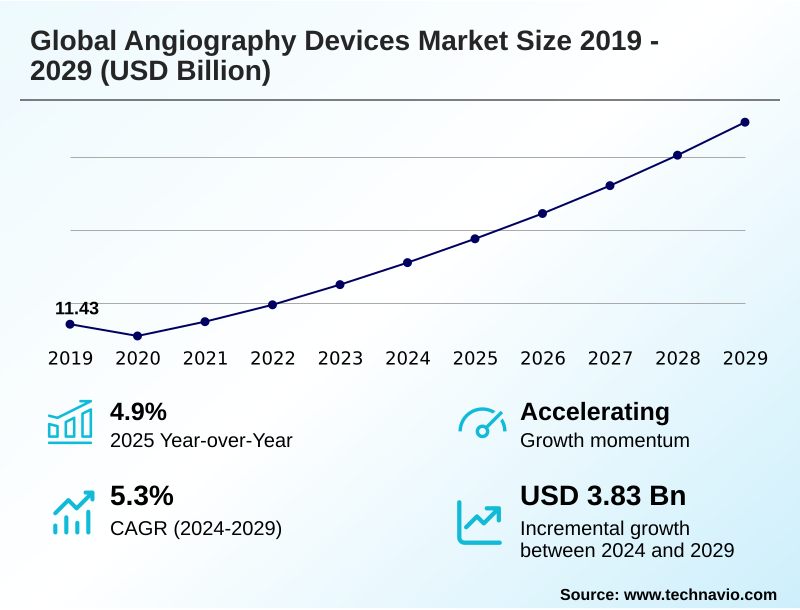
The angiography devices market size is valued to increase by USD 3.83 billion, at a CAGR of 5.3% from 2024 to 2029. Progress in medical imaging technologies will drive the angiography devices market.
Major Market Trends & Insights
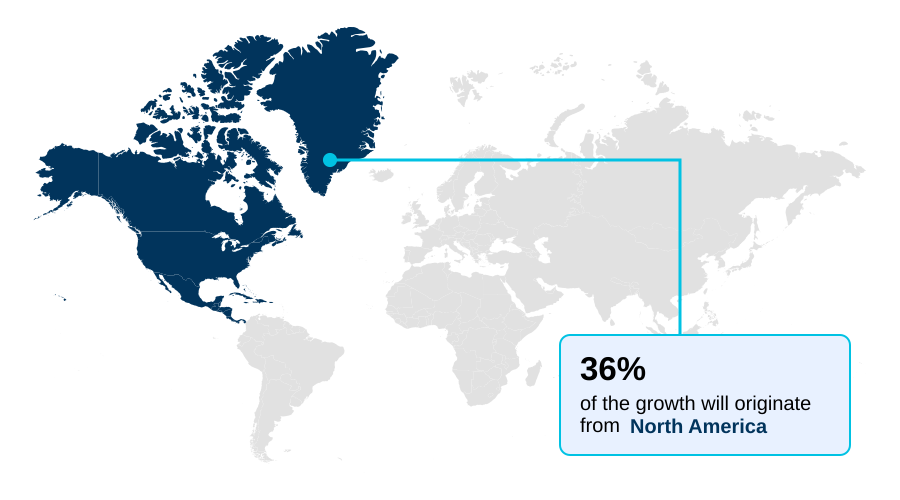
- North America dominated the market and accounted for a 36.5% growth during the forecast period.
- By Application - Diagnostic segment was valued at USD 8.67 billion in 2023
- By End-user - Hospitals and clinics segment accounted for the largest market revenue share in 2023
Market Size & Forecast
- Market Opportunities: USD 5.51 billion
- Market Future Opportunities: USD 3.83 billion
- CAGR from 2024 to 2029 : 5.3%
Market Summary
- The angiography devices market is shaped by the imperative to address the rising incidence of cardiovascular conditions through technological innovation. Progress in medical imaging, particularly in areas like image-guided therapy and digital subtraction angiography, serves as a primary driver, enabling more precise and less invasive interventions.
- A key trend involves the integration of advanced software and AI-powered image analysis to enhance diagnostic accuracy and optimize procedural workflows. For instance, a healthcare system evaluating capital investment in a new cardiac catheterization lab must weigh the benefits of systems with advanced image processing algorithms and radiation dose reduction features against their total cost of ownership.
- This decision is critical for improving both patient outcomes in coronary angiography and operational efficiency. However, the high expense of cutting-edge fluoroscopy systems and the need for specialized training create significant challenges, limiting adoption in facilities with constrained budgets.
- The development of more accessible and cost-effective catheter-based procedures remains a central focus for expanding market reach and ensuring broader patient access to critical treatments like neurovascular intervention and peripheral artery disease treatment.
What will be the Size of the Angiography Devices Market during the forecast period?
Get Key Insights on Market Forecast (PDF) Get Free Sample
How is the Angiography Devices Market Segmented?
The angiography devices industry research report provides comprehensive data (region-wise segment analysis), with forecasts and estimates in "USD million" for the period 2025-2029, as well as historical data from 2019-2023 for the following segments.
- Application
- Diagnostic
- Therapeutic
- End-user
- Hospitals and clinics
- Diagnostic and ambulatory surgery centers
- Research laboratories and institutes
- Technology
- MRI
- CT
- X-ray
- Others
- Geography
- North America
- US
- Canada
- Mexico
- Europe
- Germany
- UK
- France
- Asia
- Rest of World (ROW)
- North America
By Application Insights
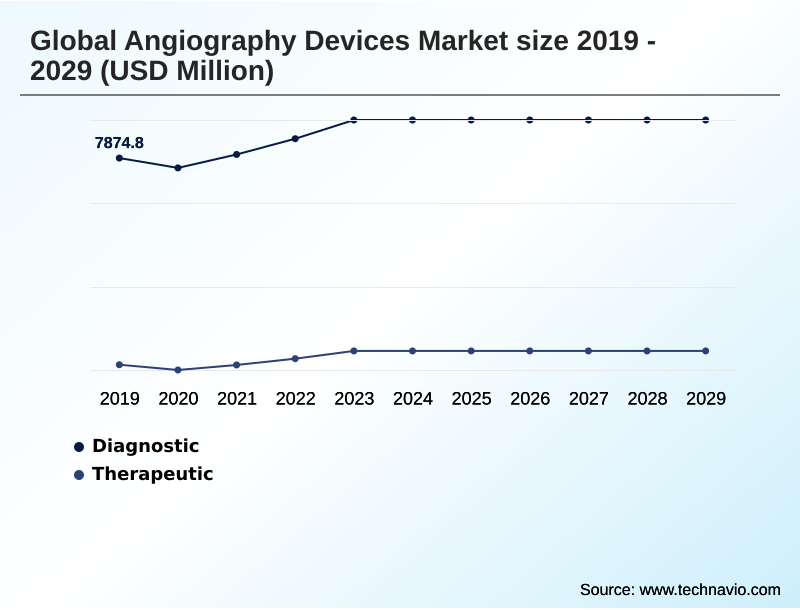
The diagnostic segment is estimated to witness significant growth during the forecast period.
The diagnostic segment is fundamental to the angiography devices market, driven by the need for precise visualization in cardiovascular and neurovascular medicine.
This segment, covering everything from advanced x-ray imaging systems to diagnostic catheters and guidewire technology, is evolving with a shift towards non-invasive imaging techniques.
Innovations in computed tomography angiography and magnetic resonance angiography are enhancing patient safety and procedural workflow optimization.
The integration of AI-powered image analysis is a key factor, with new software demonstrating the ability to improve the efficiency of image interpretation by up to 80% compared to manual analysis.
This progress in the cardiac catheterization lab and interventional radiology settings allows for more effective treatment planning for conditions like in-stent restenosis, supported by advanced roadmapping software and real-time 3D imaging.
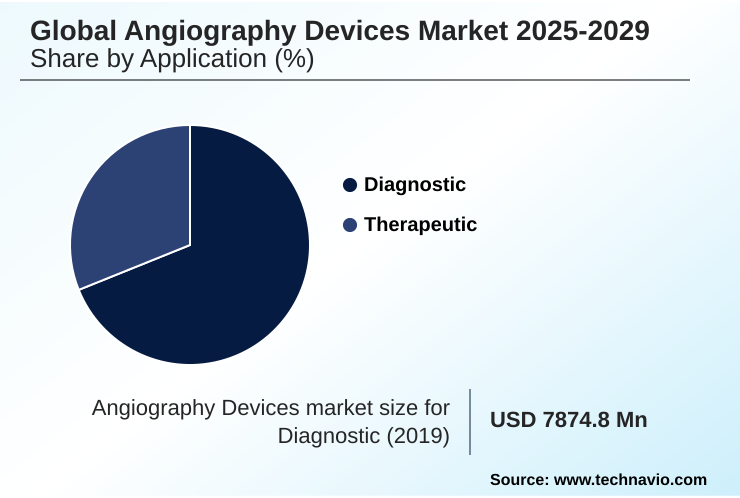
The Diagnostic segment was valued at USD 8.67 billion in 2023 and showed a gradual increase during the forecast period.
Regional Analysis
North America is estimated to contribute 36.5% to the growth of the global market during the forecast period.Technavio’s analysts have elaborately explained the regional trends and drivers that shape the market during the forecast period.
See How Angiography Devices Market Demand is Rising in North America Get Free Sample
The geographic landscape of the market is characterized by varied regional dynamics and adoption rates.
North America accounts for the largest share of incremental growth at 36.5%, driven by its advanced healthcare infrastructure and high investment in interventional radiology and dedicated cardiac catheterization lab facilities.
Asia is also a significant region, fueled by expanding healthcare access and a growing focus on managing cardiovascular diseases.
A notable operational trend across mature markets is the shift of certain catheter-based procedures to outpatient centers to improve cost-efficiency, which can increase facility throughput by over 15%.
This shift influences demand for specific types of C-arm systems and supports the growing need for effective peripheral artery disease treatment and structural heart interventions, while also emphasizing the importance of hemostasis management post-procedure.
Market Dynamics
Our researchers analyzed the data with 2024 as the base year, along with the key drivers, trends, and challenges. A holistic analysis of drivers will help companies refine their marketing strategies to gain a competitive advantage.
- The evolution of the angiography devices market is defined by a relentless pursuit of improved diagnostic accuracy and therapeutic efficacy. Key advancements in CT angiography technology are enhancing visualization, while the benefits of magnetic resonance angiography, particularly its lack of ionizing radiation, make it indispensable for certain patient populations.
- However, significant challenges in neurovascular intervention devices persist, pushing for more refined solutions. The applications of AI in cardiac imaging are transformative, enabling automated analysis and predictive insights. This complements the ongoing comparison of drug-eluting stents and bioabsorbable scaffolds for coronary disease, where the role of IVUS in coronary procedures remains critical for optimal placement and outcomes.
- Innovations in guidewire and catheter design are central to procedural success, with new models reducing procedure times by up to 20% compared to previous generations. The market is also seeing expanded therapeutic applications of angiography devices in areas like minimally invasive structural heart repair and endovascular treatment of aortic aneurysms.
- The diagnostic accuracy of FFR and QFR continues to guide revascularization decisions. Concurrently, trends in robotic-assisted catheterization are improving precision, while improving image quality in fluoroscopy and ensuring radiation safety in interventional radiology are paramount.
- Atherectomy devices for peripheral artery disease, thrombus removal techniques in stroke, and robust digital subtraction angiography protocols are refining treatment standards, alongside a focus on optimizing workflow in cath labs and establishing clear vascular closure device selection criteria.
What are the key market drivers leading to the rise in the adoption of Angiography Devices Industry?
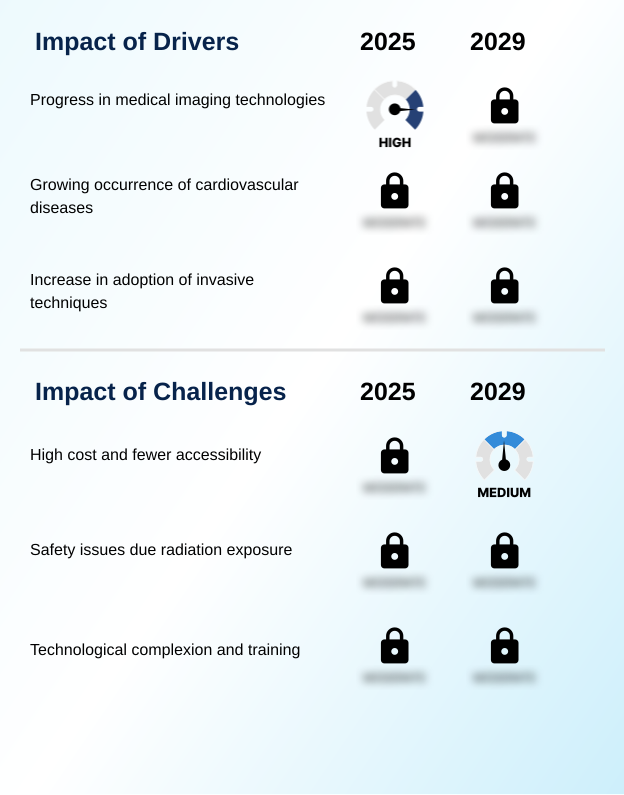
- Continuous progress in medical imaging technologies serves as a key driver for the angiography devices market.
- Technological progress in imaging hardware and interventional devices is a primary market driver. The latest generation of flat-panel detectors has enhanced image resolution by over 40%, enabling clearer visualization during digital subtraction angiography and other image-guided therapy procedures.
- This improvement in image quality is critical for the accuracy of both diagnostic assessments and therapeutic interventions.
- In parallel, innovations in guidewire technology and interventional catheters have expanded the feasibility of treating complex lesions, improving procedural success rates by up to 15% in challenging cases of peripheral artery disease treatment.
- These advancements are pivotal across interventional radiology and cardiology, facilitating safer and more effective treatments through enhanced tools like fluoroscopy systems, C-arm systems, and specialized balloon catheters.
What are the market trends shaping the Angiography Devices Industry?
- A prominent market trend is the concerted effort to minimize radiation exposure for both patients and healthcare providers. This is driving manufacturers to develop systems with lower dose capabilities without compromising image quality.
- Key market trends are centered on integrating intelligent technologies to enhance procedural efficacy and safety. The adoption of robotic-assisted angiography is gaining traction, promising greater precision in complex interventions like cerebral aneurysm coiling and left atrial appendage closure. Concurrently, the use of AI-powered image analysis is revolutionizing diagnostics, with platforms demonstrating an 80% improvement in analytical speed over manual methods.
- This technology, combined with advanced dose modulation techniques, also contributes to safer procedures, with some protocols achieving a radiation reduction of over 50%. The development of hybrid operating rooms supports these trends by creating flexible environments for procedures ranging from transcatheter aortic valve replacement to oncology embolization.
- These advancements in interventional neuroradiology and pediatric cardiology interventions underscore a definitive shift toward more sophisticated, data-driven, and minimally invasive approaches, supported by advanced image fusion technology.
What challenges does the Angiography Devices Industry face during its growth?
- The high cost of angiography equipment and its limited accessibility in resource-constrained settings present a key challenge to market growth.
- The high total cost of ownership and requisite specialized training represent significant market challenges. The initial capital outlay for advanced equipment, such as a state-of-the-art C-arm system or hybrid operating room, can consume upwards of 60% of a department's annual equipment budget, restricting access for many institutions.
- Furthermore, the technological complexion of modern devices necessitates intensive training, which can increase staff onboarding costs by 25% for complex procedures like endovascular repair or structural heart interventions. These financial and operational hurdles are particularly acute in resource-poor settings, limiting the adoption of critical technologies like bioabsorbable scaffolds and advanced atherectomy devices.
- Overcoming these barriers is essential for broadening the availability of life-saving catheter-based procedures and advanced hemodynamic monitoring.
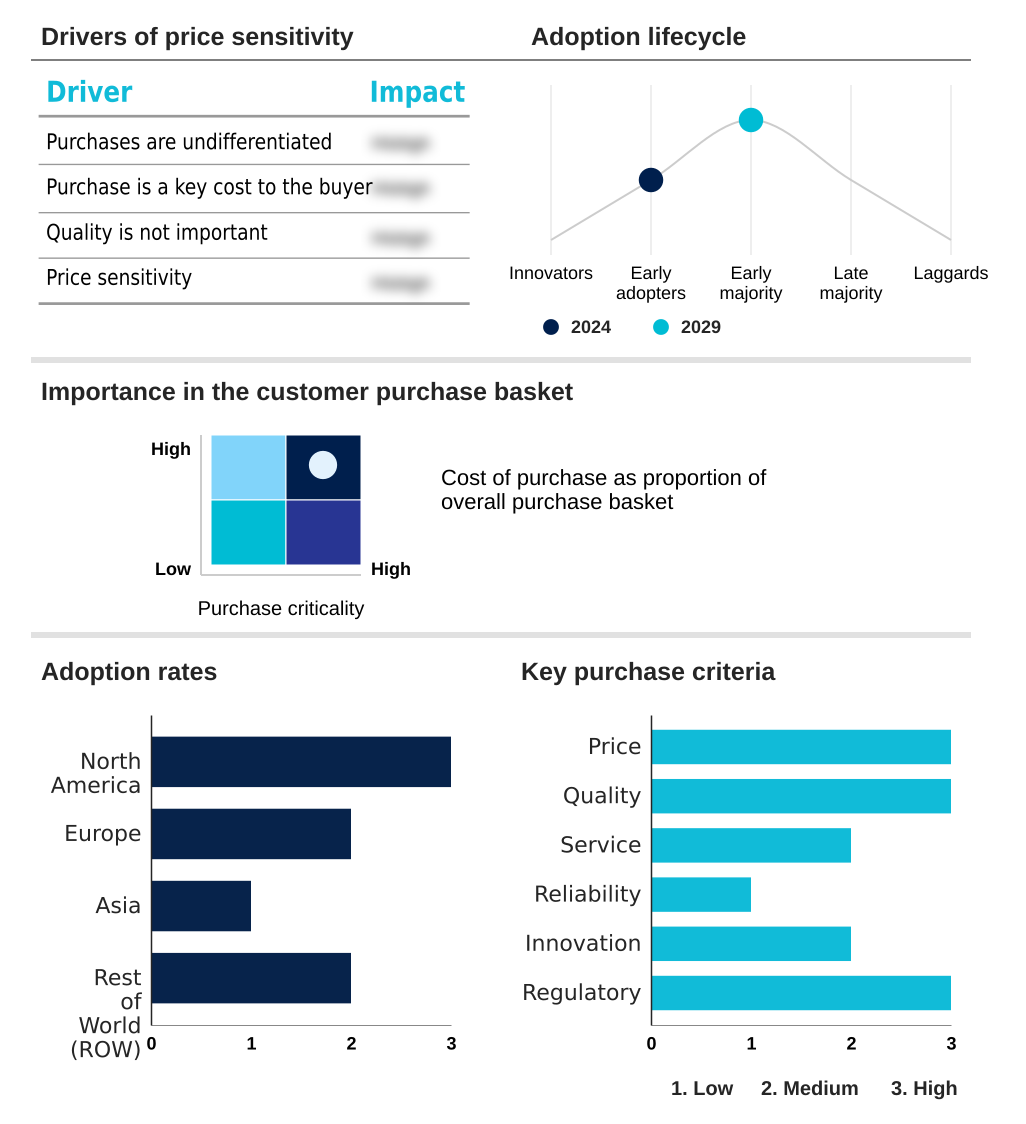
Exclusive Technavio Analysis on Customer Landscape
The angiography devices market forecasting report includes the adoption lifecycle of the market, covering from the innovator’s stage to the laggard’s stage. It focuses on adoption rates in different regions based on penetration. Furthermore, the angiography devices market report also includes key purchase criteria and drivers of price sensitivity to help companies evaluate and develop their market growth analysis strategies.
Customer Landscape of Angiography Devices Industry
Competitive Landscape
Companies are implementing various strategies, such as strategic alliances, angiography devices market forecast, partnerships, mergers and acquisitions, geographical expansion, and product/service launches, to enhance their presence in the industry.
Abbott Laboratories - A specialized portfolio of advanced guidewire technology and hemodynamic monitoring systems enhances procedural precision for complex cardiovascular interventions and diagnostic assessments.
The industry research and growth report includes detailed analyses of the competitive landscape of the market and information about key companies, including:
- Abbott Laboratories
- AbbVie Inc.
- AngioDynamics Inc.
- B.Braun SE
- Boston Scientific Corp.
- Canon Inc.
- Cardinal Health Inc.
- Cook Group Inc.
- Cordis Corp.
- General Electric Co.
- Inorbvict Healthcare India Pvt Ltd.
- Johnson and Johnson Services
- Koninklijke Philips NV
- Medtronic Plc
- Shimadzu Corp.
- Siemens AG
- Terumo Corp.
- Toshiba Corp.
Qualitative and quantitative analysis of companies has been conducted to help clients understand the wider business environment as well as the strengths and weaknesses of key industry players. Data is qualitatively analyzed to categorize companies as pure play, category-focused, industry-focused, and diversified; it is quantitatively analyzed to categorize companies as dominant, leading, strong, tentative, and weak.
Recent Development and News in Angiography devices market
- In September 2024, AngioDynamics received CE Mark approval for its Auryon atherectomy system, a laser-based technology designed for treating peripheral artery disease.
- In October 2024, Philips launched its next-generation Azurion neuro biplane system, featuring enhanced 2D and 3D imaging capabilities to support complex neurovascular procedures.
- In January 2025, Viz.ai announced strategic partnerships with leading pharmaceutical firms to integrate its AI-powered care coordination platform, including 3D CT angiography visualization, into clinical trial workflows.
- In March 2025, GE HealthCare launched its Revolution Vibe, a next-generation cardiac CT scanner integrating advanced AI capabilities for coronary CT angiography and structural heart examinations.
Dive into Technavio’s robust research methodology, blending expert interviews, extensive data synthesis, and validated models for unparalleled Angiography Devices Market insights. See full methodology.
| Market Scope | |
|---|---|
| Page number | 297 |
| Base year | 2024 |
| Historic period | 2019-2023 |
| Forecast period | 2025-2029 |
| Growth momentum & CAGR | Accelerate at a CAGR of 5.3% |
| Market growth 2025-2029 | USD 3825.2 million |
| Market structure | Fragmented |
| YoY growth 2024-2025(%) | 4.9% |
| Key countries | US, Canada, Mexico, Germany, UK, France, Italy, The Netherlands, Spain, China, Japan, India, South Korea, Indonesia, Australia, Brazil, Saudi Arabia, UAE, South Africa, Colombia, Argentina, Israel and Turkey |
| Competitive landscape | Leading Companies, Market Positioning of Companies, Competitive Strategies, and Industry Risks |
Research Analyst Overview
- The angiography devices market is defined by a sophisticated interplay of diagnostic and therapeutic technologies. Core modalities like x-ray imaging systems, computed tomography angiography, and magnetic resonance angiography provide the foundation for a vast range of catheter-based procedures.
- Applications in coronary angiography, peripheral artery disease treatment, and neurovascular intervention are continuously refined through innovations in guidewire technology, diagnostic catheters, and interventional catheters. The evolution of devices such as balloon catheters, drug-eluting stents, bioabsorbable scaffolds, and atherectomy devices is central to improving clinical outcomes.
- In the boardroom, a key strategic decision involves capital allocation for next-generation systems, weighing the benefits of integrated hybrid operating rooms against traditional cardiac catheterization lab upgrades. This is influenced by the rise of minimally invasive structural heart interventions and the need for advanced image-guided therapy.
- The integration of superior image processing algorithms has a direct business impact, achieving up to a 30% reduction in diagnostic review time. Specialized equipment, including thrombus management systems, embolic protection devices, vascular closure devices, fluoroscopy systems, and C-arm systems with flat-panel detectors, is essential for both interventional radiology and advancing endovascular repair, all while prioritizing radiation dose reduction and hemodynamic monitoring.
What are the Key Data Covered in this Angiography Devices Market Research and Growth Report?
-
What is the expected growth of the Angiography Devices Market between 2025 and 2029?
-
USD 3.83 billion, at a CAGR of 5.3%
-
-
What segmentation does the market report cover?
-
The report is segmented by Application (Diagnostic, and Therapeutic), End-user (Hospitals and clinics, Diagnostic and ambulatory surgery centers, and Research laboratories and institutes), Technology (MRI, CT, X-ray, and Others) and Geography (North America, Europe, Asia, Rest of World (ROW))
-
-
Which regions are analyzed in the report?
-
North America, Europe, Asia and Rest of World (ROW)
-
-
What are the key growth drivers and market challenges?
-
Progress in medical imaging technologies, High cost and fewer accessibility
-
-
Who are the major players in the Angiography Devices Market?
-
Abbott Laboratories, AbbVie Inc., AngioDynamics Inc., B.Braun SE, Boston Scientific Corp., Canon Inc., Cardinal Health Inc., Cook Group Inc., Cordis Corp., General Electric Co., Inorbvict Healthcare India Pvt Ltd., Johnson and Johnson Services, Koninklijke Philips NV, Medtronic Plc, Shimadzu Corp., Siemens AG, Terumo Corp. and Toshiba Corp.
-
Market Research Insights
- The market is advancing through the adoption of technologies that yield significant operational and clinical returns. The integration of AI-powered image analysis into routine workflows has been shown to improve diagnostic efficiency by up to 80% compared to conventional methods.
- Similarly, the implementation of advanced dose modulation techniques in modern systems is critical for patient safety, reducing procedural radiation exposure by as much as 75% without compromising image quality. This focus on efficiency and safety is driving investment in hybrid operating rooms equipped for complex procedures.
- The exploration of robotic-assisted angiography further promises to enhance precision while improving ergonomics for clinicians. These dynamics underscore a strategic shift toward data-driven, minimally invasive interventions that deliver superior value.
We can help! Our analysts can customize this angiography devices market research report to meet your requirements.
 RIA -
RIA - 
