APAC Re-refined Base Oils Market Analysis, Size, and Forecast 2026-2030: APAC (China, India, and Japan)

APAC Re-refined Base Oils Market Analysis, Size, and Forecast 2026-2030:
APAC (China, India, and Japan)

Published: Jan 2026 227 Pages SKU: IRTNTR81246

Market Overview at a Glance

$1.48 B
Market Opportunity
9.1%
CAGR 2025 - 2030
8.4%
YoY growth 2025-2026(%)
$1.20 B
Group II segment 2024

APAC Re-refined Base Oils Market Size 2026-2030

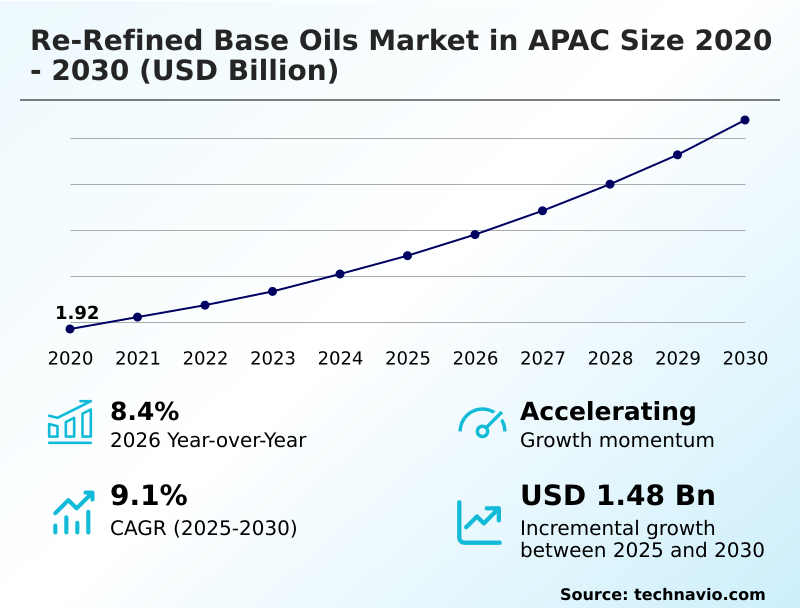
The apac re-refined base oils market size is valued to increase by USD 1.48 billion, at a CAGR of 9.1% from 2025 to 2030. Stringent regulatory frameworks and carbon neutrality mandates will drive the apac re-refined base oils market.

Major Market Trends & Insights

  • By Type - Group II segment was valued at USD 1.20 billion in 2024
  • By Application - Engine oil segment accounted for the largest market revenue share in 2024

Market Size & Forecast

  • Market Opportunities: USD 2.28 billion
  • Market Future Opportunities: USD 1.48 billion
  • CAGR from 2025 to 2030 : 9.1%

Market Summary

  • The re-refined base oils market in APAC is expanding, driven by the convergence of stringent environmental regulations and the pursuit of economic efficiency. Governments are implementing policies centered on circular economy principles and extended producer responsibility, compelling industries to manage the entire lubricant lifecycle. This creates a sustained demand for high-quality recycled base stocks.
  • Technologically, the sector has evolved from simple distillation to advanced methods like the hydro-treating process and thin-film evaporation, producing group II and group III base oils that are chemically equivalent to virgin counterparts. However, challenges persist, including fragmented waste oil collection infrastructure and deep-seated consumer skepticism about product quality.
  • For instance, a multinational manufacturing firm can optimize its supply chain by partnering with certified re-refiners. This not only ensures a stable supply of high-performance lubricants, insulating the company from crude oil price volatility, but also significantly lowers its Scope 3 emissions, aligning operational goals with corporate sustainability mandates and enhancing brand reputation in an increasingly eco-conscious market.
  • This strategic shift demonstrates the dual financial and environmental benefits of integrating re-refined products.

What will be the Size of the APAC Re-refined Base Oils Market during the forecast period?

Get Key Insights on Market Forecast (PDF) Request Free Sample

How is the APAC Re-refined Base Oils Market Segmented?

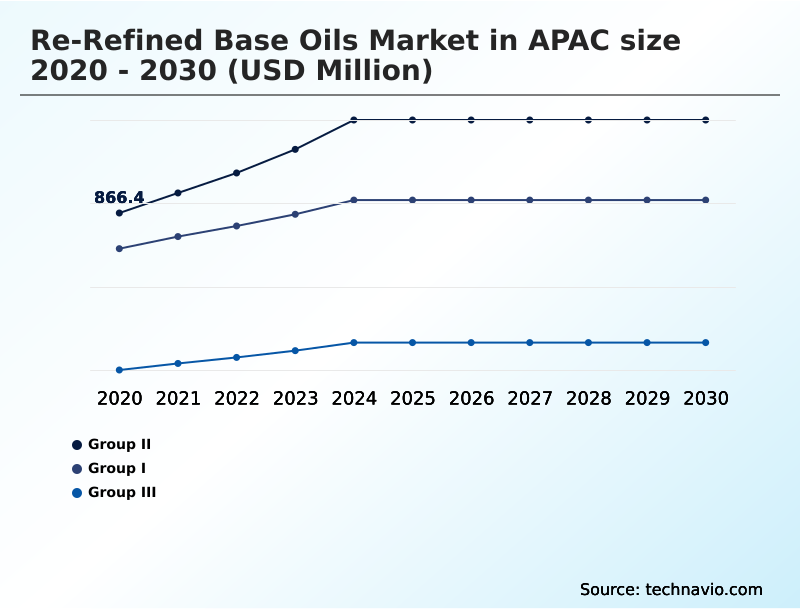
The apac re-refined base oils industry research report provides comprehensive data (region-wise segment analysis), with forecasts and estimates in "USD million" for the period 2026-2030, as well as historical data from 2020-2024 for the following segments.

  • Type
    • Group II
    • Group I
    • Group III
  • Application
    • Engine oil
    • Industrial oil
    • Transmission oil
    • Gear oil
    • Others
  • Technology
    • Clay treatment
    • Hydrotreating process
    • Vacuum distillation
    • Solvent extraction
    • Others
  • Geography
    • APAC
      • China
      • India
      • Japan

By Type Insights

The group ii segment is estimated to witness significant growth during the forecast period.

Group II re-refined base oils are setting the standard for modern automotive re-refined lubricants and industrial applications in the APAC market.

These oils undergo intensive processing, including hydrotreating, for significant oxidative stability enhancement, achieving the low sulfur content and purity required by today's stringent emission standards. This quality is verified through rigorous base oil performance testing.

The push towards Group II is driven by demand for longer drain intervals, making these oils a cornerstone for sustainable lubricant solutions.

Their chemical consistency ensures seamless additive package compatibility and thermal degradation resistance, allowing re-refining technology providers to deliver products that perform identically to virgin stock in any lubricant blending process, thereby building trust with end-users and OEMs.

Request Free Sample

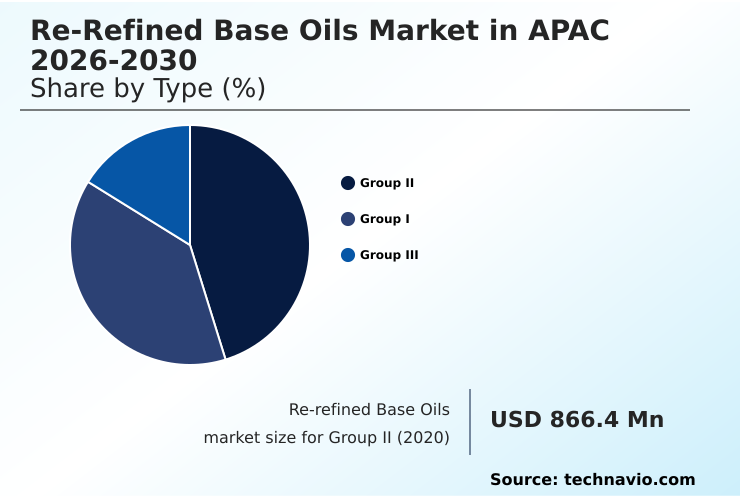
The Group II segment was valued at USD 1.20 billion in 2024 and showed a gradual increase during the forecast period.

Request Free Sample

Market Dynamics

Our researchers analyzed the data with 2025 as the base year, along with the key drivers, trends, and challenges. A holistic analysis of drivers will help companies refine their marketing strategies to gain a competitive advantage.

  • Strategic decision-making in the lubricants sector increasingly involves a detailed assessment of the group ii vs group iii re-refined performance, where advancements in thin-film evaporation technology are closing the gap. A thorough cost-benefit analysis of hydrotreating process reveals its long-term value in achieving OEM specifications with re-refined oil, despite the significant capital investment for re-refining facilities.
  • The impact of feedstock quality on base oil is a critical operational variable, addressed through the implementation of digital tracking systems for used oil, which helps formalize previously fragmented feedstock networks. These systems provide the data needed to manage the integration of re-refined oil for synthetic engine blends.
  • Navigating the complex regulatory frameworks for used oil collection is essential for ensuring compliance with extended producer responsibility. The industry is actively working on overcoming consumer skepticism in the automotive sector through transparent performance data, demonstrating the high performance of re-refined hydraulic fluids and re-refined base oil for industrial gear applications.
  • For corporations, the primary benefit is lowering scope 3 emissions with recycled lubricants, which directly contributes to sustainability targets by reducing reliance on crude oil imports.
  • The economic viability of re-refining plants is strengthened by the role of solvent extraction in purification and ongoing research into enhancing oxidative stability in re-refined oils, making the integration of re-refined oils in manufacturing a financially and environmentally sound strategy. This integration can improve supply chain predictability by over 25% compared to sourcing from volatile global crude markets.

What are the key market drivers leading to the rise in the adoption of APAC Re-refined Base Oils Industry?

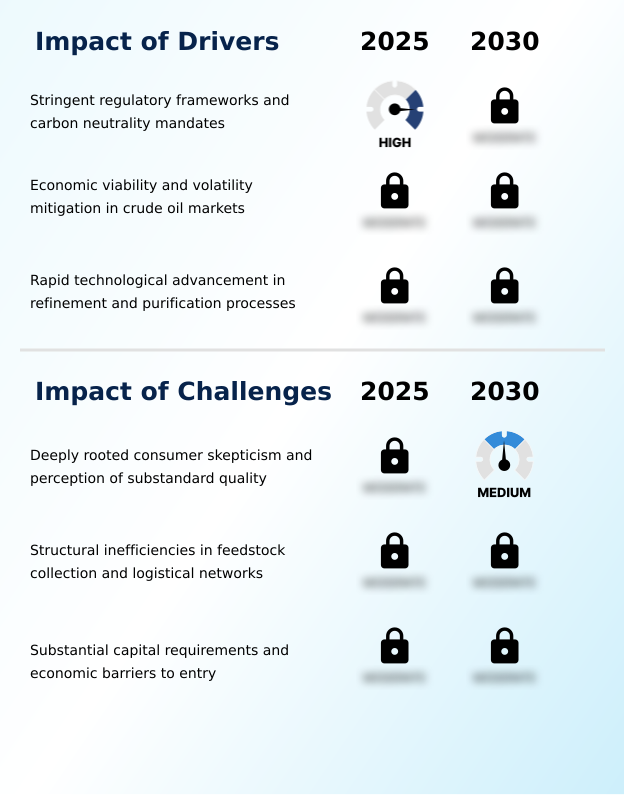
  • Stringent regulatory frameworks and mandates for carbon neutrality are key drivers propelling the expansion of the re-refined base oils market.

  • Economic viability and technological advancements are key drivers. The volatility of crude oil prices, which can shift by over 30% in a single year, makes the stable cost of used motor oil feedstock highly attractive.
  • Innovations in thin-film evaporation and other refining methods are enabling the production of oils with a high viscosity index and exceptional base stock purity, verified by comprehensive base oil quality certification. This allows for broader applications in industrial oil recycling.
  • A cohesive feedstock procurement strategy is critical for managing hazardous waste logistics and ensuring a consistent supply for large-scale waste-to-resource projects.
  • Effective lubricant lifecycle management not only creates economic value but also strengthens regional energy security by domesticating raw material production.

What are the market trends shaping the APAC Re-refined Base Oils Industry?

  • The implementation of circular economy frameworks represents a primary market trend. This shift is driven by the dual necessity of reducing the environmental footprint of hazardous waste and decreasing national dependence on imported crude oil.

  • A primary market trend is the proliferation of high-quality group III base oil, enabled by advanced catalytic hydro-finishing and sophisticated waste lubricant oil processing. This technological leap allows producers to meet stringent environmental compliance standards, effectively removing contaminants like polycyclic aromatic hydrocarbon compounds.
  • The adoption of circular supply chain models is reinforced by strengthening waste oil management policy across the region, creating guaranteed demand for products with a lower environmental impact. This shift supports a 15% improvement in lubricant carbon footprint reduction for certain formulations.
  • Corporates are increasingly implementing closed-loop lubrication systems and prioritizing green lubricant formulation to align with sustainability goals, making high-purity re-refined oils a strategic asset.

What challenges does the APAC Re-refined Base Oils Industry face during its growth?

  • Deeply rooted consumer skepticism and the perception of substandard quality present a key challenge affecting industry growth and broader market acceptance.

  • Significant challenges stem from structural inefficiencies and high capital barriers. Fragmented collection networks impede the consistent local sourcing of base oils, making detailed used oil analysis crucial for ensuring feedstock quality before it reaches expensive refining plant equipment. The process requires meticulous feedstock contamination removal, including heavy metal removal, often utilizing technologies like vacuum distillation and solvent extraction refining.
  • However, the high re-refinery operational costs and substantial initial investment, often exceeding that of traditional blending plants by over 50%, create a formidable barrier to entry. This financial pressure, coupled with competition from large-scale virgin oil producers, complicates profitability and deters investment in the sector, slowing the overall transition.

Exclusive Technavio Analysis on Customer Landscape

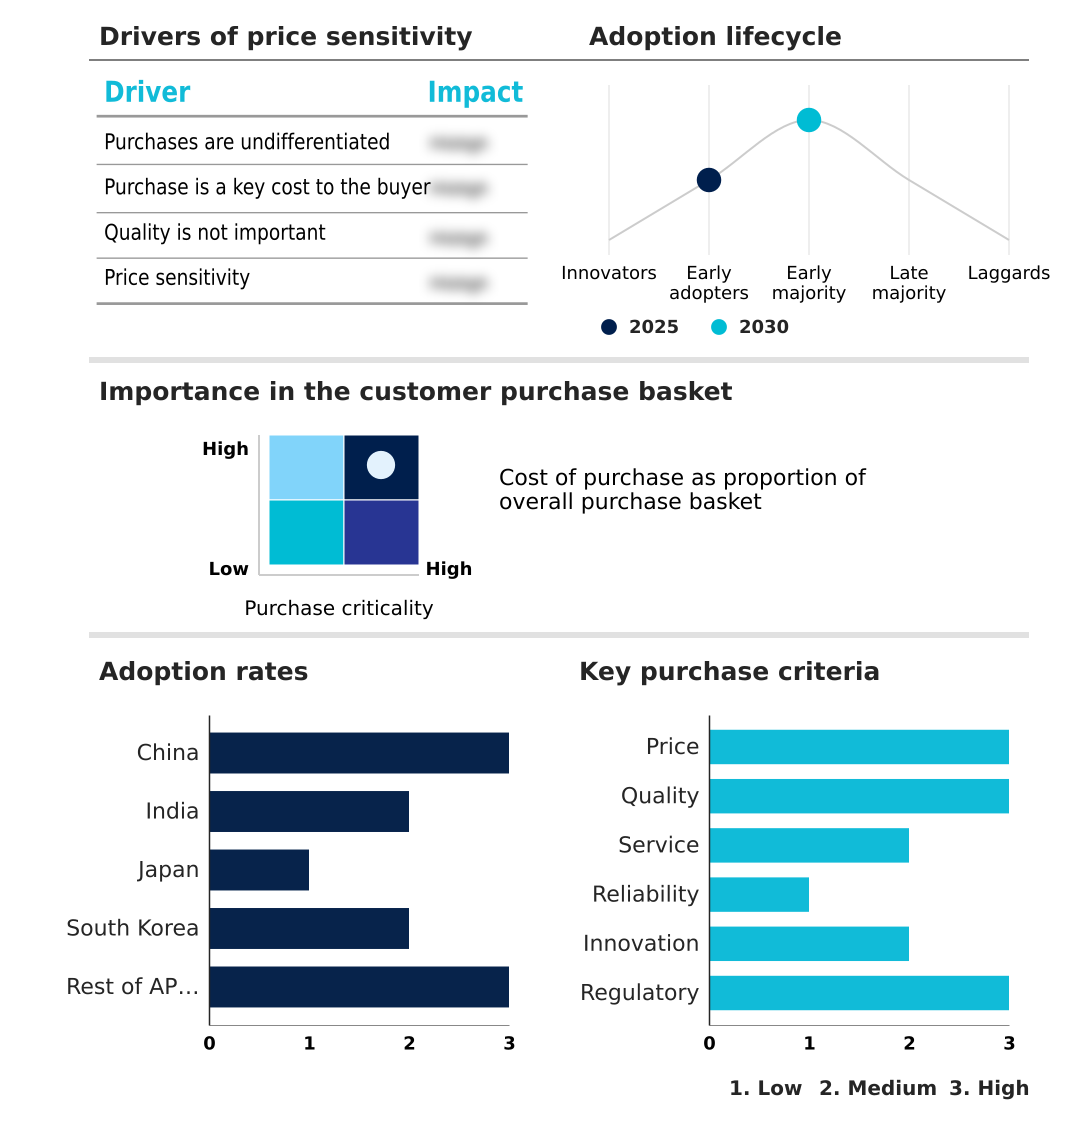
The apac re-refined base oils market forecasting report includes the adoption lifecycle of the market, covering from the innovator’s stage to the laggard’s stage. It focuses on adoption rates in different regions based on penetration. Furthermore, the apac re-refined base oils market report also includes key purchase criteria and drivers of price sensitivity to help companies evaluate and develop their market growth analysis strategies.

Customer Landscape of APAC Re-refined Base Oils Industry

Competitive Landscape

Companies are implementing various strategies, such as strategic alliances, apac re-refined base oils market forecast, partnerships, mergers and acquisitions, geographical expansion, and product/service launches, to enhance their presence in the industry.

Bharat Oil and Waste Management Ltd. - Delivering high-quality re-refined base oils through advanced recycling processes, providing a sustainable alternative to virgin feedstocks for the global lubricant industry.

The industry research and growth report includes detailed analyses of the competitive landscape of the market and information about key companies, including:

  • Bharat Oil and Waste Management Ltd.
  • Chevron Corp.
  • Clean Harbors Inc.
  • DYM Resources
  • ENEOS Corp.
  • GS Caltex India
  • Hanwa Co. Ltd.
  • HD Hyundai Oil Bank Co., Ltd
  • Heritage Crystal Clean Inc.
  • Hindustan Petroleum Corp. Ltd.
  • IFP Petro Products Pvt. Ltd.
  • Nova Lubes Pvt Ltd
  • Petro Naft
  • PetroChina Co. Ltd.
  • PurePath CET Co. Ltd
  • Saudi Arabian Oil Co.
  • Shell plc
  • SK Inc.
  • Southern Oil
  • Yunigreen

Qualitative and quantitative analysis of companies has been conducted to help clients understand the wider business environment as well as the strengths and weaknesses of key industry players. Data is qualitatively analyzed to categorize companies as pure play, category-focused, industry-focused, and diversified; it is quantitatively analyzed to categorize companies as dominant, leading, strong, tentative, and weak.

Recent Development and News in Apac re-refined base oils market

  • In March 2025, Crystal Clean Inc. announced findings from a life cycle assessment for its HCC 150 re-refined base oil, demonstrating a 77% reduction in greenhouse gas emissions compared to virgin base oils.
  • In April 2025, the Ministry of Petroleum and Natural Gas of India mandated that public sector oil companies increase their procurement of re-refined stocks for use in non-critical applications, boosting domestic demand.
  • In June 2025, The Global Infrastructure Facility published an assessment on the financial risks of waste-to-resource projects in APAC's developing nations, highlighting that high interest rates discourage private investment.
  • In November 2025, Vertex Energy Inc. announced the successful commissioning of its hydrocracker at its Mobile, Alabama facility, which is now producing Group III re-refined base oil.

Dive into Technavio’s robust research methodology, blending expert interviews, extensive data synthesis, and validated models for unparalleled APAC Re-refined Base Oils Market insights. See full methodology.

Market Scope
Page number 227
Base year 2025
Historic period 2020-2024
Forecast period 2026-2030
Growth momentum & CAGR Accelerate at a CAGR of 9.1%
Market growth 2026-2030 USD 1476.2 million
Market structure Fragmented
YoY growth 2025-2026(%) 8.4%
Key countries China, India, Japan, South Korea and Rest of APAC
Competitive landscape Leading Companies, Market Positioning of Companies, Competitive Strategies, and Industry Risks

Request Free Sample

Research Analyst Overview

  • The re-refined base oils market is maturing beyond a niche recycling activity into a critical component of industrial resource management. For corporate boards, the key decision pivots on balancing feedstock security with environmental compliance standards.
  • The adoption of advanced technologies like the hydro-treating process and catalytic hydro-finishing is central to this, enabling the production of high-quality group ii base oil and group iii base oil. These processes ensure effective feedstock contamination removal, including heavy metal removal and neutralization of polycyclic aromatic hydrocarbon content, leading to high viscosity index and low sulfur content products.
  • This technological parity allows for seamless additive package compatibility and robust thermal degradation resistance. Firms that vertically integrate their lubricant lifecycle management by investing in waste oil collection infrastructure can achieve superior oxidative stability enhancement.
  • This strategic move, supported by solvent extraction refining and vacuum distillation, facilitates hydrocarbon chain restoration, resulting in high base stock purity from used motor oil feedstock and supporting circular economy principles under extended producer responsibility frameworks for waste lubricant oil processing. This approach de-risks supply chains, achieving up to 20% cost stability compared to virgin oil sourcing.

What are the Key Data Covered in this APAC Re-refined Base Oils Market Research and Growth Report?

  • What is the expected growth of the APAC Re-refined Base Oils Market between 2026 and 2030?

    • USD 1.48 billion, at a CAGR of 9.1%

  • What segmentation does the market report cover?

    • The report is segmented by Type (Group II, Group I, and Group III), Application (Engine oil, Industrial oil, Transmission oil, Gear oil, and Others), Technology (Clay treatment, Hydrotreating process, Vacuum distillation, Solvent extraction, and Others) and Geography (APAC)

  • Which regions are analyzed in the report?

    • APAC

  • What are the key growth drivers and market challenges?

    • Stringent regulatory frameworks and carbon neutrality mandates, Deeply rooted consumer skepticism and perception of substandard quality

  • Who are the major players in the APAC Re-refined Base Oils Market?

    • Bharat Oil and Waste Management Ltd., Chevron Corp., Clean Harbors Inc., DYM Resources, ENEOS Corp., GS Caltex India, Hanwa Co. Ltd., HD Hyundai Oil Bank Co., Ltd, Heritage Crystal Clean Inc., Hindustan Petroleum Corp. Ltd., IFP Petro Products Pvt. Ltd., Nova Lubes Pvt Ltd, Petro Naft, PetroChina Co. Ltd., PurePath CET Co. Ltd, Saudi Arabian Oil Co., Shell plc, SK Inc., Southern Oil and Yunigreen

Market Research Insights

  • The dynamics of the re-refined base oils market are shaped by a strategic shift towards sustainable lubricant solutions and circular supply chain models. This transition is delivering measurable business outcomes, with advanced re-refining technology providers enabling a 77% reduction in greenhouse gas emissions compared to virgin oil production.
  • Furthermore, the adoption of closed-loop lubrication systems helps industrial players mitigate the risks of volatile crude oil prices, which can fluctuate by over 30% annually. By implementing a robust feedstock procurement strategy and leveraging local sourcing of base oils, companies can achieve greater cost stability and supply chain resilience.
  • This focus on waste-to-resource projects not only supports corporate sustainability goals but also enhances operational efficiency by turning a waste stream into a valuable raw material.

We can help! Our analysts can customize this apac re-refined base oils market research report to meet your requirements.

Get in touch

1. Executive Summary

1.1 Market overview

Executive Summary - Chart on Market Overview
Executive Summary - Data Table on Market Overview
Executive Summary - Chart on Country Market Characteristics
Executive Summary - Chart on Market by Geography
Executive Summary - Chart on Market Segmentation by Type
Executive Summary - Chart on Market Segmentation by Application
Executive Summary - Chart on Market Segmentation by Technology
Executive Summary - Chart on Incremental Growth
Executive Summary - Data Table on Incremental Growth
Executive Summary - Chart on Company Market Positioning

2. Technavio Analysis

2.1 Analysis of price sensitivity, lifecycle, customer purchase basket, adoption rates, and purchase criteria

2.2 Criticality of inputs and Factors of differentiation

Overview on criticality of inputs and factors of differentiation

2.3 Factors of disruption

Overview on factors of disruption

2.4 Impact of drivers and challenges

Impact of drivers and challenges in 2025 and 2030

3. Market Landscape

3.1 Market ecosystem

Chart on Parent Market
Data Table on - Parent Market

3.2 Market characteristics

Chart on Market characteristics analysis

3.3 Value chain analysis

Chart on Value chain analysis

4. Market Sizing

4.1 Market definition

Data Table on Offerings of companies included in the market definition

4.2 Market segment analysis

Market segments

4.3 Market size 2025

4.4 Market outlook: Forecast for 2025-2030

Chart on APAC - Market size and forecast 2025-2030 ($ million)
Data Table on Regional - Market size and forecast 2025-2030 ($ million)
Chart on APAC: Year-over-year growth 2025-2030 (%)
Data Table on Regional - Market size and forecast 2025-2030 ($ million)

5. Historic Market Size

5.1 Re-Refined Base Oils Market in APAC 2020 - 2024

Historic Market Size - Data Table on Re-Refined Base Oils Market in APAC 2020 - 2024 ($ million)

5.2 Type segment analysis 2020 - 2024

Historic Market Size - Type Segment 2020 - 2024 ($ million)

5.3 Application segment analysis 2020 - 2024

Historic Market Size - Application Segment 2020 - 2024 ($ million)

5.4 Technology segment analysis 2020 - 2024

Historic Market Size - Technology Segment 2020 - 2024 ($ million)

5.5 Geography segment analysis 2020 - 2024

Historic Market Size - Geography Segment 2020 - 2024 ($ million)

6. Qualitative Analysis

6.1 Impact of AI on the Re-Refined Base Oils Market in APAC

7. Five Forces Analysis

7.1 Five forces summary

Five forces analysis - Comparison between 2025 and 2030

7.2 Bargaining power of buyers

Bargaining power of buyers - Impact of key factors 2025 and 2030

7.3 Bargaining power of suppliers

Bargaining power of suppliers - Impact of key factors in 2025 and 2030

7.4 Threat of new entrants

Threat of new entrants - Impact of key factors in 2025 and 2030

7.5 Threat of substitutes

Threat of substitutes - Impact of key factors in 2025 and 2030

7.6 Threat of rivalry

Threat of rivalry - Impact of key factors in 2025 and 2030

7.7 Market condition

Chart on Market condition - Five forces 2025 and 2030

8. Market Segmentation by Type

8.1 Market segments

Chart on Type - Market share 2025-2030 (%)
Data Table on Type - Market share 2025-2030 (%)

8.2 Comparison by Type

Chart on Comparison by Type
Data Table on Comparison by Type

8.3 Group II - Market size and forecast 2025-2030

Chart on Group II - Market size and forecast 2025-2030 ($ million)
Data Table on Group II - Market size and forecast 2025-2030 ($ million)
Chart on Group II - Year-over-year growth 2025-2030 (%)
Data Table on Group II - Year-over-year growth 2025-2030 (%)

8.4 Group I - Market size and forecast 2025-2030

Chart on Group I - Market size and forecast 2025-2030 ($ million)
Data Table on Group I - Market size and forecast 2025-2030 ($ million)
Chart on Group I - Year-over-year growth 2025-2030 (%)
Data Table on Group I - Year-over-year growth 2025-2030 (%)

8.5 Group III - Market size and forecast 2025-2030

Chart on Group III - Market size and forecast 2025-2030 ($ million)
Data Table on Group III - Market size and forecast 2025-2030 ($ million)
Chart on Group III - Year-over-year growth 2025-2030 (%)
Data Table on Group III - Year-over-year growth 2025-2030 (%)

8.6 Market opportunity by Type

Market opportunity by Type ($ million)
Data Table on Market opportunity by Type ($ million)

9. Market Segmentation by Application

9.1 Market segments

Chart on Application - Market share 2025-2030 (%)
Data Table on Application - Market share 2025-2030 (%)

9.2 Comparison by Application

Chart on Comparison by Application
Data Table on Comparison by Application

9.3 Engine oil - Market size and forecast 2025-2030

Chart on Engine oil - Market size and forecast 2025-2030 ($ million)
Data Table on Engine oil - Market size and forecast 2025-2030 ($ million)
Chart on Engine oil - Year-over-year growth 2025-2030 (%)
Data Table on Engine oil - Year-over-year growth 2025-2030 (%)

9.4 Industrial oil - Market size and forecast 2025-2030

Chart on Industrial oil - Market size and forecast 2025-2030 ($ million)
Data Table on Industrial oil - Market size and forecast 2025-2030 ($ million)
Chart on Industrial oil - Year-over-year growth 2025-2030 (%)
Data Table on Industrial oil - Year-over-year growth 2025-2030 (%)

9.5 Transmission oil - Market size and forecast 2025-2030

Chart on Transmission oil - Market size and forecast 2025-2030 ($ million)
Data Table on Transmission oil - Market size and forecast 2025-2030 ($ million)
Chart on Transmission oil - Year-over-year growth 2025-2030 (%)
Data Table on Transmission oil - Year-over-year growth 2025-2030 (%)

9.6 Gear oil - Market size and forecast 2025-2030

Chart on Gear oil - Market size and forecast 2025-2030 ($ million)
Data Table on Gear oil - Market size and forecast 2025-2030 ($ million)
Chart on Gear oil - Year-over-year growth 2025-2030 (%)
Data Table on Gear oil - Year-over-year growth 2025-2030 (%)

9.7 Others - Market size and forecast 2025-2030

Chart on Others - Market size and forecast 2025-2030 ($ million)
Data Table on Others - Market size and forecast 2025-2030 ($ million)
Chart on Others - Year-over-year growth 2025-2030 (%)
Data Table on Others - Year-over-year growth 2025-2030 (%)

9.8 Market opportunity by Application

Market opportunity by Application ($ million)
Data Table on Market opportunity by Application ($ million)

10. Market Segmentation by Technology

10.1 Market segments

Chart on Technology - Market share 2025-2030 (%)
Data Table on Technology - Market share 2025-2030 (%)

10.2 Comparison by Technology

Chart on Comparison by Technology
Data Table on Comparison by Technology

10.3 Clay treatment - Market size and forecast 2025-2030

Chart on Clay treatment - Market size and forecast 2025-2030 ($ million)
Data Table on Clay treatment - Market size and forecast 2025-2030 ($ million)
Chart on Clay treatment - Year-over-year growth 2025-2030 (%)
Data Table on Clay treatment - Year-over-year growth 2025-2030 (%)

10.4 Hydrotreating process - Market size and forecast 2025-2030

Chart on Hydrotreating process - Market size and forecast 2025-2030 ($ million)
Data Table on Hydrotreating process - Market size and forecast 2025-2030 ($ million)
Chart on Hydrotreating process - Year-over-year growth 2025-2030 (%)
Data Table on Hydrotreating process - Year-over-year growth 2025-2030 (%)

10.5 Vacuum distillation - Market size and forecast 2025-2030

Chart on Vacuum distillation - Market size and forecast 2025-2030 ($ million)
Data Table on Vacuum distillation - Market size and forecast 2025-2030 ($ million)
Chart on Vacuum distillation - Year-over-year growth 2025-2030 (%)
Data Table on Vacuum distillation - Year-over-year growth 2025-2030 (%)

10.6 Solvent extraction - Market size and forecast 2025-2030

Chart on Solvent extraction - Market size and forecast 2025-2030 ($ million)
Data Table on Solvent extraction - Market size and forecast 2025-2030 ($ million)
Chart on Solvent extraction - Year-over-year growth 2025-2030 (%)
Data Table on Solvent extraction - Year-over-year growth 2025-2030 (%)

10.7 Others - Market size and forecast 2025-2030

Chart on Others - Market size and forecast 2025-2030 ($ million)
Data Table on Others - Market size and forecast 2025-2030 ($ million)
Chart on Others - Year-over-year growth 2025-2030 (%)
Data Table on Others - Year-over-year growth 2025-2030 (%)

10.8 Market opportunity by Technology

Market opportunity by Technology ($ million)
Data Table on Market opportunity by Technology ($ million)

11. Customer Landscape

11.1 Customer landscape overview

Analysis of price sensitivity, lifecycle, customer purchase basket, adoption rates, and purchase criteria

12. Geographic Landscape

12.1 Geographic segmentation

Chart on Market share by geography - 2025-2030 (%)
Data Table on Market share by geography - 2025-2030 (%)

12.2 Geographic comparison

Chart on Geographic comparison
Data Table on Geographic comparison

12.3 China - Market size and forecast 2025-2030

Chart on China - Market size and forecast 2025-2030 ($ million)
Data Table on China - Market size and forecast 2025-2030 ($ million)
Chart on China - Year-over-year growth 2025-2030 (%)
Data Table on China - Year-over-year growth 2025-2030 (%)

12.4 India - Market size and forecast 2025-2030

Chart on India - Market size and forecast 2025-2030 ($ million)
Data Table on India - Market size and forecast 2025-2030 ($ million)
Chart on India - Year-over-year growth 2025-2030 (%)
Data Table on India - Year-over-year growth 2025-2030 (%)

12.5 Japan - Market size and forecast 2025-2030

Chart on Japan - Market size and forecast 2025-2030 ($ million)
Data Table on Japan - Market size and forecast 2025-2030 ($ million)
Chart on Japan - Year-over-year growth 2025-2030 (%)
Data Table on Japan - Year-over-year growth 2025-2030 (%)

12.6 South Korea - Market size and forecast 2025-2030

Chart on South Korea - Market size and forecast 2025-2030 ($ million)
Data Table on South Korea - Market size and forecast 2025-2030 ($ million)
Chart on South Korea - Year-over-year growth 2025-2030 (%)
Data Table on South Korea - Year-over-year growth 2025-2030 (%)

12.7 Rest of APAC - Market size and forecast 2025-2030

Chart on Rest of APAC - Market size and forecast 2025-2030 ($ million)
Data Table on Rest of APAC - Market size and forecast 2025-2030 ($ million)
Chart on Rest of APAC - Year-over-year growth 2025-2030 (%)
Data Table on Rest of APAC - Year-over-year growth 2025-2030 (%)

12.8 Market opportunity by geography

Market opportunity by geography ($ million)
Data Table on Market opportunity by geography ($ million)

13. Drivers, Challenges, and Opportunity

13.1 Market drivers

Stringent regulatory frameworks and carbon neutrality mandates
Economic viability and volatility mitigation in crude oil markets
Rapid technological advancement in refinement and purification processes

13.2 Market challenges

Deeply rooted consumer skepticism and perception of substandard quality
Structural inefficiencies in feedstock collection and logistical networks
Substantial capital requirements and economic barriers to entry

13.3 Impact of drivers and challenges

Impact of drivers and challenges in 2025 and 2030

13.4 Market opportunities

Implementation of circular economy frameworks
Proliferation of high-quality group II and group III re-refined base oils
Strategic consolidation of feedstock procurement and digitalization of supply chains

14. Competitive Landscape

14.1 Overview

14.2

Overview on criticality of inputs and factors of differentiation

14.3 Landscape disruption

Overview on factors of disruption

14.4 Industry risks

Impact of key risks on business

15. Competitive Analysis

15.1 Companies profiled

Companies covered

15.2 Company ranking index

15.3 Market positioning of companies

Matrix on companies position and classification

15.4 Bharat Oil and Waste Management Ltd.

Bharat Oil and Waste Management Ltd. - Overview
Bharat Oil and Waste Management Ltd. - Product / Service
Bharat Oil and Waste Management Ltd. - Key offerings
SWOT

15.5 Chevron Corp.

Chevron Corp. - Overview
Chevron Corp. - Business segments
Chevron Corp. - Key news
Chevron Corp. - Key offerings
Chevron Corp. - Segment focus
SWOT

15.6 DYM Resources

DYM Resources - Overview
DYM Resources - Product / Service
DYM Resources - Key offerings
SWOT

15.7 ENEOS Corp.

ENEOS Corp. - Overview
ENEOS Corp. - Business segments
ENEOS Corp. - Key news
ENEOS Corp. - Key offerings
ENEOS Corp. - Segment focus
SWOT

15.8 GS Caltex India

GS Caltex India - Overview
GS Caltex India - Product / Service
GS Caltex India - Key offerings
SWOT

15.9 HD Hyundai Oil Bank Co., Ltd

HD Hyundai Oil Bank Co., Ltd - Overview
HD Hyundai Oil Bank Co., Ltd - Product / Service
HD Hyundai Oil Bank Co., Ltd - Key offerings
SWOT

15.10 Heritage Crystal Clean Inc.

Heritage Crystal Clean Inc. - Overview
Heritage Crystal Clean Inc. - Product / Service
Heritage Crystal Clean Inc. - Key offerings
SWOT

15.11 Hindustan Petroleum Corp. Ltd.

Hindustan Petroleum Corp. Ltd. - Overview
Hindustan Petroleum Corp. Ltd. - Business segments
Hindustan Petroleum Corp. Ltd. - Key news
Hindustan Petroleum Corp. Ltd. - Key offerings
Hindustan Petroleum Corp. Ltd. - Segment focus
SWOT

15.12 IFP Petro Products Pvt. Ltd.

IFP Petro Products Pvt. Ltd. - Overview
IFP Petro Products Pvt. Ltd. - Product / Service
IFP Petro Products Pvt. Ltd. - Key offerings
SWOT

15.13 Nova Lubes Pvt Ltd

Nova Lubes Pvt Ltd - Overview
Nova Lubes Pvt Ltd - Product / Service
Nova Lubes Pvt Ltd - Key offerings
SWOT

15.14 Petro Naft

Petro Naft - Overview
Petro Naft - Product / Service
Petro Naft - Key offerings
SWOT

15.15 PetroChina Co. Ltd.

PetroChina Co. Ltd. - Overview
PetroChina Co. Ltd. - Business segments
PetroChina Co. Ltd. - Key offerings
PetroChina Co. Ltd. - Segment focus
SWOT

15.16 PurePath CET Co. Ltd

PurePath CET Co. Ltd - Overview
PurePath CET Co. Ltd - Product / Service
PurePath CET Co. Ltd - Key offerings
SWOT

15.17 Shell plc

Shell plc - Overview
Shell plc - Business segments
Shell plc - Key news
Shell plc - Key offerings
Shell plc - Segment focus
SWOT

15.18 Southern Oil

Southern Oil - Overview
Southern Oil - Product / Service
Southern Oil - Key offerings
SWOT

16. Appendix

16.1 Scope of the report

Market definition
Objectives
Notes and caveats

16.2 Inclusions and exclusions checklist

Inclusions checklist
Exclusions checklist

16.3 Currency conversion rates for US$

16.4 Research methodology

16.5 Data procurement

Information sources

16.6 Data validation

16.7 Validation techniques employed for market sizing

16.8 Data synthesis

16.9 360 degree market analysis

16.10 List of abbreviations

Research Methodology

Technavio presents a detailed picture of the market by way of study, synthesis, and summation of data from multiple sources. The analysts have presented the various facets of the market with a particular focus on identifying the key industry influencers. The data thus presented is comprehensive, reliable, and the result of extensive research, both primary and secondary.

INFORMATION SOURCES

Primary sources

  • Manufacturers and suppliers
  • Channel partners
  • Industry experts
  • Strategic decision makers

Secondary sources

  • Industry journals and periodicals
  • Government data
  • Financial reports of key industry players
  • Historical data
  • Press releases

DATA ANALYSIS

Data Synthesis

  • Collation of data
  • Estimation of key figures
  • Analysis of derived insights

Data Validation

  • Triangulation with data models
  • Reference against proprietary databases
  • Corroboration with industry experts

REPORT WRITING

Qualitative

  • Market drivers
  • Market challenges
  • Market trends
  • Five forces analysis

Quantitative

  • Market size and forecast
  • Market segmentation
  • Geographical insights
  • Competitive landscape

Interested in this report?

Get your sample now to see our research methodology and insights!

Download Now

Frequently Asked Questions

APAC Re-refined Base Oils market growth will increase by USD 1476.2 million during 2026-2030 .

The APAC Re-refined Base Oils market is expected to grow at a CAGR of 9.1% during 2026-2030 .

APAC Re-refined Base Oils market is segmented by Type (Group II, Group I, Group III) Application (Engine oil, Industrial oil, Transmission oil, Gear oil, Others) Technology (Clay treatment, Hydrotreating process, Vacuum distillation, Solvent extraction, Others)

Bharat Oil and Waste Management Ltd., Chevron Corp., Clean Harbors Inc., DYM Resources, ENEOS Corp., GS Caltex India, Hanwa Co. Ltd., HD Hyundai Oil Bank Co., Ltd, Heritage Crystal Clean Inc., Hindustan Petroleum Corp. Ltd., IFP Petro Products Pvt. Ltd., Nova Lubes Pvt Ltd, Petro Naft, PetroChina Co. Ltd., PurePath CET Co. Ltd, Saudi Arabian Oil Co., Shell plc, SK Inc., Southern Oil, Yunigreen are a few of the key vendors in the APAC Re-refined Base Oils market.

APAC will register the highest growth rate of 100% among the other regions. Therefore, the APAC Re-refined Base Oils market in APAC is expected to garner significant business opportunities for the vendors during the forecast period.

China, India, Japan, South Korea, Rest of APAC

  • Stringent regulatory frameworks and carbon neutrality mandates is the driving factor this market.

The APAC Re-refined Base Oils market vendors should focus on grabbing business opportunities from the Type segment as it accounted for the largest market share in the base year.