
Re-refined Base Oils Market Size 2026-2030
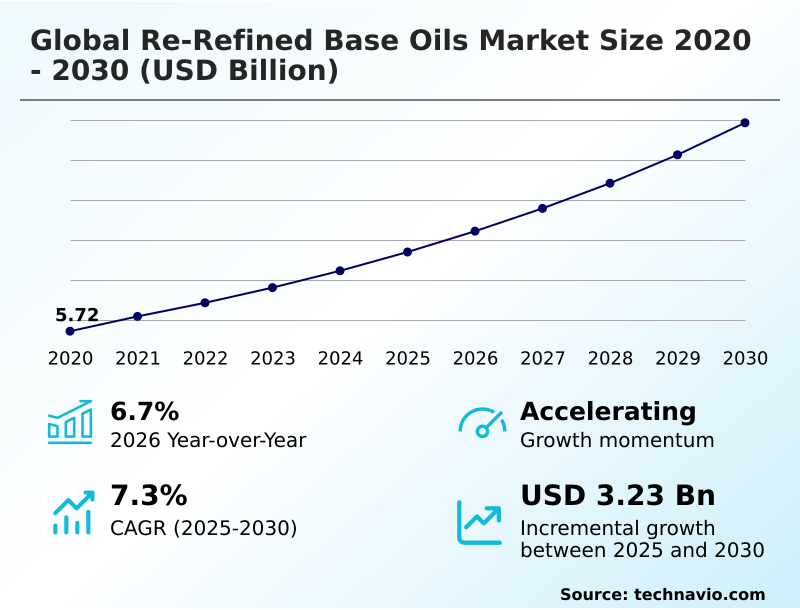
The re-refined base oils market size is valued to increase by USD 3.23 billion, at a CAGR of 7.3% from 2025 to 2030. Stringent environmental regulations and circular economy mandates will drive the re-refined base oils market.
Major Market Trends & Insights
- APAC dominated the market and accounted for a 45.7% growth during the forecast period.
- By Type - Group I segment was valued at USD 3.32 billion in 2024
- By Application - Engine oil segment accounted for the largest market revenue share in 2024
Market Size & Forecast
- Market Opportunities: USD 5.21 billion
- Market Future Opportunities: USD 3.23 billion
- CAGR from 2025 to 2030 : 7.3%
Market Summary
- The re-refined base oils market is central to the industrial transition toward a circular economy, driven by stringent environmental regulations and corporate sustainability mandates. This shift compels industries to treat used lubricants not as waste but as a valuable resource.
- Technical advancements, particularly in hydrotreating processes and high-vacuum distillation, are critical, enabling the production of high-performance Group II and Group III base stocks that rival virgin oils in quality. This allows for their use in demanding applications like modern automotive engines and precision industrial machinery. However, the industry grapples with challenges related to the inconsistent quality of used lubricant feedstock.
- For instance, a logistics company aiming to meet its ESG targets might switch its fleet to re-refined engine oils. This move reduces its carbon footprint and operational costs, but success hinges on sourcing lubricants with a verifiable life cycle assessment and consistent purity, highlighting the need for robust quality control throughout the supply chain, from collection to final product.
What will be the Size of the Re-refined Base Oils Market during the forecast period?
Get Key Insights on Market Forecast (PDF) Get Free Sample
How is the Re-refined Base Oils Market Segmented?
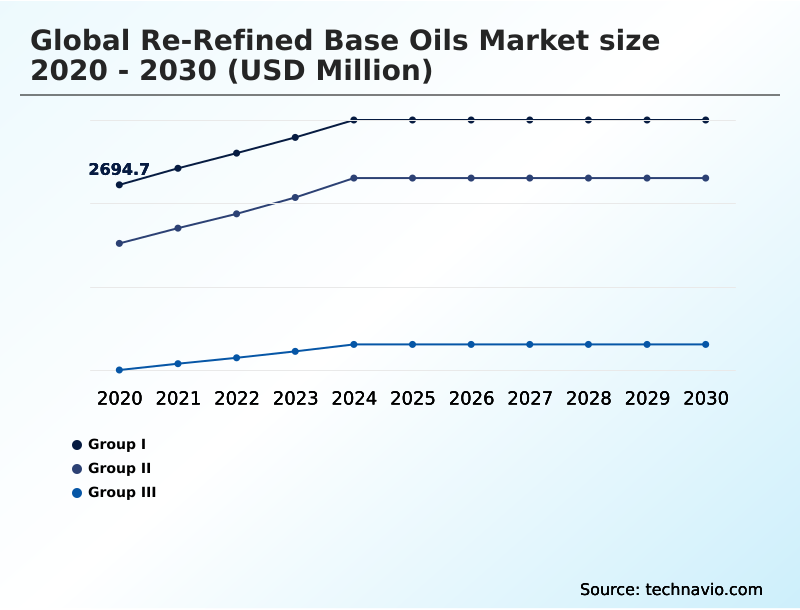
The re-refined base oils industry research report provides comprehensive data (region-wise segment analysis), with forecasts and estimates in "USD million" for the period 2026-2030, as well as historical data from 2020-2024 for the following segments.
- Type
- Group I
- Group II
- Group III
- Application
- Engine oil
- Industrial oil
- Transmission oil
- Gear oil
- Others
- Technology
- Hydrotreating process
- Clay treatment
- Vacuum distillation
- Solvent extraction
- Others
- Geography
- APAC
- China
- India
- Japan
- Europe
- Germany
- France
- UK
- North America
- US
- Canada
- Mexico
- Middle East and Africa
- Saudi Arabia
- UAE
- South Africa
- South America
- Brazil
- Argentina
- Colombia
- Rest of World (ROW)
- APAC
By Type Insights
The group i segment is estimated to witness significant growth during the forecast period.
The Group I segment remains a vital component of the re-refined base oils market, encompassing lubricants produced via solvent refining.
These oils, characterized by a viscosity index between 80 and 120 and over 0.03% sulfur, are fundamental to various industrial applications, including heavy-duty greases and metalworking fluids.
The re-refining of used oil into Group I base stocks, a key part of the green chemical industry, provides a sustainable alternative that supports a circular economy model.
While the market is shifting toward higher-performance groups, demand for these sustainable lubrication solutions persists, particularly for legacy systems where their solvency and compatibility with specific additive packages are crucial.
In some specialized manufacturing processes, Group I oils maintain a retention rate of over 85% due to these specific properties.
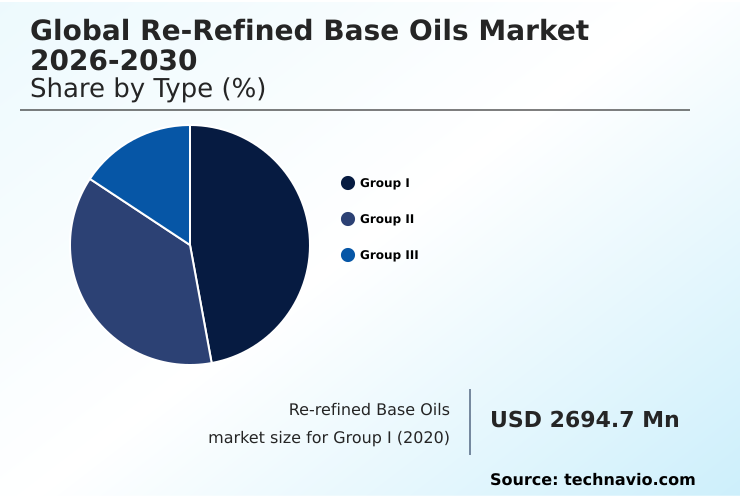
The Group I segment was valued at USD 3.32 billion in 2024 and showed a gradual increase during the forecast period.
Regional Analysis
APAC is estimated to contribute 45.7% to the growth of the global market during the forecast period.Technavio’s analysts have elaborately explained the regional trends and drivers that shape the market during the forecast period.

See How Re-refined Base Oils Market Demand is Rising in APAC Get Free Sample
The geographic landscape of the re-refined base oils market is diversifying, with distinct regional drivers shaping growth.
Europe leads in regulatory maturity, where stringent circular economy mandates have fostered a highly technical industry focused on producing high-purity hydraulic fluids and naphthenic specialty oils.
North America leverages its robust infrastructure for used motor oil re-refineries, with federal procurement policies boosting adoption of recycled content by over 20% in public sector fleets.
However, the most significant incremental growth is projected to originate from APAC, which is expected to contribute approximately 45.7% of the market's expansion.
This surge is fueled by industrialization and new environmental policies in emerging economies, driving demand for sustainable solutions like circular transformer fluids and low-carbon industrial inputs.
This regional dynamism underscores a global shift toward resource recovery and advanced waste oil management.
Market Dynamics
Our researchers analyzed the data with 2025 as the base year, along with the key drivers, trends, and challenges. A holistic analysis of drivers will help companies refine their marketing strategies to gain a competitive advantage.
- Evaluating re-refined base oils performance is a critical exercise for industries aiming to balance sustainability with operational excellence. A direct comparison of re-refined vs virgin oil now shows minimal technical differences, thanks to advancements in re-refining processes. The hydrotreating process for used oil, for instance, has become sophisticated enough to produce high-purity products with desirable characteristics.
- A key focus is improving viscosity index in re-refining, ensuring lubricants perform reliably across a wide temperature range. This has expanded Group III base oil applications into high-performance automotive and industrial sectors. At its core, the re-refining industry embodies the circular economy in lubricant industry, turning waste into a valuable resource.
- The regulatory impact on re-refining has been a major driver, compelling companies to adopt more sustainable practices. For businesses, the benefits of re-refined engine oil include a lower carbon footprint and potential cost savings. The key to realizing these benefits lies in the integrity of the supply chain for re-refined oils, starting with effective waste oil collection and recycling.
- To ensure consistency, many operators now use digital tracking in waste oil, which improves feedstock quality control and reduces processing errors at a rate twice that of firms relying on manual methods. This addresses the historical challenges in re-refined oil quality.
- While the cost of re-refining infrastructure remains a consideration, the long-term value derived from corporate sustainability with re-refined oils and reducing carbon footprint with lubricants provides a compelling business case, supported by detailed life cycle assessment of lubricants.
What are the key market drivers leading to the rise in the adoption of Re-refined Base Oils Industry?
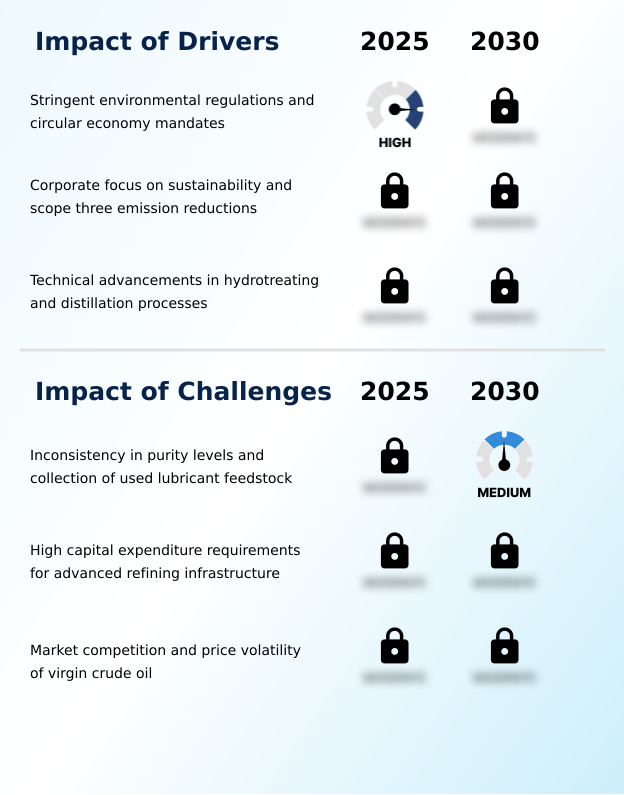
- Stringent environmental regulations and mandates promoting a circular economy are key drivers of the market.
- The re-refined base oils market is fundamentally driven by stringent environmental mandates and corporate sustainability goals. The implementation of extended producer responsibility programs and the broader push for a circular economy compel industries to prioritize effective waste oil management.
- This regulatory pressure, combined with corporate decarbonization targets, fuels demand for recycled fuel oil and re-refined engine oils. Companies utilizing these products report significant environmental gains, including a 77% reduction in greenhouse gas emissions from their lubricant supply chain.
- Furthermore, advancements in catalytic hydrotreating allow for the precise cracking of hydrocarbon chains from used lubricant feedstock, enabling the creation of high-quality base oils within closed-loop systems and improving regulatory compliance by up to 40% in certain regions.
What are the market trends shaping the Re-refined Base Oils Industry?
- An upcoming market trend is the rising production and demand for high-performance Group III base oils. These advanced lubricants are increasingly sought after for their synthetic-like performance characteristics.
- A primary trend in the re-refined base oils market is the convergence of digitalization and the demand for premium products. The industry is witnessing a significant push towards the production of Group III base oils, which are essential for formulating low-viscosity engine oils for modern vehicles. This is supported by advanced chemical precipitation and re-refining technologies.
- Concurrently, the use of life cycle assessment tools for tracking sustainability metrics is becoming standard practice, with digital systems reducing feedstock sourcing errors by 25%. This data-driven approach strengthens the regenerative industrial framework and supports sustainable procurement practices.
- Strategic consolidation across the re-refining industry is also accelerating, leading to a 15% increase in R&D investment for some integrated firms focused on improving waste oil collection and processing efficiency.
What challenges does the Re-refined Base Oils Industry face during its growth?
- A key challenge affecting industry growth is the inconsistency in purity levels and the collection of used lubricant feedstock.
- Key challenges in the re-refined base oils market stem from feedstock variability and competitive pressures. The inconsistent quality of used lubricant feedstock can increase processing costs by up to 30%, requiring advanced solvent extraction and filtration methods to achieve a stable viscosity index.
- Although the industry produces high-quality PCB-free industrial lubricants and other eco-labeled products, the high capital expenditure required for advanced refining infrastructure remains a significant barrier to entry. This is compounded by competition from virgin oils, whose prices can dip below re-refined alternatives during periods of crude oil market volatility.
- For example, the price of some re-refined products can be up to 15% higher than their virgin counterparts, challenging the economic viability for some end-users despite the clear sustainability benefits.
Exclusive Technavio Analysis on Customer Landscape
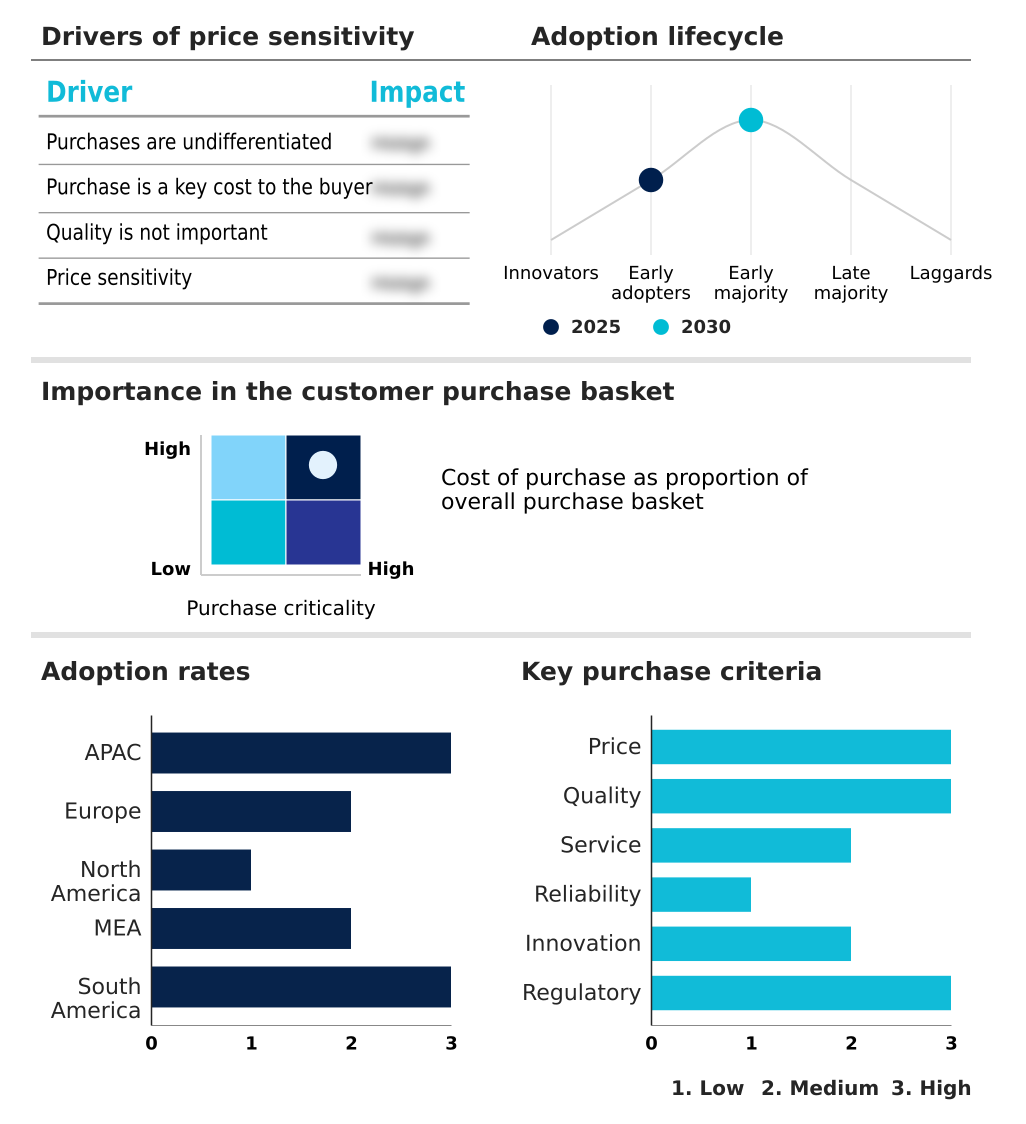
The re-refined base oils market forecasting report includes the adoption lifecycle of the market, covering from the innovator’s stage to the laggard’s stage. It focuses on adoption rates in different regions based on penetration. Furthermore, the re-refined base oils market report also includes key purchase criteria and drivers of price sensitivity to help companies evaluate and develop their market growth analysis strategies.
Customer Landscape of Re-refined Base Oils Industry
Competitive Landscape
Companies are implementing various strategies, such as strategic alliances, re-refined base oils market forecast, partnerships, mergers and acquisitions, geographical expansion, and product/service launches, to enhance their presence in the industry.
AVISTA OIL Deutschland GmbH - Specializing in the advanced recycling of industrial lubricants, the firm produces premium Group III and Group I++ equivalent base oils for sustainable lubrication solutions.
The industry research and growth report includes detailed analyses of the competitive landscape of the market and information about key companies, including:
- AVISTA OIL Deutschland GmbH
- Bharat Oil and Waste Management Ltd.
- Biosynthetic Technologies
- Castrol Ltd.
- Clean Harbors Inc.
- Cleanaway Waste Management Ltd.
- Emerald Transformer
- GFL Environmental Inc.
- Hemraj Petrochem Pvt. Ltd.
- Heritage Crystal Clean Inc.
- Hydrodec Group plc
- IFP Petro Products Pvt. Ltd.
- Itelyum Regeneration S.p.A.
- Lwart Solucoes Ambientais
- Nynas AB
- PURAGLOBE Germany GmbH
- ReGen III Corp.
- Rock Oil Refining Inc.
- Shell plc
- Vertex Energy Inc.
Qualitative and quantitative analysis of companies has been conducted to help clients understand the wider business environment as well as the strengths and weaknesses of key industry players. Data is qualitatively analyzed to categorize companies as pure play, category-focused, industry-focused, and diversified; it is quantitatively analyzed to categorize companies as dominant, leading, strong, tentative, and weak.
Recent Development and News in Re-refined base oils market
- In April, 2025, Shell and Blue Tide completed construction of their joint used oil re-refining plant in Baytown, Texas, aimed at producing re-refined base oils with a lower carbon footprint.
- In March, 2025, Crystal Clean, Inc. announced that its HCC 150 re-refined base oil achieves a 77% reduction in greenhouse gas emissions compared to virgin base oils, based on a third-party reviewed life cycle assessment.
- In February, 2025, Clean Harbors Inc. announced a major upgrade to its refining infrastructure to increase the purity and yield of its recycled base oils for the premium automotive market.
- In January, 2025, Motul introduced its revamped motorcycle lubricant range featuring NGEN Core technology, which integrates re-refined base oils to enhance performance and improve the product's environmental profile.
Dive into Technavio’s robust research methodology, blending expert interviews, extensive data synthesis, and validated models for unparalleled Re-refined Base Oils Market insights. See full methodology.
| Market Scope | |
|---|---|
| Page number | 306 |
| Base year | 2025 |
| Historic period | 2020-2024 |
| Forecast period | 2026-2030 |
| Growth momentum & CAGR | Accelerate at a CAGR of 7.3% |
| Market growth 2026-2030 | USD 3227.7 million |
| Market structure | Fragmented |
| YoY growth 2025-2026(%) | 6.7% |
| Key countries | China, India, Japan, Indonesia, South Korea, Malaysia, Germany, France, UK, Italy, Spain, The Netherlands, US, Canada, Mexico, Saudi Arabia, UAE, South Africa, Egypt, Turkey, Brazil, Argentina and Colombia |
| Competitive landscape | Leading Companies, Market Positioning of Companies, Competitive Strategies, and Industry Risks |
Research Analyst Overview
- The re-refined base oils market is undergoing a significant transformation, driven by a global push for a circular economy and resource efficiency. Central to this evolution is the advancement of re-refining technologies, including the hydrotreating process, catalytic hydrotreating, and severe hydro-cracking.
- These methods enable the conversion of used lubricant feedstock into high-value products like Group II base stocks and premium Group III base oils. The emphasis is on molecular purification and high-vacuum distillation to produce clean, consistent outputs such as high-purity hydraulic fluids and PCB-free industrial lubricants.
- This technical maturity allows lubricant blenders to formulate products with a high viscosity index, meeting the demands of modern machinery. Facilities employing advanced hydrotreating processes have demonstrated the capacity to reduce harmful sulfur content by more than 99%, a crucial metric for boardroom decisions on environmental compliance.
- The market's trajectory is further influenced by extended producer responsibility schemes and the growing use of life cycle assessments, which quantify the environmental benefits of using re-refined products like naphthenic specialty oils, thin-film evaporation, chemical precipitation, hydrocarbon chains, and circular transformer fluids over virgin alternatives.
What are the Key Data Covered in this Re-refined Base Oils Market Research and Growth Report?
-
What is the expected growth of the Re-refined Base Oils Market between 2026 and 2030?
-
USD 3.23 billion, at a CAGR of 7.3%
-
-
What segmentation does the market report cover?
-
The report is segmented by Type (Group I, Group II, and Group III), Application (Engine oil, Industrial oil, Transmission oil, Gear oil, and Others), Technology (Clay treatment, Vacuum distillation, Solvent extraction, Hydrotreating process, and Others) and Geography (APAC, Europe, North America, Middle East and Africa, South America)
-
-
Which regions are analyzed in the report?
-
APAC, Europe, North America, Middle East and Africa and South America
-
-
What are the key growth drivers and market challenges?
-
Stringent environmental regulations and circular economy mandates, Inconsistency in purity levels and collection of used lubricant feedstock
-
-
Who are the major players in the Re-refined Base Oils Market?
-
AVISTA OIL Deutschland GmbH, Bharat Oil and Waste Management Ltd., Biosynthetic Technologies, Castrol Ltd., Clean Harbors Inc., Cleanaway Waste Management Ltd., Emerald Transformer, GFL Environmental Inc., Hemraj Petrochem Pvt. Ltd., Heritage Crystal Clean Inc., Hydrodec Group plc, IFP Petro Products Pvt. Ltd., Itelyum Regeneration S.p.A., Lwart Solucoes Ambientais, Nynas AB, PURAGLOBE Germany GmbH, ReGen III Corp., Rock Oil Refining Inc., Shell plc and Vertex Energy Inc.
-
Market Research Insights
- The dynamics of the re-refined base oils market are increasingly shaped by sustainable procurement practices and the establishment of a regenerative industrial framework. Corporate decarbonization targets are a primary catalyst, with organizations adopting re-refined engine oils to achieve measurable environmental benefits; some report a reduction in their lubricant-related carbon footprint by over 70% compared to virgin oil products.
- The implementation of closed-loop systems for waste oil collection and processing further enhances resource efficiency, with facilities demonstrating up to a 20% improvement in feedstock recovery rates. This push for sustainable lubrication solutions, supported by the growing availability of eco-labeled products and advanced re-refining technologies, is creating a resilient market.
- As hazardous waste management protocols become more stringent globally, the reliance on these recycled and high-performance regenerated base stocks is set to accelerate.
We can help! Our analysts can customize this re-refined base oils market research report to meet your requirements.
 RIA -
RIA - 
