Aquaculture Cages Market Analysis APAC, North America, Europe, South America, Middle East and Africa - China, India, Vietnam, US, Thailand - Size and Forecast 2024-2028

Aquaculture Cages Market Analysis APAC, North America, Europe, South America, Middle East and Africa - China, India, Vietnam, US, Thailand - Size and Forecast 2024-2028

Published: Jul 2024 170 Pages SKU: IRTNTR70647

Market Overview at a Glance

$92 Mn
Market Opportunity
6.03%
CAGR
5.7
YoY growth 2023-2024(%)

Aquaculture Cages Market Size 2024-2028

The aquaculture cages market size is forecast to increase by USD 92 million, at a CAGR of 6.03% between 2023 and 2028.

  • The market is driven by the increasing consumer preference for nutrient-rich fish and fish products. This trend is fueled by the growing awareness of the health benefits associated with fish consumption, leading to a surge in demand for sustainable and efficient aquaculture solutions. One such solution gaining traction is the use of High-Density Polyethylene (HDPE) aquaculture cages. These cages offer several advantages, including durability, flexibility, and ease of installation, making them a popular choice among end-users. However, the market faces potential challenges. One significant obstacle is the environmental impact of cage aquaculture. Concerns over the potential for escapes, disease transmission, and the impact on wild fish populations continue to pose challenges for the industry.
  • Additionally, the high initial investment costs and the need for regular maintenance and monitoring can deter smaller players and limit market penetration. Companies seeking to capitalize on market opportunities must address these challenges effectively through innovative solutions, regulatory compliance, and sustainable business practices.

What will be the Size of the Aquaculture Cages Market during the forecast period?

Aquaculture Cages Market Size

Explore in-depth regional segment analysis with market size data - historical 2017-2022 and forecasts 2024-2028 - in the full report.  
Request Free Sample

The market continues to evolve, driven by advancements in technology and the expanding demand for sustainable seafood production. Economic feasibility studies play a crucial role in determining the viability of cage farming projects, with mesh size selection and structural integrity being key considerations for optimal fish growth and predator deterrence. Antifouling Coatings and corrosion prevention measures ensure cage longevity, while wastewater treatment systems mitigate environmental impact. Site selection criteria, including water quality and access to resources, are essential for successful cage farming operations. Environmental monitoring and fish biomass estimation tools enable farmers to optimize feed efficiency and stocking density, leading to improved growth rates and profitability.

Cage material selection, fish behavior analysis, and biofouling control are other critical factors influencing market dynamics. Industry growth is expected to reach double-digit percentages in the coming years, fueled by the increasing demand for sustainable aquaculture practices. For instance, a recent study revealed a 15% increase in sales for a major aquaculture company implementing automated feeding systems and remote monitoring technologies. Market players focus on developing innovative solutions for parasite control, cage cleaning methods, Mooring Systems, and disease outbreak prevention to maintain fish health and productivity. Anchor systems, optimal stocking density, water quality sensors, data acquisition systems, and oxygenation systems are other essential components of modern cage farming operations.

Hydrodynamic modeling and sustainable aquaculture practices are gaining traction, ensuring the long-term sustainability and growth of the market.

How is this Aquaculture Cages Industry segmented?

The aquaculture cages industry research report provides comprehensive data (region-wise segment analysis), with forecasts and estimates in "USD million" for the period 2024-2028, as well as historical data from 2017-2022 for the following segments.

  • Application
    • Fish
    • Crustacean
    • Mollusks
    • Others
  • Environment
    • Freshwater aquaculture cages
    • Marine and brackish water aquaculture cages
  • Geography
    • North America
      • US
    • APAC
      • China
      • India
      • Thailand
      • Vietnam
    • Rest of World (ROW)

By Application Insights

The fish segment is estimated to witness significant growth during the forecast period.

The market experienced notable growth in 2022, driven primarily by the fish segment. This expansion was fueled by escalating demand for seafood due to population growth and increasing health consciousness. Advanced technologies, such as recirculating aquaculture systems (RAS) and automation, have significantly improved production efficiency and environmental sustainability in fish farming. Moreover, the development of offshore aquaculture and the integration of smart/advanced technologies offer new opportunities for market expansion. However, challenges persist, including disease outbreaks, environmental concerns, and regulatory barriers, which may hinder market growth.

For instance, disease outbreaks can lead to substantial losses; a study revealed that a single outbreak can result in a 25% decrease in fish biomass. Despite these challenges, the market is expected to continue growing, with industry experts projecting a 15% increase in demand for aquaculture products over the next five years.

Aquaculture Cages Market Size

Request Free Sample

The Fish segment was valued at USD 0.00 million in 2017 and showed a gradual increase during the forecast period.

Regional Analysis

APAC is estimated to contribute 78% to the growth of the global market during the forecast period. Technavio's analysts have elaborately explained the regional trends and drivers that shape the market during the forecast period.

Aquaculture Cages Market Share by Geography

 Request Free Sample

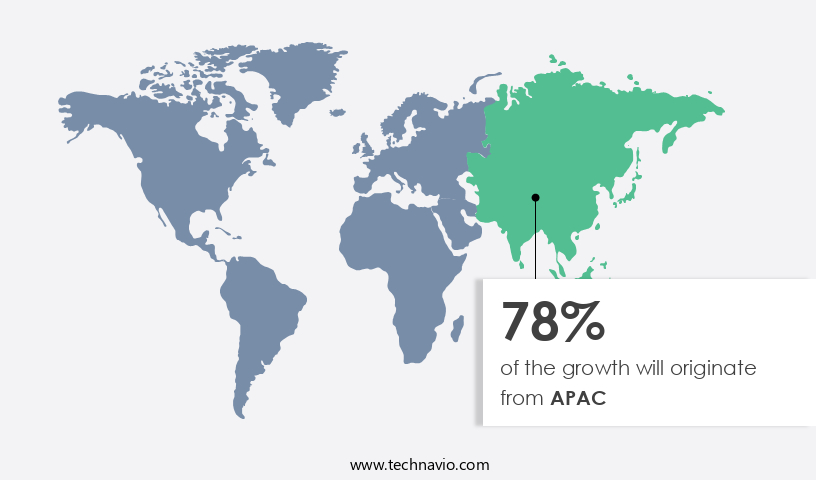
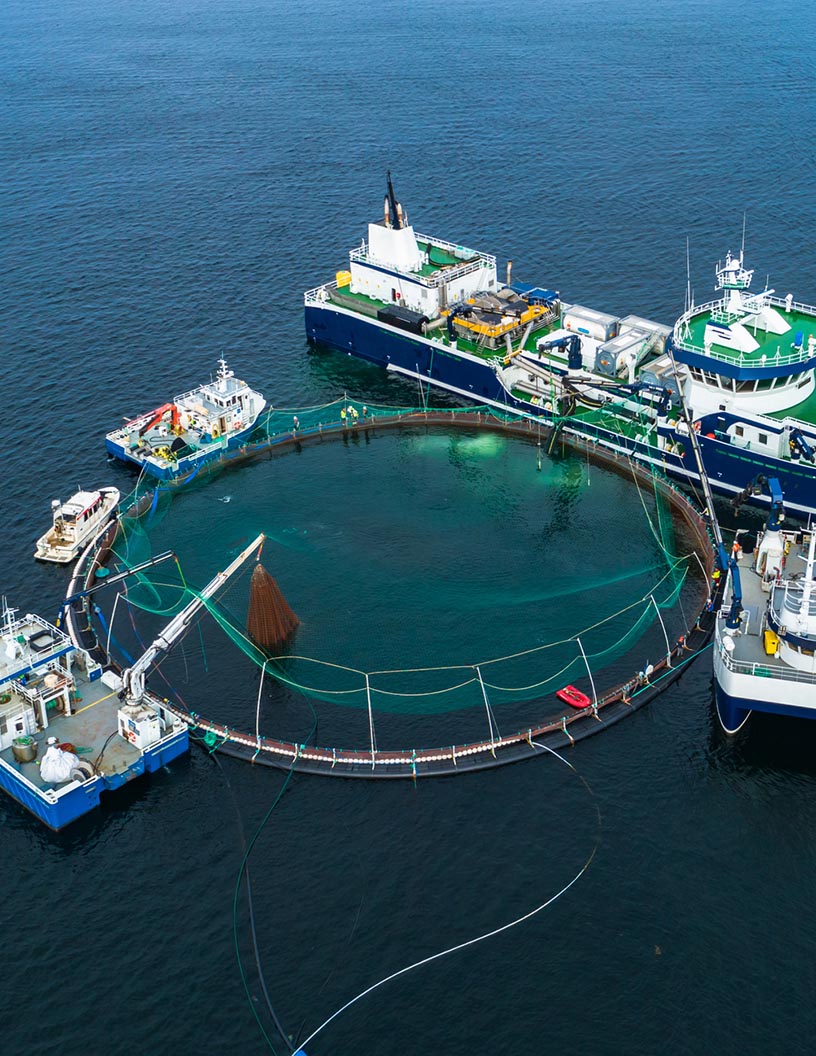
Cage aquaculture is a significant industry in countries such as China, Vietnam, Indonesia, and the Philippines, with various species including seaweed, milkfish, tilapia, shrimp, carp, oysters, and mussels being cultivated. In the Philippines, Low Volume High Density (LVHD) aquaculture cages are increasingly adopted due to their effectiveness in preventing fish escape and feed loss. The offshore cage aquaculture sector in the country is expanding, with plans to deploy more cages to enhance production and improve sustainability. The domestic market for aquaculture products is projected to grow substantially due to rising domestic consumption and undernourishment in the region.

Structural integrity, predator deterrence, and antifouling coatings are crucial considerations in cage design. Corrosion prevention and wastewater treatment are essential for maintaining water quality and ensuring fish health. Site selection criteria, environmental impact, and fish behavior analysis are vital factors in optimizing cage placement and stocking density. Biofouling control, disease outbreak prevention, and parasite control are ongoing challenges addressed through cage cleaning methods, remote monitoring, and automated feeding systems. The industry is expected to grow at a considerable pace, with water circulation, net pen design, and growth rate monitoring playing essential roles in maximizing productivity and efficiency.

Oxygenation systems, escape prevention, hydrodynamic modeling, and sustainable aquaculture practices are also essential components of the evolving market landscape. Overall, the cage aquaculture market is characterized by continuous innovation and adaptation to meet the demands of increasing production and environmental concerns.

Market Dynamics

Our researchers analyzed the data with 2023 as the base year, along with the key drivers, trends, and challenges. A holistic analysis of drivers will help companies refine their marketing strategies to gain a competitive advantage.

What are the key market drivers leading to the rise in the adoption of Aquaculture Cages Industry?

  • The increasing consumer preference for nutrient-rich fish and fish products serves as the primary market driver. 
  • The market is fueled by the rising consumption of fish and fish products due to their nutritional benefits. Fish is a significant source of animal protein, providing essential nutrients such as vitamins A, B, D, niacin, and minerals like iron, iodine, zinc, and phosphorus. Moreover, fish is rich in omega-3 fatty acids, including eicosapentaenoic acid and docosahexaenoic acid, which are vital for human health as the body cannot produce them. Aquaculture, particularly cage culture, contributes significantly to the production of nutritious fish species like salmon and shrimp.
  • For instance, global production of farmed salmon increased by 3% from 2019 to reach 2.3 million metric tons in 2020. The market is expected to grow at a robust pace, with industry analysts projecting a significant expansion in the coming years.

What are the market trends shaping the Aquaculture Cages Industry?

  • End-users are increasingly favoring HDPE aquaculture cages, marking a significant market trend in this industry.
  • The market for aquaculture cages is witnessing significant growth due to the increasing demand for HDPE (High-Density Polyethylene) cages. These cages offer several advantages, including versatility, cost-effectiveness, and ease of operation, making them a popular choice among aquaculture farmers. HDPE is the primary structural material used in the production of these cages, and its malleability allows for various collar sizes and shapes. Key players in the market, such as Badinotti Group, Garware Technical Fibres, and AKVA Group, are focusing on providing flexible and durable HDPE aquaculture cages to cater to the evolving needs of the industry. The adoption of HDPE cages is expected to surge in the coming years, with estimates suggesting a robust growth rate.
  • This trend can be attributed to the growing demand for sustainable and cost-effective aquaculture solutions. The versatility of HDPE cages, combined with their durability and ease of maintenance, makes them an attractive option for aquaculture farmers looking to optimize their operations and increase productivity.

What challenges does the Aquaculture Cages Industry face during its growth?

  • Cage aquaculture faces significant challenges that can hinder industry growth. These potential issues include, but are not limited to, escapes of farmed fish into the wild, disease outbreaks, and environmental concerns related to feed disposal and waste accumulation. Addressing these challenges requires continuous research and innovation to ensure sustainable and efficient aquaculture practices. 
  • Cage aquaculture, an intensive form of aquaculture, faces several challenges that impact market dynamics. Nutrient loss, a significant issue, arises from uneaten feed and fecal waste in the cages. These elements negatively influence water quality and nutrient content. Early forms of stress in fish are another concern, as unusual cage surroundings and environmental conditions can cause distress. For instance, a study revealed that fish stress levels increased by 20% due to noise pollution from passing boats near aquaculture sites.
  • The aquaculture industry anticipates continued growth, with expectations of a 15% increase in production over the next five years. Despite these challenges, cage aquaculture remains a crucial contributor to global seafood supply.

Exclusive Customer Landscape

The aquaculture cages market forecasting report includes the adoption lifecycle of the market, covering from the innovator's stage to the laggard's stage. It focuses on adoption rates in different regions based on penetration. Furthermore, the aquaculture cages market report also includes key purchase criteria and drivers of price sensitivity to help companies evaluate and develop their market growth analysis strategies.
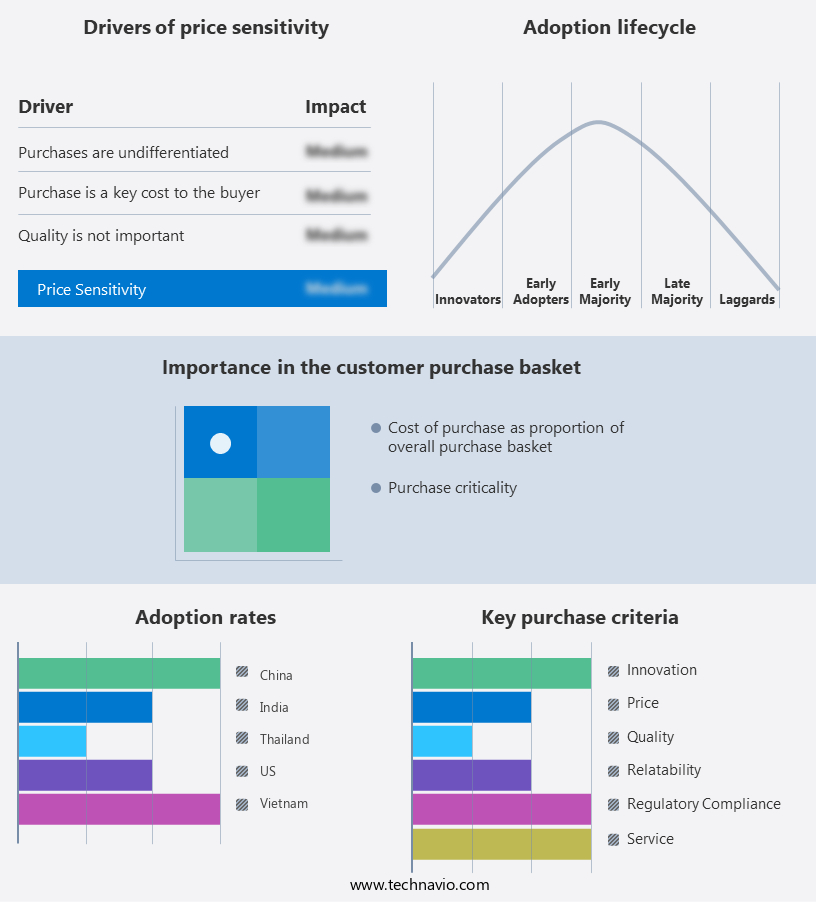
Aquaculture Cages Market Share by Geography

 Customer Landscape

Key Companies & Market Insights

Companies are implementing various strategies, such as strategic alliances, aquaculture cages market forecast, partnerships, mergers and acquisitions, geographical expansion, and product/service launches, to enhance their presence in the industry.

AKVA group - The Norwegian firm specializes in the production of advanced aquaculture cage systems, including the AKVA 500R 10 Winch and AKVA Polarcirkel 500R and 500RS models. 

The industry research and growth report includes detailed analyses of the competitive landscape of the market and information about key companies, including:

  • AKVA group
  • Alfa Laval AB
  • Asakua Su Urunleri Ltd.
  • Badinotti Group SPA
  • China Lesso Group Holdings Ltd.
  • Das and Kumars
  • Gael Force Group Ltd.
  • Garware Technical Fibres Ltd.
  • GiliOcean Technology Ltd.
  • Guang Dong Yangfan Mesh Industry Co. LTD.
  • King Chou Fish Net
  • KJ
  • Linde Plc
  • MSD AQUACULTURE
  • Pioneer Group
  • Qingdao Qihang Fishing Cage Co. Ltd.
  • Selstad AS
  • Serge Ferrari SAS
  • SRR Aqua Suppliers LLP
  • Zhejiang dechen plastic co. ltd.

Qualitative and quantitative analysis of companies has been conducted to help clients understand the wider business environment as well as the strengths and weaknesses of key industry players. Data is qualitatively analyzed to categorize companies as pure play, category-focused, industry-focused, and diversified; it is quantitatively analyzed to categorize companies as dominant, leading, strong, tentative, and weak.

Recent Development and News in Aquaculture Cages Market

  • In January 2024, Norwegian salmon farming company, Mowi, announced a strategic partnership with the Dutch engineering firm, Royal HaskoningDHV, to develop innovative and sustainable aquaculture solutions using advanced cage technology. This collaboration aimed to improve the efficiency and durability of salmon farming cages, reducing the environmental impact of the industry (Mowi press release, 2024).
  • In March 2024, the Chinese government granted approval for the construction of the world's largest offshore aquaculture farm in the South China Sea. The project, led by the Zhejiang Wanghai Aquatic Products Co., Ltd., will consist of 2,000 floating cages and is expected to produce 200,000 metric tons of fish annually (Xinhua News Agency, 2024).
  • In April 2025, the Norwegian company, Cermaq, completed the acquisition of the Canadian aquaculture company, Mainstream Canada, for approximately CAD 1.1 billion. This acquisition expanded Cermaq's presence in the North American market and increased its total biomass production capacity by 60,000 metric tons (Cermaq press release, 2025).
  • In May 2025, the Israeli company, AquaMaof Aquaculture Technologies, launched its new Recirculating Aquaculture System (RAS) technology, AquaBioFlow, designed to optimize fish growth and improve water quality. This innovation utilizes advanced filtration systems and biotechnology to create a controlled environment for fish farming (AquaMaof press release, 2025).

Research Analyst Overview

  • The market for aquaculture cages continues to evolve, driven by advancements in technology and increasing demand for sustainable seafood production. Applications of these cages span various sectors, including freshwater and marine systems, and encompass diverse species such as salmon, tilapia, and shrimp. For instance, cage durability testing and biofouling mitigation strategies are essential to ensure long-term structural integrity and optimal fish growth. Population dynamics, mooring line design, and harvesting efficiency are crucial factors in maximizing biomass and minimizing operational costs. Water quality parameters, fish stocking strategies, and waste management are essential components of responsible aquaculture, while water exchange rate, site suitability, and predator exclusion nets are vital for maintaining fish health and productivity.
  • Economic models, disease diagnostics, and sensor calibration contribute to optimizing production and minimizing risks, while growth performance, disease surveillance, and structural analysis ensure the sustainability and profitability of aquaculture operations. Industry growth is expected to reach 5% annually, with ongoing research and innovation focusing on areas such as mesh strength, coating performance, and impact assessment. For example, a successful implementation of a new biomass assessment technique led to a 15% increase in harvest yields for a major aquaculture company.

Dive into Technavio's robust research methodology, blending expert interviews, extensive data synthesis, and validated models for unparalleled Aquaculture Cages Market insights. See full methodology.

Market Scope

Report Coverage

Details

Page number

170

Base year

2023

Historic period

2017-2022

Forecast period

2024-2028

Growth momentum & CAGR

Accelerate at a CAGR of 6.03%

Market growth 2024-2028

USD 92 million

Market structure

Fragmented

YoY growth 2023-2024(%)

5.7

Key countries

China, India, Vietnam, US, and Thailand

Competitive landscape

Leading Companies, Market Positioning of Companies, Competitive Strategies, and Industry Risks

Request Free Sample

What are the Key Data Covered in this Aquaculture Cages Market Research and Growth Report?

  • CAGR of the Aquaculture Cages industry during the forecast period
  • Detailed information on factors that will drive the growth and forecasting between 2024 and 2028
  • Precise estimation of the size of the market and its contribution of the industry in focus to the parent market
  • Accurate predictions about upcoming growth and trends and changes in consumer behaviour
  • Growth of the market across APAC, North America, Europe, South America, and Middle East and Africa
  • Thorough analysis of the market's competitive landscape and detailed information about companies
  • Comprehensive analysis of factors that will challenge the aquaculture cages market growth of industry companies

We can help! Our analysts can customize this aquaculture cages market research report to meet your requirements.

Get in touch

1 Executive Summary

  • 1.1 Market overview
    • Executive Summary - Chart on Market Overview
    • Executive Summary - Data Table on Market Overview
    • Executive Summary - Chart on Global Market Characteristics
    • Executive Summary - Chart on Market by Geography
    • Executive Summary - Chart on Market Segmentation by Application
    • Executive Summary - Chart on Market Segmentation by Environment
    • Executive Summary - Chart on Incremental Growth
    • Executive Summary - Data Table on Incremental Growth
    • Executive Summary - Chart on Company Market Positioning

2 Market Landscape

  • 2.1 Market ecosystem
    • Parent Market
    • Data Table on - Parent Market
  • 2.2 Market characteristics
    • Market characteristics analysis
  • 2.3 Value chain analysis
    • Value Chain Analysis

3 Market Sizing

  • 3.1 Market definition
    • Offerings of companies included in the market definition
  • 3.2 Market segment analysis
    • Market segments
  • 3.3 Market size 2023
    • 3.4 Market outlook: Forecast for 2023-2028
      • Chart on Global - Market size and forecast 2023-2028 ($ million)
      • Data Table on Global - Market size and forecast 2023-2028 ($ million)
      • Chart on Global Market: Year-over-year growth 2023-2028 (%)
      • Data Table on Global Market: Year-over-year growth 2023-2028 (%)

    4 Historic Market Size

    • 4.1 Global Aquaculture Cages Market 2018 - 2022
      • Historic Market Size - Data Table on Global Aquaculture Cages Market 2018 - 2022 ($ million)
    • 4.2 Application segment analysis 2018 - 2022
      • Historic Market Size - Application Segment 2018 - 2022 ($ million)
    • 4.3 Environment segment analysis 2018 - 2022
      • Historic Market Size - Environment Segment 2018 - 2022 ($ million)
    • 4.4 Geography segment analysis 2018 - 2022
      • Historic Market Size - Geography Segment 2018 - 2022 ($ million)
    • 4.5 Country segment analysis 2018 - 2022
      • Historic Market Size - Country Segment 2018 - 2022 ($ million)

    5 Five Forces Analysis

    • 5.1 Five forces summary
      • Five forces analysis - Comparison between 2023 and 2028
    • 5.2 Bargaining power of buyers
      • Bargaining power of buyers - Impact of key factors 2023 and 2028
    • 5.3 Bargaining power of suppliers
      • Bargaining power of suppliers - Impact of key factors in 2023 and 2028
    • 5.4 Threat of new entrants
      • Threat of new entrants - Impact of key factors in 2023 and 2028
    • 5.5 Threat of substitutes
      • Threat of substitutes - Impact of key factors in 2023 and 2028
    • 5.6 Threat of rivalry
      • Threat of rivalry - Impact of key factors in 2023 and 2028
    • 5.7 Market condition
      • Chart on Market condition - Five forces 2023 and 2028

    6 Market Segmentation by Application

    • 6.1 Market segments
      • Chart on Application - Market share 2023-2028 (%)
      • Data Table on Application - Market share 2023-2028 (%)
    • 6.2 Comparison by Application
      • Chart on Comparison by Application
      • Data Table on Comparison by Application
    • 6.3 Fish - Market size and forecast 2023-2028
      • Chart on Fish - Market size and forecast 2023-2028 ($ million)
      • Data Table on Fish - Market size and forecast 2023-2028 ($ million)
      • Chart on Fish - Year-over-year growth 2023-2028 (%)
      • Data Table on Fish - Year-over-year growth 2023-2028 (%)
    • 6.4 Crustacean - Market size and forecast 2023-2028
      • Chart on Crustacean - Market size and forecast 2023-2028 ($ million)
      • Data Table on Crustacean - Market size and forecast 2023-2028 ($ million)
      • Chart on Crustacean - Year-over-year growth 2023-2028 (%)
      • Data Table on Crustacean - Year-over-year growth 2023-2028 (%)
    • 6.5 Mollusks - Market size and forecast 2023-2028
      • Chart on Mollusks - Market size and forecast 2023-2028 ($ million)
      • Data Table on Mollusks - Market size and forecast 2023-2028 ($ million)
      • Chart on Mollusks - Year-over-year growth 2023-2028 (%)
      • Data Table on Mollusks - Year-over-year growth 2023-2028 (%)
    • 6.6 Others - Market size and forecast 2023-2028
      • Chart on Others - Market size and forecast 2023-2028 ($ million)
      • Data Table on Others - Market size and forecast 2023-2028 ($ million)
      • Chart on Others - Year-over-year growth 2023-2028 (%)
      • Data Table on Others - Year-over-year growth 2023-2028 (%)
    • 6.7 Market opportunity by Application
      • Market opportunity by Application ($ million)
      • Data Table on Market opportunity by Application ($ million)

    7 Market Segmentation by Environment

    • 7.1 Market segments
      • Chart on Environment - Market share 2023-2028 (%)
      • Data Table on Environment - Market share 2023-2028 (%)
    • 7.2 Comparison by Environment
      • Chart on Comparison by Environment
      • Data Table on Comparison by Environment
    • 7.3 Freshwater aquaculture cages - Market size and forecast 2023-2028
      • Chart on Freshwater aquaculture cages - Market size and forecast 2023-2028 ($ million)
      • Data Table on Freshwater aquaculture cages - Market size and forecast 2023-2028 ($ million)
      • Chart on Freshwater aquaculture cages - Year-over-year growth 2023-2028 (%)
      • Data Table on Freshwater aquaculture cages - Year-over-year growth 2023-2028 (%)
    • 7.4 Marine and brackish water aquaculture cages - Market size and forecast 2023-2028
      • Chart on Marine and brackish water aquaculture cages - Market size and forecast 2023-2028 ($ million)
      • Data Table on Marine and brackish water aquaculture cages - Market size and forecast 2023-2028 ($ million)
      • Chart on Marine and brackish water aquaculture cages - Year-over-year growth 2023-2028 (%)
      • Data Table on Marine and brackish water aquaculture cages - Year-over-year growth 2023-2028 (%)
    • 7.5 Market opportunity by Environment
      • Market opportunity by Environment ($ million)
      • Data Table on Market opportunity by Environment ($ million)

    8 Customer Landscape

    • 8.1 Customer landscape overview
      • Analysis of price sensitivity, lifecycle, customer purchase basket, adoption rates, and purchase criteria

    9 Geographic Landscape

    • 9.1 Geographic segmentation
      • Chart on Market share by geography 2023-2028 (%)
      • Data Table on Market share by geography 2023-2028 (%)
    • 9.2 Geographic comparison
      • Chart on Geographic comparison
      • Data Table on Geographic comparison
    • 9.3 APAC - Market size and forecast 2023-2028
      • Chart on APAC - Market size and forecast 2023-2028 ($ million)
      • Data Table on APAC - Market size and forecast 2023-2028 ($ million)
      • Chart on APAC - Year-over-year growth 2023-2028 (%)
      • Data Table on APAC - Year-over-year growth 2023-2028 (%)
    • 9.4 North America - Market size and forecast 2023-2028
      • Chart on North America - Market size and forecast 2023-2028 ($ million)
      • Data Table on North America - Market size and forecast 2023-2028 ($ million)
      • Chart on North America - Year-over-year growth 2023-2028 (%)
      • Data Table on North America - Year-over-year growth 2023-2028 (%)
    • 9.5 Europe - Market size and forecast 2023-2028
      • Chart on Europe - Market size and forecast 2023-2028 ($ million)
      • Data Table on Europe - Market size and forecast 2023-2028 ($ million)
      • Chart on Europe - Year-over-year growth 2023-2028 (%)
      • Data Table on Europe - Year-over-year growth 2023-2028 (%)
    • 9.6 South America - Market size and forecast 2023-2028
      • Chart on South America - Market size and forecast 2023-2028 ($ million)
      • Data Table on South America - Market size and forecast 2023-2028 ($ million)
      • Chart on South America - Year-over-year growth 2023-2028 (%)
      • Data Table on South America - Year-over-year growth 2023-2028 (%)
    • 9.7 Middle East and Africa - Market size and forecast 2023-2028
      • Chart on Middle East and Africa - Market size and forecast 2023-2028 ($ million)
      • Data Table on Middle East and Africa - Market size and forecast 2023-2028 ($ million)
      • Chart on Middle East and Africa - Year-over-year growth 2023-2028 (%)
      • Data Table on Middle East and Africa - Year-over-year growth 2023-2028 (%)
    • 9.8 China - Market size and forecast 2023-2028
      • Chart on China - Market size and forecast 2023-2028 ($ million)
      • Data Table on China - Market size and forecast 2023-2028 ($ million)
      • Chart on China - Year-over-year growth 2023-2028 (%)
      • Data Table on China - Year-over-year growth 2023-2028 (%)
    • 9.9 India - Market size and forecast 2023-2028
      • Chart on India - Market size and forecast 2023-2028 ($ million)
      • Data Table on India - Market size and forecast 2023-2028 ($ million)
      • Chart on India - Year-over-year growth 2023-2028 (%)
      • Data Table on India - Year-over-year growth 2023-2028 (%)
    • 9.10 Vietnam - Market size and forecast 2023-2028
      • Chart on Vietnam - Market size and forecast 2023-2028 ($ million)
      • Data Table on Vietnam - Market size and forecast 2023-2028 ($ million)
      • Chart on Vietnam - Year-over-year growth 2023-2028 (%)
      • Data Table on Vietnam - Year-over-year growth 2023-2028 (%)
    • 9.11 US - Market size and forecast 2023-2028
      • Chart on US - Market size and forecast 2023-2028 ($ million)
      • Data Table on US - Market size and forecast 2023-2028 ($ million)
      • Chart on US - Year-over-year growth 2023-2028 (%)
      • Data Table on US - Year-over-year growth 2023-2028 (%)
    • 9.12 Thailand - Market size and forecast 2023-2028
      • Chart on Thailand - Market size and forecast 2023-2028 ($ million)
      • Data Table on Thailand - Market size and forecast 2023-2028 ($ million)
      • Chart on Thailand - Year-over-year growth 2023-2028 (%)
      • Data Table on Thailand - Year-over-year growth 2023-2028 (%)
    • 9.13 Market opportunity by geography
      • Market opportunity by geography ($ million)
      • Data Tables on Market opportunity by geography ($ million)

    10 Drivers, Challenges, and Opportunity/Restraints

    • 10.1 Market drivers
      • 10.2 Market challenges
        • 10.3 Impact of drivers and challenges
          • Impact of drivers and challenges in 2023 and 2028
        • 10.4 Market opportunities/restraints

          11 Competitive Landscape

          • 11.1 Overview
            • 11.2 Competitive Landscape
              • Overview on criticality of inputs and factors of differentiation
            • 11.3 Landscape disruption
              • Overview on factors of disruption
            • 11.4 Industry risks
              • Impact of key risks on business

            12 Competitive Analysis

            • 12.1 Companies profiled
              • Companies covered
            • 12.2 Market positioning of companies
              • Matrix on companies position and classification
            • 12.3 AKVA group
              • AKVA group - Overview
              • AKVA group - Business segments
              • AKVA group - Key news
              • AKVA group - Key offerings
              • AKVA group - Segment focus
            • 12.4 Asakua Su Urunleri Ltd.
              • Asakua Su Urunleri Ltd. - Overview
              • Asakua Su Urunleri Ltd. - Product / Service
              • Asakua Su Urunleri Ltd. - Key offerings
            • 12.5 Badinotti Group SPA
              • Badinotti Group SPA - Overview
              • Badinotti Group SPA - Product / Service
              • Badinotti Group SPA - Key offerings
            • 12.6 China Lesso Group Holdings Ltd.
              • China Lesso Group Holdings Ltd. - Overview
              • China Lesso Group Holdings Ltd. - Business segments
              • China Lesso Group Holdings Ltd. - Key offerings
              • China Lesso Group Holdings Ltd. - Segment focus
            • 12.7 Das and Kumars
              • Das and Kumars - Overview
              • Das and Kumars - Product / Service
              • Das and Kumars - Key offerings
            • 12.8 Gael Force Group Ltd.
              • Gael Force Group Ltd. - Overview
              • Gael Force Group Ltd. - Product / Service
              • Gael Force Group Ltd. - Key offerings
            • 12.9 Garware Technical Fibres Ltd.
              • Garware Technical Fibres Ltd. - Overview
              • Garware Technical Fibres Ltd. - Business segments
              • Garware Technical Fibres Ltd. - Key offerings
              • Garware Technical Fibres Ltd. - Segment focus
            • 12.10 Guang Dong Yangfan Mesh Industry Co. LTD.
              • Guang Dong Yangfan Mesh Industry Co. LTD. - Overview
              • Guang Dong Yangfan Mesh Industry Co. LTD. - Product / Service
              • Guang Dong Yangfan Mesh Industry Co. LTD. - Key offerings
            • 12.11 Linde Plc
              • Linde Plc - Overview
              • Linde Plc - Business segments
              • Linde Plc - Key news
              • Linde Plc - Key offerings
              • Linde Plc - Segment focus
            • 12.12 MSD AQUACULTURE
              • MSD AQUACULTURE - Overview
              • MSD AQUACULTURE - Product / Service
              • MSD AQUACULTURE - Key offerings
            • 12.13 Pioneer Group
              • Pioneer Group - Overview
              • Pioneer Group - Product / Service
              • Pioneer Group - Key offerings
            • 12.14 Qingdao Qihang Fishing Cage Co. Ltd.
              • Qingdao Qihang Fishing Cage Co. Ltd. - Overview
              • Qingdao Qihang Fishing Cage Co. Ltd. - Product / Service
              • Qingdao Qihang Fishing Cage Co. Ltd. - Key offerings
            • 12.15 Selstad AS
              • Selstad AS - Overview
              • Selstad AS - Product / Service
              • Selstad AS - Key offerings
            • 12.16 Serge Ferrari SAS
              • Serge Ferrari SAS - Overview
              • Serge Ferrari SAS - Product / Service
              • Serge Ferrari SAS - Key offerings
            • 12.17 SRR Aqua Suppliers LLP
              • SRR Aqua Suppliers LLP - Overview
              • SRR Aqua Suppliers LLP - Product / Service
              • SRR Aqua Suppliers LLP - Key offerings

            13 Appendix

            • 13.1 Scope of the report
              • 13.2 Inclusions and exclusions checklist
                • Inclusions checklist
                • Exclusions checklist
              • 13.3 Currency conversion rates for US$
                • Currency conversion rates for US$
              • 13.4 Research methodology
                • Research methodology
              • 13.5 Data procurement
                • Information sources
              • 13.6 Data validation
                • Data validation
              • 13.7 Validation techniques employed for market sizing
                • Validation techniques employed for market sizing
              • 13.8 Data synthesis
                • Data synthesis
              • 13.9 360 degree market analysis
                • 360 degree market analysis
              • 13.10 List of abbreviations
                • List of abbreviations

              Research Methodology

              Technavio presents a detailed picture of the market by way of study, synthesis, and summation of data from multiple sources. The analysts have presented the various facets of the market with a particular focus on identifying the key industry influencers. The data thus presented is comprehensive, reliable, and the result of extensive research, both primary and secondary.

              INFORMATION SOURCES

              Primary sources

              • Manufacturers and suppliers
              • Channel partners
              • Industry experts
              • Strategic decision makers

              Secondary sources

              • Industry journals and periodicals
              • Government data
              • Financial reports of key industry players
              • Historical data
              • Press releases

              DATA ANALYSIS

              Data Synthesis

              • Collation of data
              • Estimation of key figures
              • Analysis of derived insights

              Data Validation

              • Triangulation with data models
              • Reference against proprietary databases
              • Corroboration with industry experts

              REPORT WRITING

              Qualitative

              • Market drivers
              • Market challenges
              • Market trends
              • Five forces analysis

              Quantitative

              • Market size and forecast
              • Market segmentation
              • Geographical insights
              • Competitive landscape

              Interested in this report?

              Get your sample now to see our research methodology and insights!

              Download Now

              Frequently Asked Questions

              Aquaculture Cages market growth will increase by $ 92 mn during 2024-2028 .

              The Aquaculture Cages market is expected to grow at a CAGR of 6.03% during 2024-2028 .

              Aquaculture Cages market is segmented by Application( Fish, Crustacean, Mollusks, Others, Middle East and Africa) Environment( Freshwater aquaculture cages, Marine and brackish water aquaculture cages, brackish water aquaculture cages, South America, Middle East and Africa)

              AKVA group, Alfa Laval AB, Asakua Su Urunleri Ltd., Badinotti Group SPA, China Lesso Group Holdings Ltd., Das and Kumars, Gael Force Group Ltd., Garware Technical Fibres Ltd., GiliOcean Technology Ltd., Guang Dong Yangfan Mesh Industry Co. LTD., King Chou Fish Net, KJ, Linde Plc, MSD AQUACULTURE, Pioneer Group, Qingdao Qihang Fishing Cage Co. Ltd., Selstad AS, Serge Ferrari SAS, SRR Aqua Suppliers LLP, Zhejiang dechen plastic co. ltd. are a few of the key vendors in the Aquaculture Cages market.

              APAC will register the highest growth rate of 78% among the other regions. Therefore, the Aquaculture Cages market in APAC is expected to garner significant business opportunities for the vendors during the forecast period.

              China, India, Vietnam, US, Thailand

              • Rising consumer inclination for nutrient-rich fish and fish productsThe increasing consumption of fish and fish products due to their health benefits drives the demand for fish. Fish is a key source of animal protein. A high number of aquaculture products is the driving factor this market.
              • such as shrimp and salmon is the driving factor this market.
              • which are highly nutritious and good sources of essential proteins is the driving factor this market.
              • vitamins is the driving factor this market.
              • and minerals is the driving factor this market.
              • are obtained through cage aquaculture. Fish provides vitamins A is the driving factor this market.
              • B is the driving factor this market.
              • D is the driving factor this market.
              • and niacin. Fish is also a good source of mineral nutrients such as iron is the driving factor this market.
              • iodine is the driving factor this market.
              • zinc is the driving factor this market.
              • and phosphorous. Fish and fish products are also good sources of omega-3 fatty acids is the driving factor this market.
              • such as eicosapentaenoic acid and docosahexaenoic acid. The human body cannot produce omega-3 fatty acids on its own; it needs to obtain them from external sources is the driving factor this market.
              • fish being one such source. Consumers also prefer food products that have a high nutrient content. The consumption of fish has a significant influence on the human diet. Fish provides essential amino acids that are present in low quantities in vegetable-based diets. Hence is the driving factor this market.
              • the demand for fish and fish products increases is the driving factor this market.
              • thereby driving the need for aquaculture production and is the driving factor this market.
              • subsequently is the driving factor this market.
              • aquaculture cages. This will propel the growth of the market in focus during the forecast period. is the driving factor this market.

              The Aquaculture Cages market vendors should focus on grabbing business opportunities from the Fish segment as it accounted for the largest market share in the base year.