Fresh Fish and Seafood Market Analysis, Size, and Forecast 2024-2028: North America (US and Canada), Europe (France, Germany, Italy, and UK), Middle East and Africa (Egypt, KSA, Oman, and UAE), APAC (China, India, and Japan), South America (Argentina and Brazil), and Rest of World (ROW)

Fresh Fish and Seafood Market Analysis, Size, and Forecast 2024-2028:
North America (US and Canada), Europe (France, Germany, Italy, and UK), Middle East and Africa (Egypt, KSA, Oman, and UAE), APAC (China, India, and Japan), South America (Argentina and Brazil), and Rest of World (ROW)

Published: Feb 2024 161 Pages SKU: IRTNTR70913

Market Overview at a Glance

$65.06 B
Market Opportunity
3.95%
CAGR
3.51
YoY growth 2023-2024(%)

Fresh Fish and Seafood Market Size 2024-2028

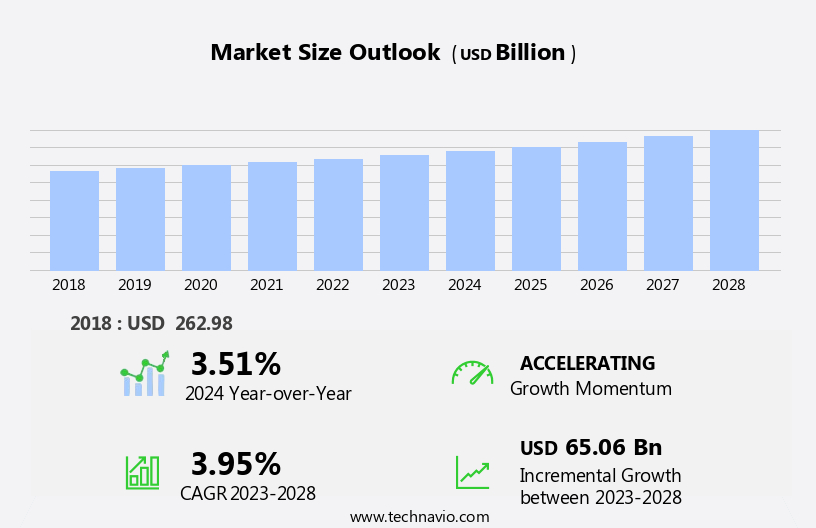
The fresh fish and seafood market size is forecast to increase by USD 65.06 billion, at a CAGR of 3.95% between 2023 and 2028.

  • The market is witnessing significant growth, driven by the increasing awareness of the health benefits associated with seafood consumption. This trend is particularly noticeable among health-conscious consumers, who are seeking to incorporate more nutrient-rich foods into their diets. Another key driver in the market is the rising demand for premiumization of seafood. Seafood is rich in essential nutrients such as protein, omega-3 fatty acids, and vitamins, making it a preferred choice for health-conscious consumers. Consumers are willing to pay a premium for high-quality, sustainably sourced seafood, creating opportunities for suppliers and retailers to differentiate themselves through product offerings and value-added services. However, the market also faces challenges. Stringent government regulations and guidelines, aimed at ensuring the safety and sustainability of seafood production, can increase operational costs and complexify supply chains.
  • Additionally, the impact of climate change on fish stocks and fishing practices can create supply disruptions and price volatility. Companies seeking to capitalize on market opportunities and navigate these challenges effectively must stay informed of regulatory developments, invest in sustainable sourcing and production practices, and build resilient supply chains. By doing so, they can meet the growing demand for premium seafood while maintaining compliance with regulatory requirements and mitigating risks.

What will be the Size of the Fresh Fish and Seafood Market during the forecast period?

Fresh Fish and Seafood Market Size

Explore in-depth regional segment analysis with market size data - historical 2018-2022 and forecasts 2024-2028 - in the full report.  
Request Free Sample

The market continues to evolve, driven by dynamic market forces and shifting consumer preferences. Value-added seafood products, such as smoked or marinated offerings, are gaining traction as consumers seek more convenient and flavorful options. Fish handling techniques are advancing, with a focus on maintaining fish health and ensuring seafood quality. Aquaculture disease management and water quality are critical concerns for farmers, while fish processing byproducts and waste utilization are being explored for sustainable applications. Responsible aquaculture practices are increasingly important, with a focus on reducing environmental impact and improving animal welfare. Seafood preservation methods are evolving to extend shelf life and maintain product freshness.

Seafood market segmentation is becoming more nuanced, with differentiated offerings catering to various consumer demographics and preferences. Seafood packaging innovations are transforming the industry, with a focus on extending shelf life, enhancing product presentation, and improving sustainability. Consumer seafood preferences are shifting towards more sustainable and ethically sourced options, driving demand for traceability systems and certifications. Seafood sensory evaluation and safety regulations are essential for ensuring product quality and consumer safety. Fish farming automation and processing technology are advancing, with a focus on increasing efficiency and reducing waste. The ongoing unfolding of market activities and evolving patterns underscores the importance of continuous innovation and adaptation in the fresh fish and seafood industry.

How is this Fresh Fish and Seafood Industry segmented?

The fresh fish and seafood industry research report provides comprehensive data (region-wise segment analysis), with forecasts and estimates in "USD billion" for the period 2024-2028, as well as historical data from 2018-2022 for the following segments.

  • Type
    • Fresh fish
    • Crustaceans
    • Mollusks
  • Distribution Channel
    • Offline
    • Online
  • Source
    • Wild-Caught
    • Aquaculture
  • Form
    • Whole
    • Filleted
    • Fresh Prepared
  • Geography
    • North America
      • US
      • Canada
    • Europe
      • France
      • Germany
      • Italy
      • UK
    • Middle East and Africa
      • Egypt
      • KSA
      • Oman
      • UAE
    • APAC
      • China
      • India
      • Japan
    • South America
      • Argentina
      • Brazil
    • Rest of World (ROW)

By Type Insights

The fresh fish segment is estimated to witness significant growth during the forecast period.

The market is witnessing significant growth due to the increasing adoption of fresh fish as a healthy protein source. With people becoming more health-conscious and aware of the nutritional benefits of fish, such as omega-3 fatty acids and vitamins D and B2 (riboflavin), the demand for fresh fish is surging. These essential nutrients contribute to heart and brain health, making fish a preferred choice for consumers. Sustainable fisheries management practices ensure a steady supply of fresh fish while minimizing the impact on marine ecosystems. Value-added seafood products, such as smoked or marinated fish, cater to evolving consumer preferences.

Aquaculture, with responsible practices and disease management, is a key contributor to the market's growth. Seafood preservation methods, like freezing and canning, extend the shelf life and accessibility of fish. Seafood market segmentation based on consumer demographics, geography, and product types continues to evolve. Innovations in seafood packaging, such as vacuum-sealed and modified atmosphere packaging, maintain the freshness and quality of the product. Fish handling techniques and fish farming automation improve the efficiency and safety of the production process. Fish health monitoring and quality control are crucial aspects of ensuring a consistent and safe product. By-products from fish processing are utilized for various applications, including fish meal and fish oil.

Aquaculture farming practices, including feed efficiency and water quality management, are essential for sustainable growth. Seafood product traceability systems and sensory evaluation ensure transparency and trust in the market. Regulations and certifications, such as those for seafood safety and wild-caught seafood, provide consumers with peace of mind. The seafood retail and distribution networks continue to adapt to changing consumer demands and preferences. Bycatch reduction strategies and sustainable seafood sourcing are crucial for the long-term sustainability of the industry.

Fresh Fish and Seafood Market Size

Request Free Sample

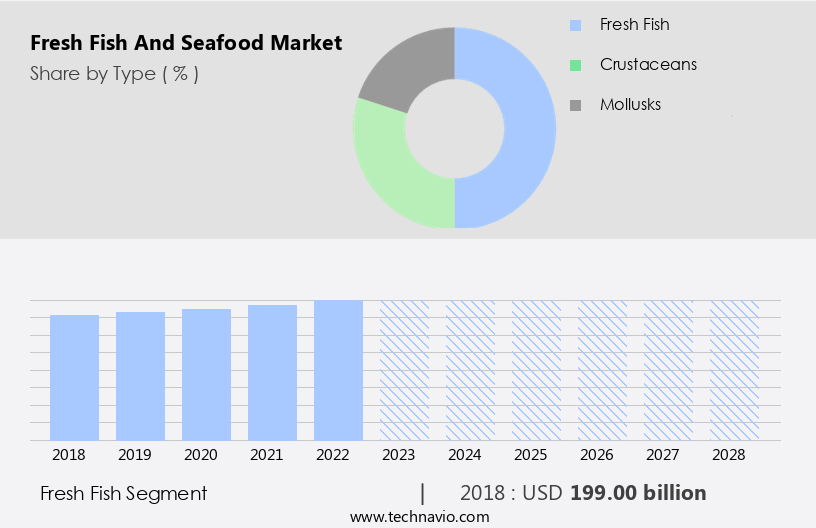
The Fresh fish segment was valued at USD 199.00 billion in 2018 and showed a gradual increase during the forecast period.

Regional Analysis

APAC is estimated to contribute 50% to the growth of the global market during the forecast period.Technavio's analysts have elaborately explained the regional trends and drivers that shape the market during the forecast period.

Fresh Fish and Seafood Market Share by Geography

 Request Free Sample

In the Asia Pacific (APAC) region, which is the world's largest producer of fresh fish and seafood, China holds the leading position as both the largest producer and consumer of fishery products, accounting for approximately 45% of the global seafood volume. The growing young, sophisticated, and affluent population base in APAC countries, particularly in China, Japan, South Korea, Taiwan, India, and Southeast Asian nations, is driving the demand for a wide variety of fresh fish and seafood. Key species in high demand include fresh shrimp and prawns, as well as fresh skipjack and stripe-bellied bonito tuna fillets in Japan. Aquaculture, responsible farming practices, and sustainable fisheries management are essential to meeting the increasing demand for seafood in APAC.

Aquaculture disease management and water quality are crucial to maintaining healthy fish stocks. Seafood preservation methods, such as freezing and canning, ensure product freshness and longevity. Innovations in seafood packaging and traceability systems help maintain product quality and consumer confidence. Seafood safety regulations and fish farming automation are essential to ensuring a consistent supply of high-quality seafood. Fish processing technology and byproduct utilization contribute to increased efficiency and reduced waste. Consumer preferences for specific seafood species and sensory evaluation play a significant role in market segmentation. Traceability systems and certification programs, such as those for wild-caught seafood and sustainable seafood sourcing, are essential to meeting consumer demands for transparency and accountability.

Market dynamics in APAC are shaped by various factors, including ocean fishing regulations, bycatch reduction strategies, and sustainable seafood sourcing. Aquaculture feed efficiency and responsible practices are critical to ensuring the long-term sustainability of the industry. Seafood retail management and distribution networks play a vital role in getting products to consumers efficiently and effectively.

Market Dynamics

The Global Fresh Fish and Seafood Market is thriving, driven by ever-evolving fresh fish market trends and growing consumer awareness. The demand for both fresh fish and fresh seafood continues to surge, with a particular emphasis on sustainable fresh fish options as consumers prioritize ethical sourcing. Efficient seafood cold chain logistics are paramount to maintaining quality from catch to plate, supporting rising consumer preferences fresh seafood. The market is also being significantly shaped by e-commerce fresh seafood platforms, offering convenient access to premium options like organic fresh seafood. Advances in aquaculture technologies are playing a crucial role in meeting this demand sustainably. Furthermore, the widely recognized health benefits of fresh fish, including omega-3 rich varieties like fresh salmon and fresh shrimp, are key market drivers. Innovations in seafood traceability technology are building consumer trust. The overall Global fresh fish and seafood market size reflects strong rising demand for fresh seafood, fueling new product development seafood and robust retail sales fresh seafood.

Our researchers analyzed the data with 2023 as the base year, along with the key drivers, trends, and challenges. A holistic analysis of drivers will help companies refine their marketing strategies to gain a competitive advantage.

What are the key market drivers leading to the rise in the adoption of Fresh Fish and Seafood Industry?

  • The significant rise in public understanding of the nutritional advantages associated with seafood consumption serves as the primary catalyst for market growth. 
  • The global fishmeal and fish oil market is experiencing steady growth, with production forecasted to reach 5.8 Mt for fishmeal and 1.2 Mt for fish oil by 2030. This expansion is driven by sustainable fisheries management and the increasing demand for value-added seafood products. However, the growth rate has decelerated compared to the previous decade, with an annual increase of only 0.9% for fishmeal and 0.8% for fish oil. Fish handling techniques and aquaculture disease management are crucial aspects of the industry, ensuring the preservation of seafood quality and consumer safety. Responsible aquaculture practices are increasingly important, as they contribute to the sustainability of the industry and mitigate environmental concerns.
  • Despite the growth in fishmeal and fish oil production, global food fish consumption is projected to grow at a slower pace, with an annual increase of only 1.3%. Factors contributing to this trend include population growth slowing down, lower meat prices, particularly for poultry, and decreased incomes at the beginning of the decade. Market segmentation plays a significant role in the seafood industry, with various factors influencing consumer preferences and demand. Understanding these trends and implementing effective strategies can help businesses remain competitive and thrive in this dynamic market.

What are the market trends shaping the Fresh Fish and Seafood Industry?

  • The trend in the seafood market is shifting towards an increased demand for premium quality offerings. This developing market trend underscores the growing consumer preference for higher-end seafood products.
  • The market is experiencing significant growth due to increasing consumer preferences for high-quality, unique seafood offerings. Premiumization is a key trend, with consumers willing to pay more for products perceived as superior in freshness, flavor, and sustainability. This trend encompasses demand for premium cuts, exotic species, and seafood with specific certifications. Seafood packaging innovations play a crucial role in maintaining the freshness and quality of these products. Fish traceability systems ensure transparency and authenticity, while seafood sensory evaluation helps maintain consistent quality.
  • Seafood safety regulations are stringent, and fish farming automation and fish processing technology are essential for meeting these standards. Ocean Beauty Seafoods LLC, a leading seafood distributor, exemplifies this trend. They source and distribute high-quality seafood from various global locations, focusing on transparency and sustainability. Their offerings include wild-caught Alaskan salmon and other premium selections, reflecting the market's shift towards superior seafood experiences.

What challenges does the Fresh Fish and Seafood Industry face during its growth?

  • The stringent government regulations and guidelines pose a significant challenge to the industry's growth, requiring businesses to adhere to rigorous compliance standards. 
  • In The market, companies face rigorous regulations from authorities such as the European Union and the US Food and Drug Administration (FDA), requiring strict adherence to permits, entry regulations, and product expiry dates. For instance, fresh fish should be consumed within 36 hours of purchase and stored in a refrigerator. Compliance with these rules can be challenging for new market entrants. To ensure seafood product quality, companies prioritize fish health monitoring, seafood quality control, and fish processing byproducts utilization. Aquaculture farming practices are also crucial in maintaining fish health and reducing waste. Furthermore, fish waste can be effectively utilized as a resource, contributing to sustainable practices in the industry.
  • Seafood product traceability is essential to build consumer trust and confidence. companies invest in advanced technologies, such as blockchain, to provide transparent information about the origin, production, and distribution of their seafood products. By focusing on these areas, companies can differentiate themselves in the competitive market and meet the evolving demands of consumers.

Exclusive Customer Landscape

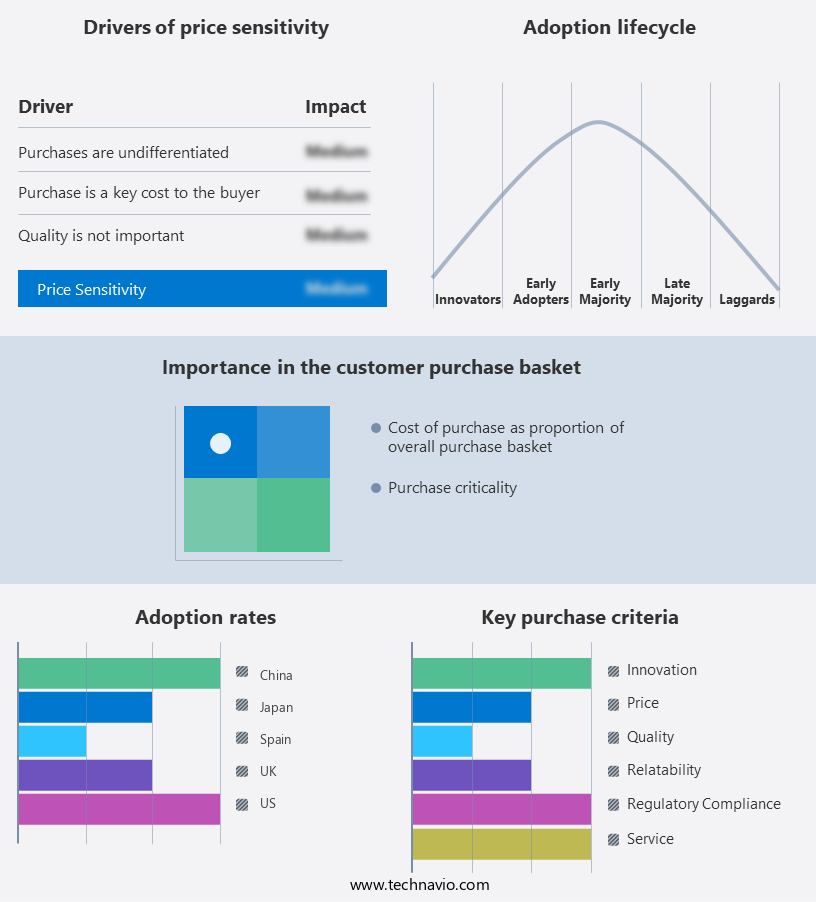
The fresh fish and seafood market forecasting report includes the adoption lifecycle of the market, covering from the innovator's stage to the laggard's stage. It focuses on adoption rates in different regions based on penetration. Furthermore, the fresh fish and seafood market report also includes key purchase criteria and drivers of price sensitivity to help companies evaluate and develop their market growth analysis strategies.

Fresh Fish and Seafood Market Share by Geography

 Customer Landscape

Key Companies & Market Insights

Companies are implementing various strategies, such as strategic alliances, fresh fish and seafood market forecast, partnerships, mergers and acquisitions, geographical expansion, and product/service launches, to enhance their presence in the industry.

All Seas Wholesale Inc. - This company specializes in providing a diverse selection of fresh fish and seafood, including salmon, halibut, rockfish, seallops, live crab, lobster, and oysters. Their offerings cater to various consumer preferences and culinary applications. The seafood is sourced responsibly, ensuring the highest quality and sustainability.

The industry research and growth report includes detailed analyses of the competitive landscape of the market and information about key companies, including:

  • All Seas Wholesale Inc.
  • Austevoll Seafood ASA
  • Charoen Pokphand Foods PCL
  • Clearwater Seafoods Inc.
  • Cooke Aquaculture Inc.
  • Grieg Seafood ASA
  • Lee Fish
  • Lee Fishing Co.
  • Loch Duart Ltd.
  • Marubeni Corp.
  • Maruha Nichiro Corp.
  • Meade Digital Enterprises Corp.
  • Nissui Corp.
  • Ocean Beauty Seafoods LLC
  • Ocean Fresh Seafood
  • Pescafresh
  • Surapon Foods Public Co. Ltd.
  • Trident Seafoods Corp.
  • Tropic Star Seafood Inc.
  • True World Foods LLC
  • Wm Morrison Supermarkets Ltd.

Qualitative and quantitative analysis of companies has been conducted to help clients understand the wider business environment as well as the strengths and weaknesses of key industry players. Data is qualitatively analyzed to categorize companies as pure play, category-focused, industry-focused, and diversified; it is quantitatively analyzed to categorize companies as dominant, leading, strong, tentative, and weak.

Recent Development and News in Fresh Fish And Seafood Market

  • In January 2024, Marine Harvest, a leading global seafood company, announced the launch of its new sustainable salmon farming project in Chile, investing USD 500 million to expand its production capacity by 60,000 metric tons annually (Marine Harvest Press Release, 2024).
  • In March 2024, Thai Union Group, the world's largest seafood processor, entered into a strategic partnership with BlueBite, a US-based technology company, to implement RFID technology in their supply chain, enhancing traceability and sustainability (Thai Union Press Release, 2024).
  • In May 2024, the European Union approved the Merger of Two Seas, a leading European fish processing company, and Nordic Fish, significantly expanding their market share in the European fresh fish market (European Commission Press Release, 2024).
  • In February 2025, the Chinese government announced a new policy to encourage the development of aquaculture and fishery industries, investing USD 15 billion in the sector and aiming to increase production by 15% by 2027 (Xinhua News Agency, 2025).

Research Analyst Overview

  • The market experiences continuous fluctuations in price due to various factors, including microbial contamination, consumer behavior, and seafood fraud detection. Catch monitoring technology and fish farming economics play significant roles in mitigating price volatility, while aquaculture genetic improvement and production methods contribute to increased supply. Fish freshness indicators, seafood allergen control, and sensory attributes are crucial for maintaining consumer trust. Aquaculture environmental impact, logistics optimization, and inventory management are essential for reducing waste and ensuring efficient operations. Fish farming sustainability, storage temperature, and pest control are key concerns for producers, while seafood labeling accuracy and e-commerce platforms facilitate transparency and convenience for businesses.
  • Fish species identification and nutritional composition are vital for product differentiation and catering to diverse consumer preferences. Seafood spoilage mechanisms and waste treatment are ongoing challenges for the industry, necessitating ongoing research and innovation.

Dive into Technavio's robust research methodology, blending expert interviews, extensive data synthesis, and validated models for unparalleled Fresh Fish and Seafood Market insights. See full methodology.

Market Scope

Report Coverage

Details

Page number

161

Base year

2023

Historic period

2018-2022

Forecast period

2024-2028

Growth momentum & CAGR

Accelerate at a CAGR of 3.95%

Market growth 2024-2028

USD 65.06 billion

Market structure

Fragmented

YoY growth 2023-2024(%)

3.51

Key countries

US, Canada, Germany, UK, Italy, France, China, India, Japan, Brazil, Egypt, UAE, Oman, Argentina, KSA, UAE, Brazil, and Rest of World (ROW)

Competitive landscape

Leading Companies, Market Positioning of Companies, Competitive Strategies, and Industry Risks

Request Free Sample

What are the Key Data Covered in this Fresh Fish and Seafood Market Research and Growth Report?

  • CAGR of the Fresh Fish and Seafood industry during the forecast period
  • Detailed information on factors that will drive the growth and forecasting between 2024 and 2028
  • Precise estimation of the size of the market and its contribution of the industry in focus to the parent market
  • Accurate predictions about upcoming growth and trends and changes in consumer behaviour
  • Growth of the market across APAC, Europe, North America, South America, and Middle East and Africa
  • Thorough analysis of the market's competitive landscape and detailed information about companies
  • Comprehensive analysis of factors that will challenge the fresh fish and seafood market growth of industry companies

We can help! Our analysts can customize this fresh fish and seafood market research report to meet your requirements.

Get in touch

1 Executive Summary

  • 1.1 Market overview
    • Exhibit 01: Executive Summary – Chart on Market Overview
    • Exhibit 02: Executive Summary – Data Table on Market Overview
    • Exhibit 03: Executive Summary – Chart on Global Market Characteristics
    • Exhibit 04: Executive Summary – Chart on Market by Geography
    • Exhibit 05: Executive Summary – Chart on Market Segmentation by Type
    • Exhibit 06: Executive Summary – Chart on Market Segmentation by Distribution Channel
    • Exhibit 07: Executive Summary – Chart on Incremental Growth
    • Exhibit 08: Executive Summary – Data Table on Incremental Growth
    • Exhibit 09: Executive Summary – Chart on Vendor Market Positioning

2 Market Landscape

  • 2.1 Market ecosystem
    • Exhibit 10: Parent market
    • Exhibit 11: Market Characteristics

3 Market Sizing

  • 3.1 Market definition
    • Exhibit 12: Offerings of vendors included in the market definition
  • 3.2 Market segment analysis
    • Exhibit 13: Market segments
  • 3.3 Market size 2023
    • 3.4 Market outlook: Forecast for 2023-2028
      • Exhibit 14: Chart on Global - Market size and forecast 2023-2028 ($ billion)
      • Exhibit 15: Data Table on Global - Market size and forecast 2023-2028 ($ billion)
      • Exhibit 16: Chart on Global Market: Year-over-year growth 2023-2028 (%)
      • Exhibit 17: Data Table on Global Market: Year-over-year growth 2023-2028 (%)

    4 Historic Market Size

    • 4.1 Global fresh fish and seafood market 2018 - 2022
      • Exhibit 18: Historic Market Size – Data Table on global fresh fish and seafood market 2018 - 2022 ($ billion)
    • 4.2 Type Segment Analysis 2018 - 2022
      • Exhibit 19: Historic Market Size – Type Segment 2018 - 2022 ($ billion)
    • 4.3 Distribution Channel Segment Analysis 2018 - 2022
      • Exhibit 20: Historic Market Size – Distribution Channel Segment 2018 - 2022 ($ billion)
    • 4.4 Geography Segment Analysis 2018 - 2022
      • Exhibit 21: Historic Market Size – Geography Segment 2018 - 2022 ($ billion)
    • 4.5 Country Segment Analysis 2018 - 2022
      • Exhibit 22: Historic Market Size – Country Segment 2018 - 2022 ($ billion)

    5 Five Forces Analysis

    • 5.1 Five forces summary
      • Exhibit 23: Five forces analysis - Comparison between 2023 and 2028
    • 5.2 Bargaining power of buyers
      • Exhibit 24: Chart on Bargaining power of buyers – Impact of key factors 2023 and 2028
    • 5.3 Bargaining power of suppliers
      • Exhibit 25: Bargaining power of suppliers – Impact of key factors in 2023 and 2028
    • 5.4 Threat of new entrants
      • Exhibit 26: Threat of new entrants – Impact of key factors in 2023 and 2028
    • 5.5 Threat of substitutes
      • Exhibit 27: Threat of substitutes – Impact of key factors in 2023 and 2028
    • 5.6 Threat of rivalry
      • Exhibit 28: Threat of rivalry – Impact of key factors in 2023 and 2028
    • 5.7 Market condition
      • Exhibit 29: Chart on Market condition - Five forces 2023 and 2028

    6 Market Segmentation by Type

    • 6.1 Market segments
      • Chart on Type - Market share (2023-2028) (%)
      • Data Table on Type - Market share (2023-2028) (%)
    • 6.2 Comparison by Type
      • Chart on Comparison by Type
      • Data Table on Comparison by Type
    • 6.3 Fresh fish - Market size and forecast (2023-2028)
      • Chart on Fresh fish - Market size and forecast (2023-2028) ($ billion)
      • Data Table on Fresh fish - Market size and forecast (2023-2028) ($ billion)
      • Chart on Fresh fish - Year-over-year growth (2023-2028) (%)
      • Data Table on Fresh fish - Year-over-year growth (2023-2028) (%)
    • 6.4 Crustaceans - Market size and forecast (2023-2028)
      • Chart on Crustaceans - Market size and forecast (2023-2028) ($ billion)
      • Data Table on Crustaceans - Market size and forecast (2023-2028) ($ billion)
      • Chart on Crustaceans - Year-over-year growth (2023-2028) (%)
      • Data Table on Crustaceans - Year-over-year growth (2023-2028) (%)
    • 6.5 Mollusks - Market size and forecast (2023-2028)
      • Chart on Mollusks - Market size and forecast (2023-2028) ($ billion)
      • Data Table on Mollusks - Market size and forecast (2023-2028) ($ billion)
      • Chart on Mollusks - Year-over-year growth (2023-2028) (%)
      • Data Table on Mollusks - Year-over-year growth (2023-2028) (%)
    • 6.6 Market opportunity by Type
      • Market opportunity by Type ($ billion)
      • Data Table on Market opportunity by Type ($ billion)

    7 Market Segmentation by Distribution Channel

    • 7.1 Market segments
      • Chart on Distribution Channel - Market share (2023-2028) (%)
      • Data Table on Distribution Channel - Market share (2023-2028) (%)
    • 7.2 Comparison by Distribution Channel
      • Chart on Comparison by Distribution Channel
      • Data Table on Comparison by Distribution Channel
    • 7.3 Offline - Market size and forecast (2023-2028)
      • Chart on Offline - Market size and forecast (2023-2028) ($ billion)
      • Data Table on Offline - Market size and forecast (2023-2028) ($ billion)
      • Chart on Offline - Year-over-year growth (2023-2028) (%)
      • Data Table on Offline - Year-over-year growth (2023-2028) (%)
    • 7.4 Online - Market size and forecast (2023-2028)
      • Chart on Online - Market size and forecast (2023-2028) ($ billion)
      • Data Table on Online - Market size and forecast (2023-2028) ($ billion)
      • Chart on Online - Year-over-year growth (2023-2028) (%)
      • Data Table on Online - Year-over-year growth (2023-2028) (%)
    • 7.5 Market opportunity by Distribution Channel
      • Market opportunity by Distribution Channel ($ billion)
      • Data Table on Market opportunity by Distribution Channel ($ billion)

    8 Market Segmentation by Source

    • 8.1 Market segments
      • Chart on Source - Market share (2023-2028) (%)
      • Data Table on Source - Market share (2023-2028) (%)
    • 8.2 Comparison by Source
      • Chart on Comparison by Source
      • Data Table on Comparison by Source
    • 8.3 Wild-Caught - Market size and forecast (2023-2028)
      • Chart on Wild-Caught - Market size and forecast (2023-2028) ($ billion)
      • Data Table on Wild-Caught - Market size and forecast (2023-2028) ($ billion)
      • Chart on Wild-Caught - Year-over-year growth (2023-2028) (%)
      • Data Table on Wild-Caught - Year-over-year growth (2023-2028) (%)
    • 8.4 Aquaculture - Market size and forecast (2023-2028)
      • Chart on Aquaculture - Market size and forecast (2023-2028) ($ billion)
      • Data Table on Aquaculture - Market size and forecast (2023-2028) ($ billion)
      • Chart on Aquaculture - Year-over-year growth (2023-2028) (%)
      • Data Table on Aquaculture - Year-over-year growth (2023-2028) (%)
    • 8.5 Market opportunity by Source
      • Market opportunity by Source ($ billion)
      • Data Table on Market opportunity by Source ($ billion)

    9 Market Segmentation by Form

    • 9.1 Market segments
      • Chart on Form - Market share (2023-2028) (%)
      • Data Table on Form - Market share (2023-2028) (%)
    • 9.2 Comparison by Form
      • Chart on Comparison by Form
      • Data Table on Comparison by Form
    • 9.3 Whole - Market size and forecast (2023-2028)
      • Chart on Whole - Market size and forecast (2023-2028) ($ billion)
      • Data Table on Whole - Market size and forecast (2023-2028) ($ billion)
      • Chart on Whole - Year-over-year growth (2023-2028) (%)
      • Data Table on Whole - Year-over-year growth (2023-2028) (%)
    • 9.4 Filleted - Market size and forecast (2023-2028)
      • Chart on Filleted - Market size and forecast (2023-2028) ($ billion)
      • Data Table on Filleted - Market size and forecast (2023-2028) ($ billion)
      • Chart on Filleted - Year-over-year growth (2023-2028) (%)
      • Data Table on Filleted - Year-over-year growth (2023-2028) (%)
    • 9.5 Fresh Prepared - Market size and forecast (2023-2028)
      • Chart on Fresh Prepared - Market size and forecast (2023-2028) ($ billion)
      • Data Table on Fresh Prepared - Market size and forecast (2023-2028) ($ billion)
      • Chart on Fresh Prepared - Year-over-year growth (2023-2028) (%)
      • Data Table on Fresh Prepared - Year-over-year growth (2023-2028) (%)
    • 9.6 Market opportunity by Form
      • Market opportunity by Form ($ billion)
      • Data Table on Market opportunity by Form ($ billion)

    8 Customer Landscape

    • 8.1 Customer landscape overview
      • Exhibit 62: Analysis of price sensitivity, lifecycle, customer purchase basket, adoption rates, and purchase criteria

    9 Geographic Landscape

    • 9.1 Geographic segmentation
      • Exhibit 63: Chart on Market share by geography 2023-2028 (%)
      • Exhibit 64: Data Table on Market share by geography 2023-2028 (%)
    • 9.2 Geographic comparison
      • Exhibit 65: Chart on Geographic comparison
      • Exhibit 66: Data Table on Geographic comparison
    • 9.3 APAC - Market size and forecast 2023-2028
      • Exhibit 67: Chart on APAC - Market size and forecast 2023-2028 ($ billion)
      • Exhibit 68: Data Table on APAC - Market size and forecast 2023-2028 ($ billion)
      • Exhibit 69: Chart on APAC - Year-over-year growth 2023-2028 (%)
      • Exhibit 70: Data Table on APAC - Year-over-year growth 2023-2028 (%)
    • 9.4 Europe - Market size and forecast 2023-2028
      • Exhibit 71: Chart on Europe - Market size and forecast 2023-2028 ($ billion)
      • Exhibit 72: Data Table on Europe - Market size and forecast 2023-2028 ($ billion)
      • Exhibit 73: Chart on Europe - Year-over-year growth 2023-2028 (%)
      • Exhibit 74: Data Table on Europe - Year-over-year growth 2023-2028 (%)
    • 9.5 North America - Market size and forecast 2023-2028
      • Exhibit 75: Chart on North America - Market size and forecast 2023-2028 ($ billion)
      • Exhibit 76: Data Table on North America - Market size and forecast 2023-2028 ($ billion)
      • Exhibit 77: Chart on North America - Year-over-year growth 2023-2028 (%)
      • Exhibit 78: Data Table on North America - Year-over-year growth 2023-2028 (%)
    • 9.6 South America - Market size and forecast 2023-2028
      • Exhibit 79: Chart on South America - Market size and forecast 2023-2028 ($ billion)
      • Exhibit 80: Data Table on South America - Market size and forecast 2023-2028 ($ billion)
      • Exhibit 81: Chart on South America - Year-over-year growth 2023-2028 (%)
      • Exhibit 82: Data Table on South America - Year-over-year growth 2023-2028 (%)
    • 9.7 Middle East and Africa - Market size and forecast 2023-2028
      • Exhibit 83: Chart on Middle East and Africa - Market size and forecast 2023-2028 ($ billion)
      • Exhibit 84: Data Table on Middle East and Africa - Market size and forecast 2023-2028 ($ billion)
      • Exhibit 85: Chart on Middle East and Africa - Year-over-year growth 2023-2028 (%)
      • Exhibit 86: Data Table on Middle East and Africa - Year-over-year growth 2023-2028 (%)
    • 9.8 China - Market size and forecast 2023-2028
      • Exhibit 87: Chart on China - Market size and forecast 2023-2028 ($ billion)
      • Exhibit 88: Data Table on China - Market size and forecast 2023-2028 ($ billion)
      • Exhibit 89: Chart on China - Year-over-year growth 2023-2028 (%)
      • Exhibit 90: Data Table on China - Year-over-year growth 2023-2028 (%)
    • 9.9 Japan - Market size and forecast 2023-2028
      • Exhibit 91: Chart on Japan - Market size and forecast 2023-2028 ($ billion)
      • Exhibit 92: Data Table on Japan - Market size and forecast 2023-2028 ($ billion)
      • Exhibit 93: Chart on Japan - Year-over-year growth 2023-2028 (%)
      • Exhibit 94: Data Table on Japan - Year-over-year growth 2023-2028 (%)
    • 9.10 Spain - Market size and forecast 2023-2028
      • Exhibit 95: Chart on Spain - Market size and forecast 2023-2028 ($ billion)
      • Exhibit 96: Data Table on Spain - Market size and forecast 2023-2028 ($ billion)
      • Exhibit 97: Chart on Spain - Year-over-year growth 2023-2028 (%)
      • Exhibit 98: Data Table on Spain - Year-over-year growth 2023-2028 (%)
    • 9.11 UK - Market size and forecast 2023-2028
      • Exhibit 99: Chart on UK - Market size and forecast 2023-2028 ($ billion)
      • Exhibit 100: Data Table on UK - Market size and forecast 2023-2028 ($ billion)
      • Exhibit 101: Chart on UK - Year-over-year growth 2023-2028 (%)
      • Exhibit 102: Data Table on UK - Year-over-year growth 2023-2028 (%)
    • 9.12 US - Market size and forecast 2023-2028
      • Exhibit 103: Chart on US - Market size and forecast 2023-2028 ($ billion)
      • Exhibit 104: Data Table on US - Market size and forecast 2023-2028 ($ billion)
      • Exhibit 105: Chart on US - Year-over-year growth 2023-2028 (%)
      • Exhibit 106: Data Table on US - Year-over-year growth 2023-2028 (%)
    • 9.13 Market opportunity by geography
      • Exhibit 107: Market opportunity by geography ($ billion)
      • Exhibit 108: Data Tables on Market opportunity by geography ($ billion)
    • 11.14 Canada - Market size and forecast (2023-2028)
      • Chart on Canada - Market size and forecast (2023-2028) ($ billion)
      • Data Table on Canada - Market size and forecast (2023-2028) ($ billion)
      • Chart on Canada - Year-over-year growth (2023-2028) (%)
      • Data Table on Canada - Year-over-year growth (2023-2028) (%)
    • 11.15 Germany - Market size and forecast (2023-2028)
      • Chart on Germany - Market size and forecast (2023-2028) ($ billion)
      • Data Table on Germany - Market size and forecast (2023-2028) ($ billion)
      • Chart on Germany - Year-over-year growth (2023-2028) (%)
      • Data Table on Germany - Year-over-year growth (2023-2028) (%)
    • 11.16 Italy - Market size and forecast (2023-2028)
      • Chart on Italy - Market size and forecast (2023-2028) ($ billion)
      • Data Table on Italy - Market size and forecast (2023-2028) ($ billion)
      • Chart on Italy - Year-over-year growth (2023-2028) (%)
      • Data Table on Italy - Year-over-year growth (2023-2028) (%)
    • 11.17 France - Market size and forecast (2023-2028)
      • Chart on France - Market size and forecast (2023-2028) ($ billion)
      • Data Table on France - Market size and forecast (2023-2028) ($ billion)
      • Chart on France - Year-over-year growth (2023-2028) (%)
      • Data Table on France - Year-over-year growth (2023-2028) (%)
    • 11.18 India - Market size and forecast (2023-2028)
      • Chart on India - Market size and forecast (2023-2028) ($ billion)
      • Data Table on India - Market size and forecast (2023-2028) ($ billion)
      • Chart on India - Year-over-year growth (2023-2028) (%)
      • Data Table on India - Year-over-year growth (2023-2028) (%)
    • 11.19 Brazil - Market size and forecast (2023-2028)
      • Chart on Brazil - Market size and forecast (2023-2028) ($ billion)
      • Data Table on Brazil - Market size and forecast (2023-2028) ($ billion)
      • Chart on Brazil - Year-over-year growth (2023-2028) (%)
      • Data Table on Brazil - Year-over-year growth (2023-2028) (%)
    • 11.20 Egypt - Market size and forecast (2023-2028)
      • Chart on Egypt - Market size and forecast (2023-2028) ($ billion)
      • Data Table on Egypt - Market size and forecast (2023-2028) ($ billion)
      • Chart on Egypt - Year-over-year growth (2023-2028) (%)
      • Data Table on Egypt - Year-over-year growth (2023-2028) (%)
    • 11.21 UAE - Market size and forecast (2023-2028)
      • Chart on UAE - Market size and forecast (2023-2028) ($ billion)
      • Data Table on UAE - Market size and forecast (2023-2028) ($ billion)
      • Chart on UAE - Year-over-year growth (2023-2028) (%)
      • Data Table on UAE - Year-over-year growth (2023-2028) (%)
    • 11.22 Oman - Market size and forecast (2023-2028)
      • Chart on Oman - Market size and forecast (2023-2028) ($ billion)
      • Data Table on Oman - Market size and forecast (2023-2028) ($ billion)
      • Chart on Oman - Year-over-year growth (2023-2028) (%)
      • Data Table on Oman - Year-over-year growth (2023-2028) (%)
    • 11.23 Argentina - Market size and forecast (2023-2028)
      • Chart on Argentina - Market size and forecast (2023-2028) ($ billion)
      • Data Table on Argentina - Market size and forecast (2023-2028) ($ billion)
      • Chart on Argentina - Year-over-year growth (2023-2028) (%)
      • Data Table on Argentina - Year-over-year growth (2023-2028) (%)
    • 11.24 KSA - Market size and forecast (2023-2028)
      • Chart on KSA - Market size and forecast (2023-2028) ($ billion)
      • Data Table on KSA - Market size and forecast (2023-2028) ($ billion)
      • Chart on KSA - Year-over-year growth (2023-2028) (%)
      • Data Table on KSA - Year-over-year growth (2023-2028) (%)
    • 11.25 Rest of World (ROW) - Market size and forecast (2023-2028)
      • Chart on Rest of World (ROW) - Market size and forecast (2023-2028) ($ billion)
      • Data Table on Rest of World (ROW) - Market size and forecast (2023-2028) ($ billion)
      • Chart on Rest of World (ROW) - Year-over-year growth (2023-2028) (%)
      • Data Table on Rest of World (ROW) - Year-over-year growth (2023-2028) (%)

    10 Drivers, Challenges, and Trends

    • 10.1 Market drivers
      • 10.2 Market challenges
        • 10.3 Impact of drivers and challenges
          • Exhibit 109: Impact of drivers and challenges in 2023 and 2028
        • 10.4 Market trends

          11 Vendor Landscape

          • 11.1 Overview
            • 11.2 Vendor landscape
              • Exhibit 110: Overview on Criticality of inputs and Factors of differentiation
            • 11.3 Landscape disruption
              • Exhibit 111: Overview on factors of disruption
            • 11.4 Industry risks
              • Exhibit 112: Impact of key risks on business

            12 Vendor Analysis

            • 12.1 Vendors covered
              • Exhibit 113: Vendors covered
            • 12.2 Market positioning of vendors
              • Exhibit 114: Matrix on vendor position and classification
            • 12.3 All Seas Wholesale Inc.
              • Exhibit 115: All Seas Wholesale Inc. - Overview
              • Exhibit 116: All Seas Wholesale Inc. - Product / Service
              • Exhibit 117: All Seas Wholesale Inc. - Key offerings
            • 12.4 Austevoll Seafood ASA
              • Exhibit 118: Austevoll Seafood ASA - Overview
              • Exhibit 119: Austevoll Seafood ASA - Business segments
              • Exhibit 120: Austevoll Seafood ASA - Key offerings
              • Exhibit 121: Austevoll Seafood ASA - Segment focus
            • 12.5 Charoen Pokphand Foods PCL
              • Exhibit 122: Charoen Pokphand Foods PCL - Overview
              • Exhibit 123: Charoen Pokphand Foods PCL - Business segments
              • Exhibit 124: Charoen Pokphand Foods PCL - Key news
              • Exhibit 125: Charoen Pokphand Foods PCL - Key offerings
              • Exhibit 126: Charoen Pokphand Foods PCL - Segment focus
            • 12.6 Clearwater Seafoods Inc.
              • Exhibit 127: Clearwater Seafoods Inc. - Overview
              • Exhibit 128: Clearwater Seafoods Inc. - Product / Service
              • Exhibit 129: Clearwater Seafoods Inc. - Key offerings
            • 12.7 Cooke Aquaculture Inc.
              • Exhibit 130: Cooke Aquaculture Inc. - Overview
              • Exhibit 131: Cooke Aquaculture Inc. - Product / Service
              • Exhibit 132: Cooke Aquaculture Inc. - Key offerings
            • 12.8 Grieg Seafood ASA
              • Exhibit 133: Grieg Seafood ASA - Overview
              • Exhibit 134: Grieg Seafood ASA - Business segments
              • Exhibit 135: Grieg Seafood ASA - Key offerings
              • Exhibit 136: Grieg Seafood ASA - Segment focus
            • 12.9 Lee Fish
              • Exhibit 137: Lee Fish - Overview
              • Exhibit 138: Lee Fish - Product / Service
              • Exhibit 139: Lee Fish - Key offerings
            • 12.10 Lee Fishing Co.
              • Exhibit 140: Lee Fishing Co. - Overview
              • Exhibit 141: Lee Fishing Co. - Product / Service
              • Exhibit 142: Lee Fishing Co. - Key offerings
            • 12.11 Loch Duart Ltd.
              • Exhibit 143: Loch Duart Ltd. - Overview
              • Exhibit 144: Loch Duart Ltd. - Product / Service
              • Exhibit 145: Loch Duart Ltd. - Key offerings
            • 12.12 Marubeni Corp.
              • Exhibit 146: Marubeni Corp. - Overview
              • Exhibit 147: Marubeni Corp. - Business segments
              • Exhibit 148: Marubeni Corp. - Key offerings
              • Exhibit 149: Marubeni Corp. - Segment focus
            • 12.13 Maruha Nichiro Corp.
              • Exhibit 150: Maruha Nichiro Corp. - Overview
              • Exhibit 151: Maruha Nichiro Corp. - Business segments
              • Exhibit 152: Maruha Nichiro Corp. - Key news
              • Exhibit 153: Maruha Nichiro Corp. - Key offerings
              • Exhibit 154: Maruha Nichiro Corp. - Segment focus
            • 12.14 Nissui Corp.
              • Exhibit 155: Nissui Corp. - Overview
              • Exhibit 156: Nissui Corp. - Business segments
              • Exhibit 157: Nissui Corp. - Key offerings
              • Exhibit 158: Nissui Corp. - Segment focus
            • 12.15 Ocean Fresh Seafood
              • Exhibit 159: Ocean Fresh Seafood - Overview
              • Exhibit 160: Ocean Fresh Seafood - Product / Service
              • Exhibit 161: Ocean Fresh Seafood - Key offerings
            • 12.16 True World Foods LLC
              • Exhibit 162: True World Foods LLC - Overview
              • Exhibit 163: True World Foods LLC - Product / Service
              • Exhibit 164: True World Foods LLC - Key offerings
            • 12.17 Wm Morrison Supermarkets Ltd.
              • Exhibit 165: Wm Morrison Supermarkets Ltd. - Overview
              • Exhibit 166: Wm Morrison Supermarkets Ltd. - Product / Service
              • Exhibit 167: Wm Morrison Supermarkets Ltd. - Key offerings

            13 Appendix

            • 13.1 Scope of the report
              • 13.2 Inclusions and exclusions checklist
                • Exhibit 168: Inclusions checklist
                • Exhibit 169: Exclusions checklist
              • 13.3 Currency conversion rates for US$
                • Exhibit 170: Currency conversion rates for US$
              • 13.4 Research methodology
                • Exhibit 171: Research methodology
                • Exhibit 172: Validation techniques employed for market sizing
                • Exhibit 173: Information sources
              • 13.5 List of abbreviations
                • Exhibit 174: List of abbreviations

              Research Methodology

              Technavio presents a detailed picture of the market by way of study, synthesis, and summation of data from multiple sources. The analysts have presented the various facets of the market with a particular focus on identifying the key industry influencers. The data thus presented is comprehensive, reliable, and the result of extensive research, both primary and secondary.

              INFORMATION SOURCES

              Primary sources

              • Manufacturers and suppliers
              • Channel partners
              • Industry experts
              • Strategic decision makers

              Secondary sources

              • Industry journals and periodicals
              • Government data
              • Financial reports of key industry players
              • Historical data
              • Press releases

              DATA ANALYSIS

              Data Synthesis

              • Collation of data
              • Estimation of key figures
              • Analysis of derived insights

              Data Validation

              • Triangulation with data models
              • Reference against proprietary databases
              • Corroboration with industry experts

              REPORT WRITING

              Qualitative

              • Market drivers
              • Market challenges
              • Market trends
              • Five forces analysis

              Quantitative

              • Market size and forecast
              • Market segmentation
              • Geographical insights
              • Competitive landscape

              Interested in this report?

              Get your sample now to see our research methodology and insights!

              Download Now

              Frequently Asked Questions

              Fresh Fish and Seafood market growth will increase by $ 65.06 bn during 2024-2028 .

              The Fresh Fish and Seafood market is expected to grow at a CAGR of 3.95% during 2024-2028 .

              Fresh Fish and Seafood market is segmented by Type( Fresh fish, Crustaceans, Mollusks) Distribution Channel( Offline, Online, North America, South America, MEA)

              All Seas Wholesale Inc., Austevoll Seafood ASA, Charoen Pokphand Foods PCL, Clearwater Seafoods Inc., Cooke Aquaculture Inc., Grieg Seafood ASA, Lee Fish, Lee Fishing Co., Loch Duart Ltd., Marubeni Corp., Maruha Nichiro Corp., Meade Digital Enterprises Corp., Nissui Corp., Ocean Beauty Seafoods LLC, Ocean Fresh Seafood, Pescafresh, Surapon Foods Public Co. Ltd., Trident Seafoods Corp., Tropic Star Seafood Inc., True World Foods LLC, Wm Morrison Supermarkets Ltd. are a few of the key vendors in the Fresh Fish and Seafood market.

              APAC will register the highest growth rate of 50% among the other regions. Therefore, the Fresh Fish and Seafood market in APAC is expected to garner significant business opportunities for the vendors during the forecast period.

              US, Canada, Germany, UK, Italy, France, China, India, Japan, Brazil, Egypt, UAE, Oman, Argentina, KSA, UAE, Brazil, Rest of World (ROW)

              • Rising awareness about benefits of seafood consumptionGlobal fishmeal production is expected to reach 5.8 Mt in 2030 is the driving factor this market.
              • up 0.9% annually from the average level between 2018 and 2020. In the same time frame is the driving factor this market.
              • fish oil production is expected to increase by 0.8% annually to reach 1.2 Mt. an increased percentage of fish oil and fishmeal from 53% during the baseline period (2021-2030). The predicted 1.3% annual growth in global food fish consumption represents a significant decrease from the 2.3% annual growth rate observed during the preceding ten years. This decline can be attributed to several factors is the driving factor this market.
              • including slower population growth is the driving factor this market.
              • lower world meat prices is the driving factor this market.
              • particularly for poultry is the driving factor this market.
              • and lower incomes at the start of the decade. However is the driving factor this market.
              • global apparent food fish consumption is expected to increase from 20.5 kg per capita during the base period to 21.2 kg per capita in 2030. Asia is the driving factor this market.
              • Europe is the driving factor this market.
              • and the Americas will see increases in per capita fish consumption is the driving factor this market.
              • while Oceania will see stable per capita consumption. Fish is an easy source of essential nutrients is the driving factor this market.
              • such as omega-3 fatty acids is the driving factor this market.
              • high-quality lean protein is the driving factor this market.
              • healthy fat is the driving factor this market.
              • important vitamins is the driving factor this market.
              • and minerals is the driving factor this market.
              • including selenium and vitamin D. Protein: Protein is the building block of life and makes up a large part of the skin is the driving factor this market.
              • hair is the driving factor this market.
              • nails is the driving factor this market.
              • muscles is the driving factor this market.
              • organs is the driving factor this market.
              • and glands in the human body. An appropriate amount of protein must be consumed to ensure the efficient functioning of organs and hormones. Omega-3 fatty acids: Omega-3 fatty acids lower blood pressure is the driving factor this market.
              • lessen the risk of abnormal cardiac rhythms that could cause sudden death is the driving factor this market.
              • slow down the development of plaques that cause arteries to harden is the driving factor this market.
              • and lower blood triglyceride levels all of which contribute to heart health. An outstanding source of omega-3 fatty acids is tuna. Vitamin D: One of the few naturally occurring high sources of vitamin D is seafood is the driving factor this market.
              • like tuna. The maintenance of normal blood levels of calcium and phosphorus is aided by vitamin D. It also helps build and maintain strong bones and prevents rickets and osteomalacia (softening and weakening of bones). In addition is the driving factor this market.
              • it helps prevent certain types of cancer and diabetes. Selenium: The human body needs selenium in very small amounts. Selenium plays a key role in the healthy functioning of the immune system. It is found in soil is the driving factor this market.
              • water is the driving factor this market.
              • and some foods is the driving factor this market.
              • including nuts is the driving factor this market.
              • meat is the driving factor this market.
              • and seafood. Canned and pouch tuna are good sources of selenium. Such nutrients are important during pregnancy and for a healthy heart and brain. The rising awareness among consumers regarding the advantages of fish and seafood consumption has increased the demand for fresh fish and seafood products is the driving factor this market.
              • and this trend is expected to continue and propel the growth of the global fresh fish and seafood market during the forecast period. is the driving factor this market.

              The Fresh Fish and Seafood market vendors should focus on grabbing business opportunities from the Fresh fish segment as it accounted for the largest market share in the base year.