Athletic Footwear Market Size 2025-2029
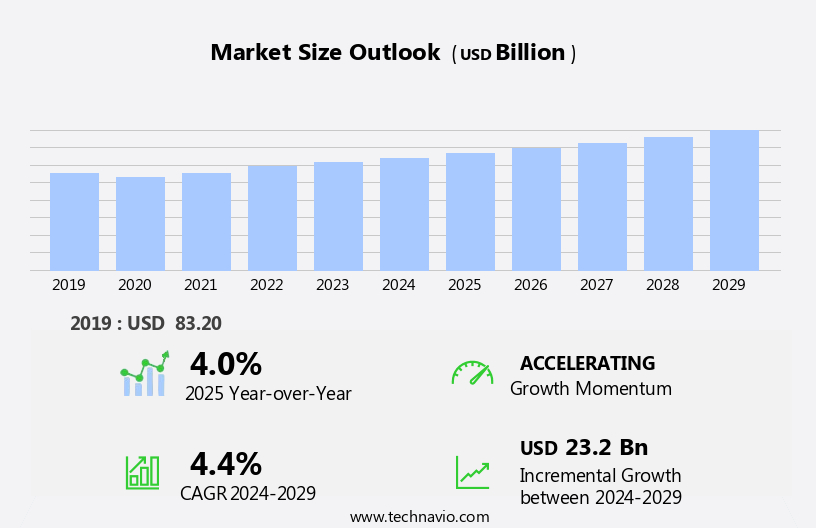
The athletic footwear market size is forecast to increase by USD 23.2 billion at a CAGR of 4.4% between 2024 and 2029.
- The market is experiencing significant growth, driven by the increasing number of athletic tournaments and the rising demand for customized footwear solutions. This trend is particularly noticeable among consumers seeking to improve their performance and comfort during physical activities. Furthermore, the availability of personalized designs and materials has become a key differentiator for brands, enabling them to cater to diverse customer preferences and needs. However, the market is not without challenges. Fluctuations in the prices of raw materials, such as rubber, leather, and synthetic fabrics, can impact the profitability of manufacturers.
- Additionally, the intense competition among established players and emerging brands necessitates continuous innovation and strategic marketing efforts to maintain market share. To capitalize on these opportunities and navigate challenges effectively, companies must focus on developing high-quality, customizable, and sustainable athletic footwear offerings while keeping a close eye on cost management and pricing strategies.
What will be the Size of the Athletic Footwear Market during the forecast period?
- The market is experiencing dynamic shifts, driven by various trends and market dynamics. Motion control and pronation control continue to be key focus areas, with supply chain transparency gaining prominence. Mesh fabrics and moisture management are essential features for enhancing comfort, while mass customization and 3D scanning enable personalized fits. Augmented reality and virtual reality technologies are revolutionizing the shopping experience, allowing consumers to try on shoes virtually. Gel cushioning, flexible outsole designs, and midsole technology deliver superior performance and comfort. Product differentiation is achieved through innovative materials, such as synthetic fabrics and leather uppers, as well as advanced upper construction and brand identity.
- Wearable sensors, activity tracking, and fitness tracking provide valuable data for performance optimization and injury prevention. Ethical sourcing and sustainable manufacturing are essential for maintaining consumer loyalty and securing a competitive advantage. Sustainable materials, such as natural fabrics and foam cushioning, contribute to the circular economy and appeal to eco-conscious consumers. Innovation leadership and data analytics are crucial for staying ahead of the competition, with advancements in arch support, water resistance, and footwear customization driving growth in the market. Overall, the athletic footwear industry continues to evolve, focusing on delivering superior performance, comfort, and sustainability to meet the evolving needs and preferences of consumers.
How is this Athletic Footwear Industry segmented?
The athletic footwear industry research report provides comprehensive data (region-wise segment analysis), with forecasts and estimates in "USD billion" for the period 2025-2029, as well as historical data from 2019-2023 for the following segments.
- Distribution Channel
- Offline
- Online
- End-user
- Men
- Women
- Children
- Application
- Recreational
- Professional
- Type
- Running shoes
- Sports shoes
- Trekking and hiking shoes
- Aerobic and walking shoes
- Geography
- APAC
- China
- India
- Japan
- South Korea
- Europe
- France
- Germany
- Italy
- Spain
- UK
- North America
- US
- Canada
- Mexico
- South America
- Brazil
- Middle East and Africa
- UAE
- APAC
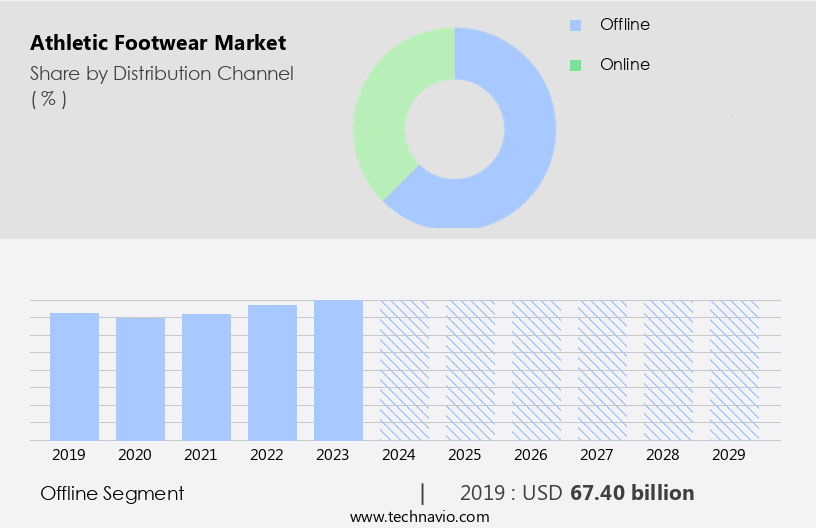
By Distribution Channel Insights
The offline segment is estimated to witness significant growth during the forecast period.
The market witnessed significant growth in 2024, with the offline segment leading the market. Specialty stores, a key component of the offline segment, held a substantial market share. These stores offer a wide range of popular athletic footwear brands and provide detailed product information, making them a preferred choice for buyers. The rise in the number of specialty stores contributes to the growth of the market. Footwear innovation continues to be a significant trend in the market, with product offerings including football cleats, sports footwear, running shoes, and more. Brands are focusing on performance enhancement and sports performance through the use of recycled materials, digital design, and wearable technology.
Comfort technology and gait analysis are also crucial factors driving product innovation. Brand marketing plays a crucial role in the market, with influencer marketing and social media channels being effective strategies. Consumer preferences for sustainable materials and performance apparel are also shaping the market. Performance footwear, such as athletic sneakers, hiking boots, and trail running shoes, are popular choices for those seeking improvement in their lifestyle and athletic pursuits. Casual footwear, including men's and women's footwear, and youth footwear, are also significant categories in the market. Brick-and-mortar stores, department stores, and online retailers cater to the diverse consumer preferences in these categories.
Fashion trends, such as digital marketing and cross-training shoes, are also influencing the market. Athlete performance and lifestyle choices continue to be key drivers in the market. Performance tracking and foot analysis are essential for athletes seeking to optimize their performance. Biomechanics research and design trends are also shaping the market, with a focus on data-driven design, virtual fitting, and personalized footwear. In summary, The market is driven by product innovation, consumer preferences, and marketing strategies. Specialty stores, brand marketing, and consumer trends are key factors shaping the market dynamics. The market offers a wide range of footwear categories, including athletic footwear, casual footwear, and performance footwear, catering to diverse consumer needs and lifestyle choices.
Get a glance at the market report of share of various segments Request Free Sample
The Offline segment was valued at USD 67.40 billion in 2019 and showed a gradual increase during the forecast period.
Regional Analysis
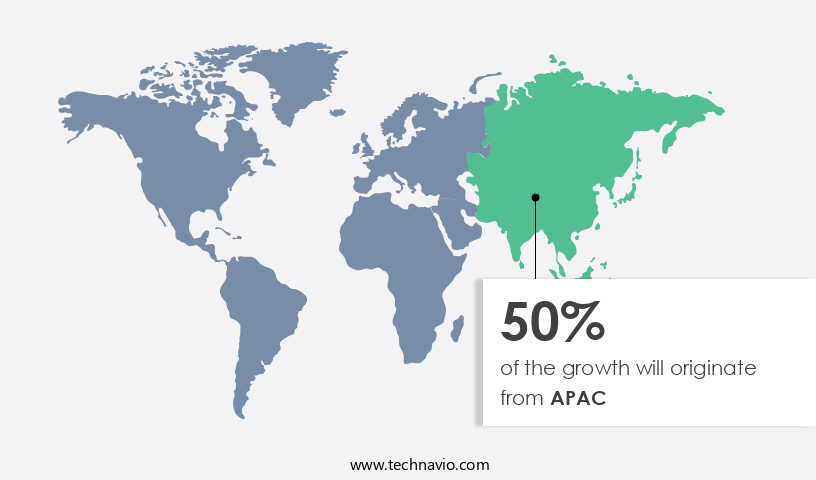
APAC is estimated to contribute 50% to the growth of the global market during the forecast period.Technavio’s analysts have elaborately explained the regional trends and drivers that shape the market during the forecast period.
For more insights on the market size of various regions, Request Free Sample
The footwear industry in Asia Pacific is experiencing significant growth due to increasing consumer preferences for sport-inspired and sport-specific footwear. This trend is particularly noticeable in countries like China and India, where the number of sports enthusiasts is on the rise. The region's hosting of international sports events, such as the Asian Games, the ICC Cricket World Cup, and the ACC Asia Cup, has heightened awareness about the benefits of sports and fitness activities among consumers. As a result, there is a growing demand for athletic footwear, including football cleats, athletic apparel, running shoes, and hiking boots, among others.
Moreover, advancements in technology have led to innovations in footwear design and manufacturing. For instance, 3D printing, data-driven design, virtual fitting, and wearable technology are increasingly being used to create personalized footwear that caters to individual foot shapes and preferences. Sustainable materials, such as recycled materials and bio-based materials, are also gaining popularity due to growing concerns about the environment. Brand marketing, lifestyle choices, and social media marketing are also influencing the footwear market in the region. Consumers are increasingly seeking performance enhancement and sports performance from their footwear, leading to the development of performance footwear, athletic training shoes, and cross-training shoes.
Casual footwear, including sneakers and lifestyle footwear, are also popular choices among consumers, particularly among the younger demographic. Retail channels, including specialty stores, department stores, and online retailers, are adapting to these trends by offering a wider range of footwear options and personalized services. For example, some retailers are using gait analysis and foot analysis to help consumers choose the right footwear for their specific needs. Others are using digital design and performance tracking to offer customized footwear solutions. In summary, the footwear market in Asia Pacific is experiencing significant growth due to increasing consumer preferences for sport-inspired and sport-specific footwear, advancements in technology, and changing consumer trends.
The market is expected to continue growing during the forecast period as consumers seek out footwear that offers performance enhancement, comfort technology, and personalized solutions.
Market Dynamics
Our researchers analyzed the data with 2024 as the base year, along with the key drivers, trends, and challenges. A holistic analysis of drivers will help companies refine their marketing strategies to gain a competitive advantage.
What are the key market drivers leading to the rise in the adoption of Athletic Footwear Industry?
- Rise in number of athletic tournaments is the key driver of the market.
- The market has experienced notable growth due to the escalating number of athletic tournaments worldwide. This trend has resulted in a substantial increase in the demand for athletic footwear over the past few years. The popularity of various sports events, including the World Baseball Softball Confederation (WBSC) Premier, T20 World Cup, Olympics, and Ashes, has led to a rise in the number of registered players.
- In turn, this has driven the adoption of footwear specifically designed for different sports. As a result, the market for athletic footwear is anticipated to expand further during the forecast period, with the growing participation in sports and the subsequent demand for appropriate footwear being the primary growth drivers.
What are the market trends shaping the Athletic Footwear Industry?
- Increasing availability of customized athletic footwear is the upcoming market trend.
- The footwear market is witnessing a significant shift towards mass customization and personalization. This trend is driven by advancements in technology, supply chain transformation, and organizational restructuring. Companies are focusing on strategies such as faster delivery processes and personalized products to cater to the unique requirements of consumers. Technological innovations in footwear measurement, final product development, and delivery have facilitated this trend. Custom-made footwear offers additional comfort by improving the functioning of feet, ankles, calf muscles, and legs. It is particularly beneficial for individuals with medical conditions or those who struggle to find suitable footwear.
- The availability of custom-made models allows consumers to wear products tailored to their specific needs. This not only enhances their overall shopping experience but also fosters brand loyalty. The benefits of custom-made footwear extend beyond comfort, as it also contributes to better posture and reduced foot pain. The footwear industry's focus on mass customization and personalization is expected to continue, as consumers increasingly demand products that cater to their unique preferences and requirements. This trend is set to revolutionize the footwear market and offer new opportunities for businesses to differentiate themselves from competitors.
What challenges does the Athletic Footwear Industry face during its growth?
- Fluctuations in prices of raw materials is a key challenge affecting the industry growth.
- The market faces challenges due to the volatility in the prices of raw materials, which are essential for manufacturing athletic footwear. Materials such as leather, polyester, nylon, synthetics, rubber, and foam are commonly used. Fluctuations in their prices can negatively impact the profitability of athletic footwear manufacturers. For instance, the cost of ethylene-vinyl acetate (EVA), a polymer used for producing soft and flexible footwear soles, has risen significantly in recent years, leading to increased manufacturing costs.
- This price instability poses a significant hurdle for the market's growth.
Exclusive Customer Landscape
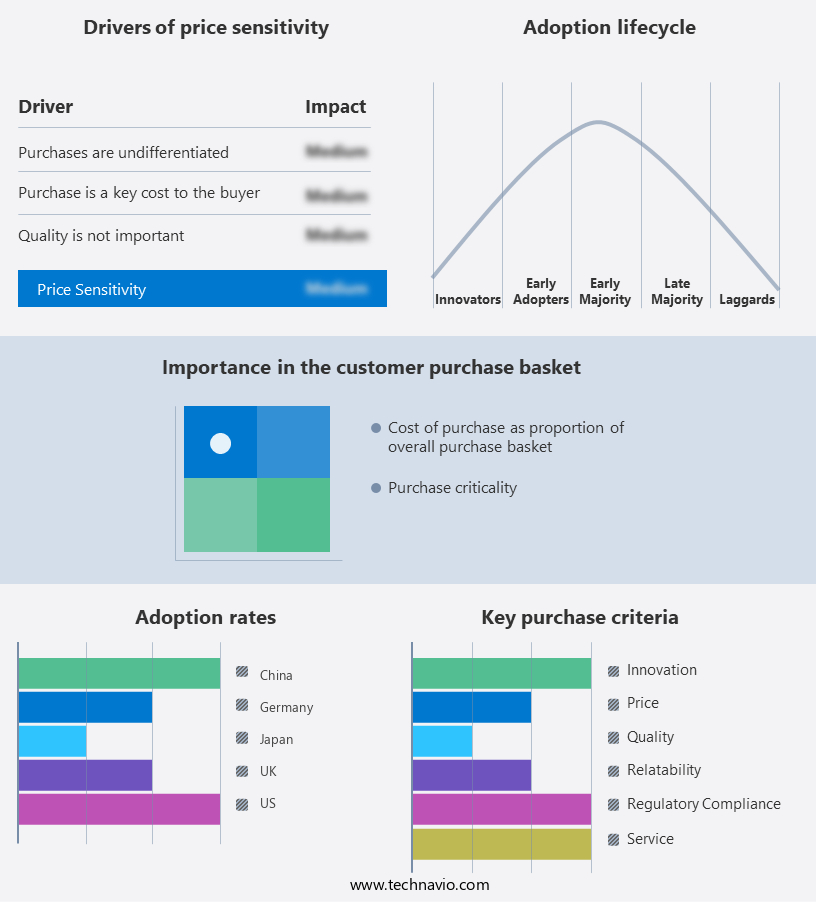
The athletic footwear market forecasting report includes the adoption lifecycle of the market, covering from the innovator’s stage to the laggard’s stage. It focuses on adoption rates in different regions based on penetration. Furthermore, the athletic footwear market report also includes key purchase criteria and drivers of price sensitivity to help companies evaluate and develop their market growth analysis strategies.
Customer Landscape
Key Companies & Market Insights
Companies are implementing various strategies, such as strategic alliances, athletic footwear market forecast, partnerships, mergers and acquisitions, geographical expansion, and product/service launches, to enhance their presence in the industry.
Nike Inc. - The company specializes in athletic footwear, providing a range of options including running shoes, basketball shoes, and training shoes, catering to diverse fitness needs. Our product portfolio encompasses innovative designs and advanced technologies, ensuring optimal performance and comfort for consumers. By staying at the forefront of industry trends and incorporating cutting-edge materials, we deliver high-quality footwear solutions that enhance athletic experiences.
The industry research and growth report includes detailed analyses of the competitive landscape of the market and information about key companies, including:
- Nike Inc.
- Adidas AG
- Under Armour Inc.
- New Balance Athletics Inc.
- Skechers USA Inc.
- Asics Corporation
- Mizuno Corporation
- Anta Sports Products Ltd.
- Li Ning Company Ltd.
- Xtep International Holdings Ltd.
- 361 Degrees International Ltd.
- Peak Sport Products Co. Ltd.
- Puma SE
- Salomon
- Lowa Sportschuhe GmbH
- Meindl
- Haglöfs
- Merrell
- Columbia Sportswear Company
- Arc'teryx
Qualitative and quantitative analysis of companies has been conducted to help clients understand the wider business environment as well as the strengths and weaknesses of key industry players. Data is qualitatively analyzed to categorize companies as pure play, category-focused, industry-focused, and diversified; it is quantitatively analyzed to categorize companies as dominant, leading, strong, tentative, and weak.
Research Analyst Overview
The market continues to evolve, driven by advancements in technology, consumer preferences, and brand marketing efforts. Athletic apparel and footwear have become increasingly interconnected, with many consumers seeking performance enhancement and lifestyle choices in their footwear. Online retailers have played a significant role in the industry's growth, offering convenience and a wide selection of options. Sports footwear remains a key segment, with football cleats, soccer cleats, running shoes, and basketball shoes leading the way. Product innovation is a critical factor in this market, with brands continually pushing the boundaries of design and materials. Recycled materials, water shoes, and 3D printing are just a few examples of the latest trends.
Brand marketing efforts have also been instrumental in driving sales, with influencer marketing and social media campaigns becoming increasingly popular. Performance enhancement and tracking are also key areas of focus, with wearable technology and virtual fitting allowing for personalized footwear and gait analysis. Comfort technology is another crucial factor, with consumers seeking shoes that provide optimal support and cushioning. Lifestyle footwear, including casual sneakers and hiking boots, have also gained popularity, reflecting consumers' desire for versatile and functional footwear. Sustainable materials and bio-based materials are becoming more prevalent in the market, as consumers become more environmentally conscious. Performance apparel and athletic training shoes are also growing segments, with cross-training shoes and tennis shoes popular choices.
Brick-and-mortar stores continue to face competition from online retailers, but they still play a significant role in the market, offering consumers the ability to try on shoes before purchasing and providing expert advice. Specialty stores and department stores also offer a wide selection of options, catering to different consumer needs and preferences. Performance improvement and biomechanics research are ongoing areas of focus, with brands continually seeking to optimize footwear for specific activities and foot types. Design trends, such as digital design and data-driven design, are also shaping the market, allowing for more precise and customized footwear. In , the market is a dynamic and evolving industry, driven by consumer preferences, technology, and brand marketing efforts.
From sports footwear to lifestyle footwear, comfort technology to sustainability, there is a wide range of options available to consumers seeking functional and stylish footwear.
|
Market Scope |
|
|
Report Coverage |
Details |
|
Page number |
236 |
|
Base year |
2024 |
|
Historic period |
2019-2023 |
|
Forecast period |
2025-2029 |
|
Growth momentum & CAGR |
Accelerate at a CAGR of 4.4% |
|
Market growth 2025-2029 |
USD 23.2 billion |
|
Market structure |
Fragmented |
|
YoY growth 2024-2025(%) |
4.0 |
|
Key countries |
US, China, Japan, Germany, France, Spain, Canada, India, South Korea, France, Japan, Italy, Brazil, UAE, UK, Spain, Rest of World (ROW), and Mexico |
|
Competitive landscape |
Leading Companies, Market Positioning of Companies, Competitive Strategies, and Industry Risks |
What are the Key Data Covered in this Athletic Footwear Market Research and Growth Report?
- CAGR of the Athletic Footwear industry during the forecast period
- Detailed information on factors that will drive the growth and forecasting between 2025 and 2029
- Precise estimation of the size of the market and its contribution of the industry in focus to the parent market
- Accurate predictions about upcoming growth and trends and changes in consumer behaviour
- Growth of the market across APAC, Europe, North America, South America, and Middle East and Africa
- Thorough analysis of the market’s competitive landscape and detailed information about companies
- Comprehensive analysis of factors that will challenge the athletic footwear market growth of industry companies
We can help! Our analysts can customize this athletic footwear market research report to meet your requirements.
 RIA -
RIA - 
