Atopic Dermatitis Drugs Market Analysis, Size, and Forecast 2024-2028: North America (US, Canada), Europe (Germany, UK, Italy, France), APAC (China, India, Japan), South America (Brazil), Middle East & Africa

Atopic Dermatitis Drugs Market Analysis, Size, and Forecast 2024-2028:
North America (US, Canada), Europe (Germany, UK, Italy, France), APAC (China, India, Japan), South America (Brazil), Middle East & Africa

Published: May 2024 175 Pages SKU: IRTNTR75242

Market Overview at a Glance

$6.20 B
Market Opportunity
10.87%
CAGR
9.53
YoY growth 2023-2024(%)

Atopic Dermatitis Drugs Market Size 2024-2028

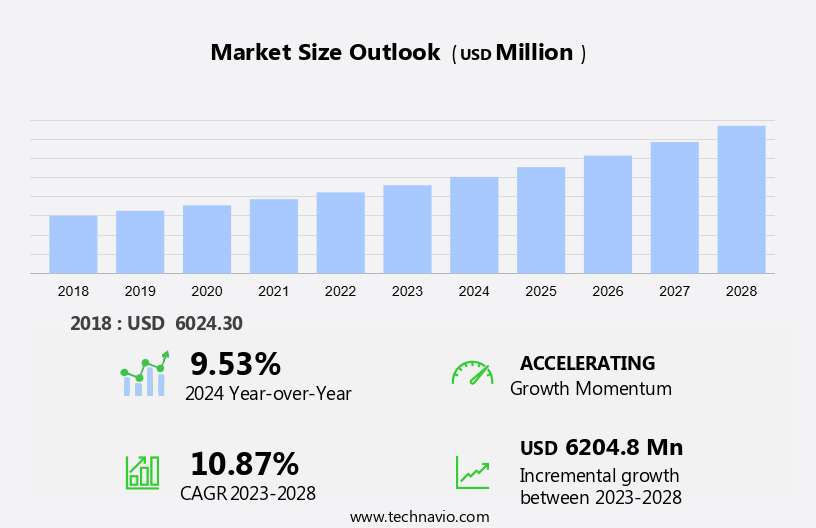
The atopic dermatitis drugs market size is forecast to increase by USD 6.2 billion at a CAGR of 10.87% between 2023 and 2028.

  • The market is witnessing significant growth due to the high prevalence of this condition, which affects an estimated 10-20% of the global population, particularly among pediatric patients and those with hand eczema therapeutics. Strategic partnerships and acquisitions among market players are also driving market growth.
  • However, the market is also facing challenges, such as the side effects associated with traditional treatments like corticosteroids and oil stripping soaps and dermatology treatment. These side effects include thinning of the skin, increased risk of infections, and potential for long-term complications. As a result, there is a growing demand for alternative treatments, such as biologics and immunomodulators, which offer fewer side effects and more effective long-term management of the condition. In addition, increasing awareness and education about atopic dermatitis, as well as advancements in research and development, are expected to further fuel market growth.

What will be the Size of the Atopic Dermatitis Drugs Market During the Forecast Period?

Atopic Dermatitis Drugs Market Size

 Request Free Sample

  • The market encompasses a range of treatments for this chronic and inflammatory skin condition, including corticosteroids, biologics, targeted therapies, and novel products. Corticosteroid use remains prevalent due to their efficacy in reducing inflammation and symptoms, though concerns over long-term side effects persist. Biologics and targeted therapies, including ruxolitinib cream, offer more targeted approaches, addressing specific inflammatory pathways. Hospital pharmacies play a crucial role in supplying these medications, given their complexities and potential for regulatory complexities. Market dynamics are influenced by disease prevalence, healthcare expenditure, and Westernized lifestyles. Atopic dermatitis affects approximately 10-20% of children and 1-3% of adults, leading to significant healthcare costs.
  • The growth of telemedicine and increasing access to specialized care are expected to improve treatment accessibility, particularly for pediatric patients. Topical steroids, handwashing, and oil stripping soaps are common triggers for atopic dermatitis, contributing to its prevalence in hand eczema and other forms. Infections, including hand infections, further complicate treatment. Novel products, such as crisaborole ointment, offer potential solutions to these challenges. Despite these advancements, healthcare access disparities and regulatory complexities continue to impact drug approvals and patient access.

How is this Atopic Dermatitis Drugs Industry segmented and which is the largest segment?

The atopic dermatitis drugs industry research report provides comprehensive data (region-wise segment analysis), with forecasts and estimates in "USD billion" for the period 2024-2028, as well as historical data from 2018-2022 for the following segments.

  • Route Of Administration
    • Oral
    • Topical
    • Injectable
  • Drug Class
    • Biologics
    • PDE4 inhibitors
    • Corticosteroids
    • Calcineurin inhibitors
  • Geography
    • North America
      • Canada
      • US
      • Mexico
    • Europe
      • Germany
      • UK
      • France
    • Asia
      • China
      • India
      • Japan
      • Australia
    • Rest of World (ROW)

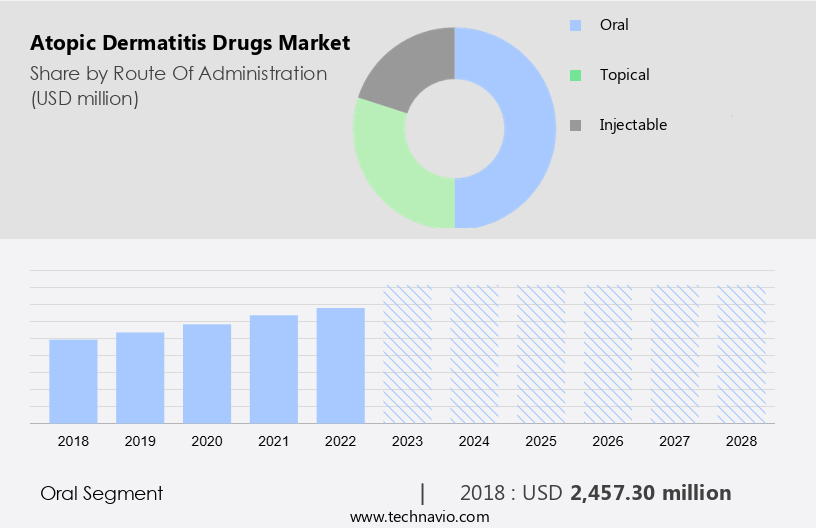
By Route Of Administration Insights

The oral segment is estimated to witness significant growth during the forecast period. The oral segment of the market is experiencing significant growth due to the convenience and ease-of-use associated with oral solid dosage manufacturing. Prescription-based drugs, such as oral capsules, are gaining popularity for the treatment of refractory moderate to severe atopic dermatitis. In January 2022, the US Food and Drug Administration (FDA) granted approval to AbbVie and Pfizer for their oral drugs, upadacitinib and abrocitinib, respectively, for the treatment of this condition. These approvals are expected to accelerate the growth of the oral segment during the forecast period.

However, the use of oral drugs for this comes with potential health risks, including side effects, which could lead to regulatory rejections. For instance, BenevolentAI, a UK-based drug development firm, failed to progress in the Phase II trial of its lead candidate BEN-2293 for atopic dermatitis. Despite these challenges, the increasing number of approvals for oral drugs and their benefits, such as ease of administration, are anticipated to drive the growth of the oral segment and the market as a whole during the forecast period.

Atopic Dermatitis Drugs Market Size

Get a glance at the  Atopic Dermatitis Drugs Industry report of share of various segments. Request Free Sample

The oral segment was valued at USD 2.46 billion in 2018 and showed a gradual increase during the forecast period.

Regional Analysis

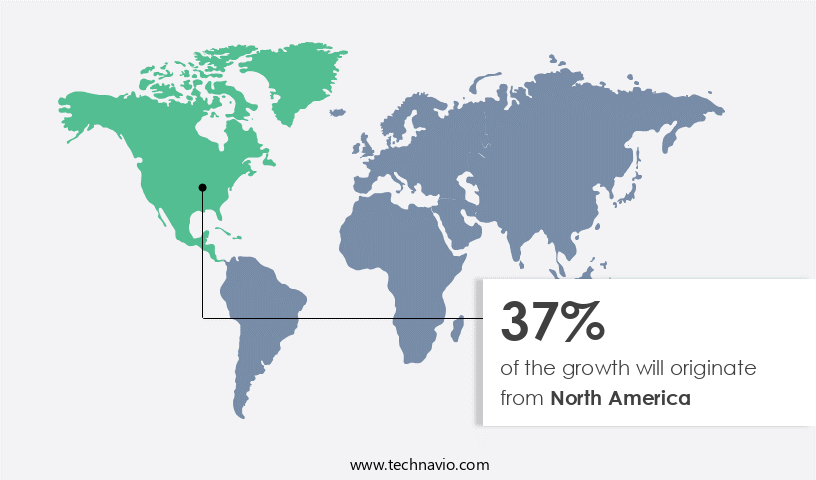
North America is estimated to contribute 37% to the growth of the global market during the forecast period. Technavio’s analysts have elaborately explained the regional trends and drivers that shape the market during the forecast period.

Atopic Dermatitis Drugs Market Share by Geography

For more insights on the market share of various regions, Request Free Sample

The market in North America holds a significant share due to factors including early adoption of novel treatments, high disease awareness, and well-established healthcare infrastructure. Favorable reimbursement policies, increasing US FDA drug approvals, and substantial healthcare expenditure further fuel market growth. The rising healthcare expenditure In the region increases the demand for atopic dermatitis drugs among patients. Topical steroids, calcineurin inhibitors, systemic treatments, biologic agents, emollients, and moisturizers are common drug classes used to manage atopic dermatitis.

Corticosteroids, such as topical creams, remain popular treatments, while targeted therapies like biologics offer novel approaches. Regulatory complexities and healthcare access disparities pose challenges, but drug innovations, patient support programs, and telemedicine adoption aim to improve patient outcomes. PDE4 Inhibitors and other novel products cater to specific patient needs, particularly pediatric patients and those with hand eczema, inverse psoriasis, Sjogren’s syndrome, frontal fibrosing alopecia, dry eye disease, and other related conditions. Market growth is influenced by disease prevalence, pricing challenges, business opportunities, and regulatory requirements.

Atopic Dermatitis Drugs Market Dynamics

The dermatology sector is advancing eczema relief through a range of biologic therapies, topical steroids, and non-steroidal options like JAK inhibitors and calcineurin inhibitors, addressing diverse patient needs. Monoclonal antibodies and immune modulators target underlying inflammation, while anti-inflammatory drugs and phototherapy options provide systemic treatments for severe cases. Innovations in precision medicine, supported by AI diagnostics, enable personalized care, improving treatment adherence and patient outcomes. Clinical trials continue to validate drug efficacy and safety profiles, ensuring reliable dermatitis management. Smart delivery systems and innovative formulations enhance skin barrier repair, offering itch relief and long-term health benefits. By integrating monoclonal antibodies with systemic treatments, these therapies reduce flare-ups and improve quality of life. As the field evolves, the focus on tailored solutions and advanced diagnostics positions dermatology to deliver more effective, patient-centric care.

Our researchers analyzed the data with 2023 as the base year, along with the key drivers, trends, and challenges. A holistic analysis of drivers will help companies refine their marketing strategies to gain a competitive advantage.

What are the key market drivers leading to the rise In the adoption of Atopic Dermatitis Drugs Industry?

  • The high prevalence of atopic dermatitis is the key driver of the market. Atopic dermatitis is a chronic inflammatory skin condition affecting approximately 18 million people In the US, with around 9-10 million being children. Factors contributing to its prevalence include exposure to allergens, skin irritants, stress, dry skin, and infections. The large patient population presents a significant opportunity for the expansion of the market. Corticosteroids, including topical steroids and calcineurin inhibitors, are commonly used to manage mild-to-moderate atopic dermatitis. Topical corticosteroids reduce inflammation, while calcineurin inhibitors suppress the immune system. Systemic treatments, such as biologic agents, are reserved for severe cases. Novel treatment options, like ruxolitinib cream, a JAK1/JAK2 inhibitor, and PDE4 Inhibitors, are under development.
  • Biologics, targeted therapies, and novel products, such as crisaborole ointment for hand eczema and dry eye disease, offer potential solutions for patients. Telemedicine adoption is increasing, providing greater access to healthcare for those with atopic dermatitis, especially in underserved areas. Emollients and moisturizers are essential components of atopic dermatitis treatment, and patient support programs help manage the disease's impact on patients' lives. The regulatory complexities and pricing challenges associated with drug development and approval pose significant hurdles for market growth. However, innovations in drug development, personalized medicine, and patient loyalty programs offer business opportunities for market participants. It affects various demographics, including children, and can manifest in different forms, such as hand dermatitis, inverse psoriasis, Sjogren's syndrome, and frontal fibrosing alopecia.

What are the market trends shaping the Atopic Dermatitis Drugs Industry?

  • Strategic partnerships and acquisitions is the upcoming market trend. The market has witnessed significant growth In the past few years due to the increasing disease prevalence and healthcare expenditure, driven by Westernized lifestyles and the rising incidence of hand eczema and hand dermatitis. companies in this market are expanding their product offerings through various strategies, including mergers and acquisitions and technology collaborations. For example, in January 2024, Pfizer and Glenmark introduced Abrocitinib, an oral advanced systemic treatment for moderate-to-severe atopic dermatitis, in India. Corticosteroids, including topical steroids and calcineurin inhibitors, remain the primary treatment for atopic dermatitis. However, the market for biologic agents, targeted therapies, and novel products, such as ruxolitinib cream and crisaborole ointment, is growing rapidly.
  • Regulatory complexities and pricing challenges pose significant hurdles for market entrants. Emollients and moisturizers are essential adjuncts to treatment, and patient support programs play a crucial role in improving patient outcomes. Drug development is ongoing, with new treatments in various stages of development, including PDE4 Inhibitors and systemic treatments. Telemedicine adoption is also increasing, providing greater access to care for patients, especially those with limited healthcare access disparities.

What challenges does the Atopic Dermatitis Drugs Industry face during its growth?

  • Side effects associated with corticosteroids is a key challenge affecting the industry growth. Atopic dermatitis, a chronic inflammatory skin condition, affects millions leading to significant healthcare expenditure. Corticosteroids, such as clobetasol propionate and halobetasol propionate, remain a common treatment for its symptoms, including itching, inflammation, and redness. However, their long-term use can lead to serious side effects, including skin thinning, thickening, darkening, and stretch marks. As a result, they are typically reserved for patients who have not responded to other treatment methods, such as emollients, allergen avoidance, and anti-bacterial measures. Biologics, targeted therapies, and novel products, including ruxolitinib cream, are emerging as alternative treatment options. Regulatory complexities and pricing challenges associated with these advanced therapies, however, pose significant hurdles.
  • Telemedicine adoption and patient support programs are also transforming the market, enabling greater access to care for pediatric patients and those in underserved communities. The disease's prevalence, driven in part by Westernized lifestyles and environmental factors, continues to rise. Systemic treatments, including biologic agents, PDE4 Inhibitors, and Calcineurin inhibitors, offer promise for more effective and personalized medicine. Emollients and moisturizers remain essential components of treatment regimens, while topical corticosteroids and calcineurin inhibitors continue to be the mainstay of therapy for many patients. Market dynamics, including regulatory requirements, drug development, and patient outcomes, are shaping the future of atopic dermatitis drug innovation.

Exclusive Customer Landscape

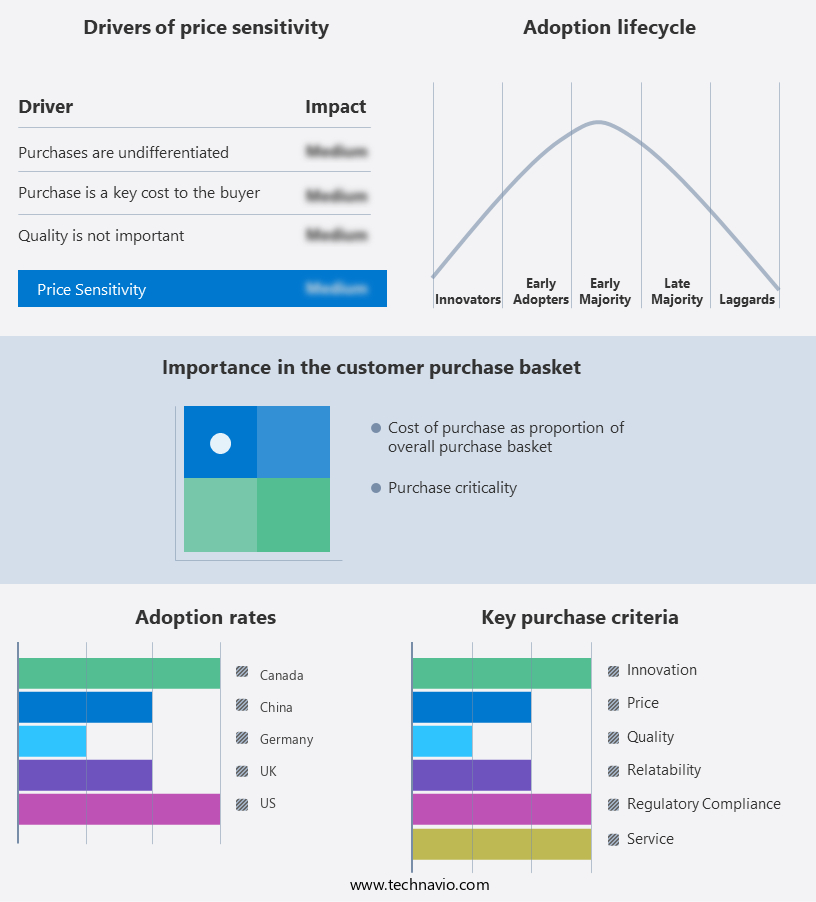
The atopic dermatitis drugs market forecasting report includes the adoption lifecycle of the market, covering from the innovator’s stage to the laggard’s stage. It focuses on adoption rates in different regions based on penetration. Furthermore, the atopic dermatitis drugs market report also includes key purchase criteria and drivers of price sensitivity to help companies evaluate and develop their market growth analysis strategies.

Atopic Dermatitis Drugs Market Share by Geography

 Customer Landscape

Key Companies & Market Insights

Companies are implementing various strategies, such as strategic alliances, atopic dermatitis drugs market forecast, partnerships, mergers and acquisitions, geographical expansion, and product/service launches, to enhance their presence In the industry.

The industry research and growth report includes detailed analyses of the competitive landscape of the market and information about key companies, including:

  • AbbVie Inc.
  • Arcutis Biotherapeutics Inc.
  • Asana BioSciences LLC
  • Astellas Pharma Inc.
  • Bausch Health Companies Inc.
  • Bayer AG
  • BiomX Inc.
  • Bristol Myers Squibb Co.
  • Dermavant Sciences Inc.
  • Eli Lilly and Co.
  • Evelo Biosciences Inc.
  • Galderma SA
  • Incyte Corp.
  • LEO Pharma AS
  • Maruho Co. Ltd.
  • Novartis AG
  • Otsuka Holdings Co. Ltd.
  • Pfizer Inc.
  • Sanofi SA
  • Viatris Inc.

Qualitative and quantitative analysis of companies has been conducted to help clients understand the wider business environment as well as the strengths and weaknesses of key industry players. Data is qualitatively analyzed to categorize companies as pure play, category-focused, industry-focused, and diversified; it is quantitatively analyzed to categorize companies as dominant, leading, strong, tentative, and weak.

Latest Market Developments and News

  • In January 2025, Eli Lilly launched a new topical treatment for atopic dermatitis, marketed under the brand name Dermacure, priced at USD 300 per month. The drug utilizes a novel anti-inflammatory mechanism and aims to provide relief for patients with moderate to severe cases of atopic dermatitis.

  • In December 2024, Sanofi partnered with a biotechnology firm to co-develop a biologic drug aimed at reducing flare-ups of atopic dermatitis in pediatric patients. The collaboration, valued at USD 400 million, focuses on creating a safer and more effective treatment for younger patients with chronic skin conditions.

  • In November 2024, Pfizer acquired a small pharmaceutical company specializing in the development of oral treatments for atopic dermatitis for USD 250 million. This acquisition strengthens Pfizer's pipeline and expands its offerings in the dermatology sector, particularly for patients seeking oral alternatives to topical therapies.

  • In October 2024, AbbVie announced the launch of a new injectable biologic treatment for atopic dermatitis that promises to deliver long-lasting relief. Priced at USD 1,500 per dose, this drug is aimed at patients with severe forms of the condition who have not responded to traditional therapies.

Research Analyst Overview

Atopic dermatitis, a chronic inflammatory skin condition, continues to pose significant challenges for patients and healthcare systems worldwide. The market represents a sizeable and growing segment of the pharmaceutical industry, driven by the increasing prevalence of the disease and the ongoing development of novel treatment options. Corticosteroids have long been the mainstay of atopic dermatitis therapy, with topical formulations providing effective symptomatic relief for many patients. However, the long-term use of corticosteroids can lead to adverse effects, including skin thinning and increased susceptibility to infections. As a result, there is a growing interest in alternative treatment modalities, including biologics, targeted therapies, and novel products.

Biologics, which are monoclonal antibodies or recombinant proteins, have shown promise In the treatment of severe atopic dermatitis. These agents target specific cytokines and immune pathways, offering the potential for more effective and safer treatments. Ruxolitinib cream, a JAK1/JAK2 inhibitor, is an example of a novel biologic agent that has shown efficacy in the treatment. Hospital pharmacies have traditionally been the primary providers of systemic treatments for atopic dermatitis. However, the adoption of telemedicine and the expansion of retail pharmacy services have led to increased competition and new opportunities for market growth. Patient support programs, which offer educational resources and personalized care plans, are also becoming increasingly important In the market.

Further, the prevalence of atopic dermatitis is influenced by various factors, including Westernized lifestyles, healthcare expenditure, and disease severity. Children are particularly susceptible to the condition, with hand eczema being a common manifestation. Infections, such as Staphylococcus aureus, can exacerbate this and contribute to the disease's chronicity. The regulatory complexities surrounding the development and approval of atopic dermatitis drugs can be significant. Drug innovations, such as personalized medicine and targeted therapies, require extensive clinical trials and regulatory oversight to ensure safety and efficacy. Pricing challenges and healthcare access disparities also present significant barriers to market growth. Despite these challenges, there are numerous business opportunities In the market.

Market Scope

Report Coverage

Details

Page number

175

Base year

2023

Historic period

2018-2022

Forecast period

2024-2028

Growth momentum & CAGR

Accelerate at a CAGR of 10.87%

Market Growth 2024-2028

USD 6.2 billion

Market structure

Fragmented

YoY growth 2023-2024(%)

9.53

Key countries

US, Canada, Germany, UK, and China

Competitive landscape

Leading Companies, Market Positioning of Companies, Competitive Strategies, and Industry Risks

Request Free Sample

What are the Key Data Covered in this Atopic Dermatitis Drugs Market Research and Growth Report?

  • CAGR of the Atopic Dermatitis Drugs industry during the forecast period
  • Detailed information on factors that will drive the market growth and forecasting between 2024 and 2028
  • Precise estimation of the size of the market and its contribution of the industry in focus to the parent market
  • Accurate predictions about upcoming growth and trends and changes in consumer behaviour
  • Growth of the market across North America, Europe, Asia, and Rest of World (ROW)
  • Thorough analysis of the market’s competitive landscape and detailed information about companies
  • Comprehensive analysis of factors that will challenge the atopic dermatitis drugs market growth of industry companies

We can help! Our analysts can customize this atopic dermatitis drugs market research report to meet your requirements.

Get in touch

1 Executive Summary

  • 1.1 Market overview
    • Executive Summary - Chart on Market Overview
    • Executive Summary - Data Table on Market Overview
    • Executive Summary - Chart on Global Market Characteristics
    • Executive Summary - Chart on Market by Geography
    • Executive Summary - Chart on Market Segmentation by Route of Administration
    • Executive Summary - Chart on Market Segmentation by Drug Class
    • Executive Summary - Chart on Incremental Growth
    • Executive Summary - Data Table on Incremental Growth
    • Executive Summary - Chart on Company Market Positioning

2 Market Landscape

  • 2.1 Market ecosystem
    • Parent Market
    • Data Table on - Parent Market
  • 2.2 Market characteristics
    • Market characteristics analysis
  • 2.3 Value chain analysis
    • Value Chain Analysis

3 Market Sizing

  • 3.1 Market definition
    • Offerings of companies included in the market definition
  • 3.2 Market segment analysis
    • Market segments
  • 3.3 Market size 2023
    • 3.4 Market outlook: Forecast for 2023-2028
      • Chart on Global - Market size and forecast 2023-2028 ($ million)
      • Data Table on Global - Market size and forecast 2023-2028 ($ million)
      • Chart on Global Market: Year-over-year growth 2023-2028 (%)
      • Data Table on Global Market: Year-over-year growth 2023-2028 (%)

    4 Historic Market Size

    • 4.1 Global Atopic Dermatitis Drugs Market 2018 - 2022
      • Historic Market Size - Data Table on Global Atopic Dermatitis Drugs Market 2018 - 2022 ($ million)
    • 4.2 Route of Administration segment analysis 2018 - 2022
      • Historic Market Size - Route of Administration Segment 2018 - 2022 ($ million)
    • 4.3 Drug Class segment analysis 2018 - 2022
      • Historic Market Size - Drug Class Segment 2018 - 2022 ($ million)
    • 4.4 Geography segment analysis 2018 - 2022
      • Historic Market Size - Geography Segment 2018 - 2022 ($ million)
    • 4.5 Country segment analysis 2018 - 2022
      • Historic Market Size - Country Segment 2018 - 2022 ($ million)

    5 Five Forces Analysis

    • 5.1 Five forces summary
      • Five forces analysis - Comparison between 2023 and 2028
    • 5.2 Bargaining power of buyers
      • Bargaining power of buyers - Impact of key factors 2023 and 2028
    • 5.3 Bargaining power of suppliers
      • Bargaining power of suppliers - Impact of key factors in 2023 and 2028
    • 5.4 Threat of new entrants
      • Threat of new entrants - Impact of key factors in 2023 and 2028
    • 5.5 Threat of substitutes
      • Threat of substitutes - Impact of key factors in 2023 and 2028
    • 5.6 Threat of rivalry
      • Threat of rivalry - Impact of key factors in 2023 and 2028
    • 5.7 Market condition
      • Chart on Market condition - Five forces 2023 and 2028

    6 Market Segmentation by Route Of Administration

    • 6.1 Market segments
      • Chart on Route Of Administration - Market share (2023-2028) (%)
      • Data Table on Route Of Administration - Market share (2023-2028) (%)
    • 6.2 Comparison by Route Of Administration
      • Chart on Comparison by Route Of Administration
      • Data Table on Comparison by Route Of Administration
    • 6.3 Oral - Market size and forecast (2023-2028)
      • Chart on Oral - Market size and forecast (2023-2028) ($ million)
      • Data Table on Oral - Market size and forecast (2023-2028) ($ million)
      • Chart on Oral - Year-over-year growth (2023-2028) (%)
      • Data Table on Oral - Year-over-year growth (2023-2028) (%)
    • 6.4 Topical - Market size and forecast (2023-2028)
      • Chart on Topical - Market size and forecast (2023-2028) ($ million)
      • Data Table on Topical - Market size and forecast (2023-2028) ($ million)
      • Chart on Topical - Year-over-year growth (2023-2028) (%)
      • Data Table on Topical - Year-over-year growth (2023-2028) (%)
    • 6.5 Injectable - Market size and forecast (2023-2028)
      • Chart on Injectable - Market size and forecast (2023-2028) ($ million)
      • Data Table on Injectable - Market size and forecast (2023-2028) ($ million)
      • Chart on Injectable - Year-over-year growth (2023-2028) (%)
      • Data Table on Injectable - Year-over-year growth (2023-2028) (%)
    • 6.6 Market opportunity by Route Of Administration
      • Market opportunity by Route Of Administration ($ million)
      • Data Table on Market opportunity by Route Of Administration ($ million)

    7 Market Segmentation by Drug Class

    • 7.1 Market segments
      • Chart on Drug Class - Market share (2023-2028) (%)
      • Data Table on Drug Class - Market share (2023-2028) (%)
    • 7.2 Comparison by Drug Class
      • Chart on Comparison by Drug Class
      • Data Table on Comparison by Drug Class
    • 7.3 Biologics - Market size and forecast (2023-2028)
      • Chart on Biologics - Market size and forecast (2023-2028) ($ million)
      • Data Table on Biologics - Market size and forecast (2023-2028) ($ million)
      • Chart on Biologics - Year-over-year growth (2023-2028) (%)
      • Data Table on Biologics - Year-over-year growth (2023-2028) (%)
    • 7.4 PDE4 inhibitors - Market size and forecast (2023-2028)
      • Chart on PDE4 inhibitors - Market size and forecast (2023-2028) ($ million)
      • Data Table on PDE4 inhibitors - Market size and forecast (2023-2028) ($ million)
      • Chart on PDE4 inhibitors - Year-over-year growth (2023-2028) (%)
      • Data Table on PDE4 inhibitors - Year-over-year growth (2023-2028) (%)
    • 7.5 Corticosteroids - Market size and forecast (2023-2028)
      • Chart on Corticosteroids - Market size and forecast (2023-2028) ($ million)
      • Data Table on Corticosteroids - Market size and forecast (2023-2028) ($ million)
      • Chart on Corticosteroids - Year-over-year growth (2023-2028) (%)
      • Data Table on Corticosteroids - Year-over-year growth (2023-2028) (%)
    • 7.6 Calcineurin inhibitors - Market size and forecast (2023-2028)
      • Chart on Calcineurin inhibitors - Market size and forecast (2023-2028) ($ million)
      • Data Table on Calcineurin inhibitors - Market size and forecast (2023-2028) ($ million)
      • Chart on Calcineurin inhibitors - Year-over-year growth (2023-2028) (%)
      • Data Table on Calcineurin inhibitors - Year-over-year growth (2023-2028) (%)
    • 7.7 Market opportunity by Drug Class
      • Market opportunity by Drug Class ($ million)
      • Data Table on Market opportunity by Drug Class ($ million)

    8 Customer Landscape

    • 8.1 Customer landscape overview
      • Analysis of price sensitivity, lifecycle, customer purchase basket, adoption rates, and purchase criteria

    9 Geographic Landscape

    • 9.1 Geographic segmentation
      • Chart on Market share by geography 2023-2028 (%)
      • Data Table on Market share by geography 2023-2028 (%)
    • 9.2 Geographic comparison
      • Chart on Geographic comparison
      • Data Table on Geographic comparison
    • 9.3 North America - Market size and forecast 2023-2028
      • Chart on North America - Market size and forecast 2023-2028 ($ million)
      • Data Table on North America - Market size and forecast 2023-2028 ($ million)
      • Chart on North America - Year-over-year growth 2023-2028 (%)
      • Data Table on North America - Year-over-year growth 2023-2028 (%)
    • 9.4 Europe - Market size and forecast 2023-2028
      • Chart on Europe - Market size and forecast 2023-2028 ($ million)
      • Data Table on Europe - Market size and forecast 2023-2028 ($ million)
      • Chart on Europe - Year-over-year growth 2023-2028 (%)
      • Data Table on Europe - Year-over-year growth 2023-2028 (%)
    • 9.5 Asia - Market size and forecast 2023-2028
      • Chart on Asia - Market size and forecast 2023-2028 ($ million)
      • Data Table on Asia - Market size and forecast 2023-2028 ($ million)
      • Chart on Asia - Year-over-year growth 2023-2028 (%)
      • Data Table on Asia - Year-over-year growth 2023-2028 (%)
    • 9.6 Rest of World (ROW) - Market size and forecast 2023-2028
      • Chart on Rest of World (ROW) - Market size and forecast 2023-2028 ($ million)
      • Data Table on Rest of World (ROW) - Market size and forecast 2023-2028 ($ million)
      • Chart on Rest of World (ROW) - Year-over-year growth 2023-2028 (%)
      • Data Table on Rest of World (ROW) - Year-over-year growth 2023-2028 (%)
    • 9.7 US - Market size and forecast 2023-2028
      • Chart on US - Market size and forecast 2023-2028 ($ million)
      • Data Table on US - Market size and forecast 2023-2028 ($ million)
      • Chart on US - Year-over-year growth 2023-2028 (%)
      • Data Table on US - Year-over-year growth 2023-2028 (%)
    • 9.8 Canada - Market size and forecast 2023-2028
      • Chart on Canada - Market size and forecast 2023-2028 ($ million)
      • Data Table on Canada - Market size and forecast 2023-2028 ($ million)
      • Chart on Canada - Year-over-year growth 2023-2028 (%)
      • Data Table on Canada - Year-over-year growth 2023-2028 (%)
    • 9.9 Germany - Market size and forecast 2023-2028
      • Chart on Germany - Market size and forecast 2023-2028 ($ million)
      • Data Table on Germany - Market size and forecast 2023-2028 ($ million)
      • Chart on Germany - Year-over-year growth 2023-2028 (%)
      • Data Table on Germany - Year-over-year growth 2023-2028 (%)
    • 9.10 UK - Market size and forecast 2023-2028
      • Chart on UK - Market size and forecast 2023-2028 ($ million)
      • Data Table on UK - Market size and forecast 2023-2028 ($ million)
      • Chart on UK - Year-over-year growth 2023-2028 (%)
      • Data Table on UK - Year-over-year growth 2023-2028 (%)
    • 9.11 China - Market size and forecast 2023-2028
      • Chart on China - Market size and forecast 2023-2028 ($ million)
      • Data Table on China - Market size and forecast 2023-2028 ($ million)
      • Chart on China - Year-over-year growth 2023-2028 (%)
      • Data Table on China - Year-over-year growth 2023-2028 (%)
    • 9.12 Market opportunity by geography
      • Market opportunity by geography ($ million)
      • Data Tables on Market opportunity by geography ($ million)
    • 9.13 Italy - Market size and forecast (2023-2028)
      • Chart on Italy - Market size and forecast (2023-2028) ($ million)
      • Data Table on Italy - Market size and forecast (2023-2028) ($ million)
      • Chart on Italy - Year-over-year growth (2023-2028) (%)
      • Data Table on Italy - Year-over-year growth (2023-2028) (%)
    • 9.14 France - Market size and forecast (2023-2028)
      • Chart on France - Market size and forecast (2023-2028) ($ million)
      • Data Table on France - Market size and forecast (2023-2028) ($ million)
      • Chart on France - Year-over-year growth (2023-2028) (%)
      • Data Table on France - Year-over-year growth (2023-2028) (%)
    • 9.15 India - Market size and forecast (2023-2028)
      • Chart on India - Market size and forecast (2023-2028) ($ million)
      • Data Table on India - Market size and forecast (2023-2028) ($ million)
      • Chart on India - Year-over-year growth (2023-2028) (%)
      • Data Table on India - Year-over-year growth (2023-2028) (%)
    • 9.16 Japan - Market size and forecast (2023-2028)
      • Chart on Japan - Market size and forecast (2023-2028) ($ million)
      • Data Table on Japan - Market size and forecast (2023-2028) ($ million)
      • Chart on Japan - Year-over-year growth (2023-2028) (%)
      • Data Table on Japan - Year-over-year growth (2023-2028) (%)
    • 9.17 Brazil - Market size and forecast (2023-2028)
      • Chart on Brazil - Market size and forecast (2023-2028) ($ million)
      • Data Table on Brazil - Market size and forecast (2023-2028) ($ million)
      • Chart on Brazil - Year-over-year growth (2023-2028) (%)
      • Data Table on Brazil - Year-over-year growth (2023-2028) (%)
    • 9.18 Egypt - Market size and forecast (2023-2028)
      • Chart on Egypt - Market size and forecast (2023-2028) ($ million)
      • Data Table on Egypt - Market size and forecast (2023-2028) ($ million)
      • Chart on Egypt - Year-over-year growth (2023-2028) (%)
      • Data Table on Egypt - Year-over-year growth (2023-2028) (%)
    • 9.19 UAE - Market size and forecast (2023-2028)
      • Chart on UAE - Market size and forecast (2023-2028) ($ million)
      • Data Table on UAE - Market size and forecast (2023-2028) ($ million)
      • Chart on UAE - Year-over-year growth (2023-2028) (%)
      • Data Table on UAE - Year-over-year growth (2023-2028) (%)
    • 9.20 Oman - Market size and forecast (2023-2028)
      • Chart on Oman - Market size and forecast (2023-2028) ($ million)
      • Data Table on Oman - Market size and forecast (2023-2028) ($ million)
      • Chart on Oman - Year-over-year growth (2023-2028) (%)
      • Data Table on Oman - Year-over-year growth (2023-2028) (%)
    • 9.21 Argentina - Market size and forecast (2023-2028)
      • Chart on Argentina - Market size and forecast (2023-2028) ($ million)
      • Data Table on Argentina - Market size and forecast (2023-2028) ($ million)
      • Chart on Argentina - Year-over-year growth (2023-2028) (%)
      • Data Table on Argentina - Year-over-year growth (2023-2028) (%)
    • 9.22 KSA - Market size and forecast (2023-2028)
      • Chart on KSA - Market size and forecast (2023-2028) ($ million)
      • Data Table on KSA - Market size and forecast (2023-2028) ($ million)
      • Chart on KSA - Year-over-year growth (2023-2028) (%)
      • Data Table on KSA - Year-over-year growth (2023-2028) (%)

    10 Drivers, Challenges, and Opportunity/Restraints

    • 10.1 Market drivers
      • 10.2 Market challenges
        • 10.3 Impact of drivers and challenges
          • Impact of drivers and challenges in 2023 and 2028
        • 10.4 Market opportunities/restraints

          11 Competitive Landscape

          • 11.1 Overview
            • 11.2 Competitive Landscape
              • Overview on criticality of inputs and factors of differentiation
            • 11.3 Landscape disruption
              • Overview on factors of disruption
            • 11.4 Industry risks
              • Impact of key risks on business

            12 Competitive Analysis

            • 12.1 Companies profiled
              • Companies covered
            • 12.2 Market positioning of companies
              • Matrix on companies position and classification
            • 12.3 AbbVie Inc.
              • AbbVie Inc. - Overview
              • AbbVie Inc. - Product / Service
              • AbbVie Inc. - Key news
              • AbbVie Inc. - Key offerings
            • 12.4 Arcutis Biotherapeutics Inc.
              • Arcutis Biotherapeutics Inc. - Overview
              • Arcutis Biotherapeutics Inc. - Product / Service
              • Arcutis Biotherapeutics Inc. - Key news
              • Arcutis Biotherapeutics Inc. - Key offerings
            • 12.5 Bausch Health Companies Inc.
              • Bausch Health Companies Inc. - Overview
              • Bausch Health Companies Inc. - Business segments
              • Bausch Health Companies Inc. - Key news
              • Bausch Health Companies Inc. - Key offerings
              • Bausch Health Companies Inc. - Segment focus
            • 12.6 Bristol Myers Squibb Co.
              • Bristol Myers Squibb Co. - Overview
              • Bristol Myers Squibb Co. - Product / Service
              • Bristol Myers Squibb Co. - Key news
              • Bristol Myers Squibb Co. - Key offerings
            • 12.7 Eli Lilly and Co.
              • Eli Lilly and Co. - Overview
              • Eli Lilly and Co. - Product / Service
              • Eli Lilly and Co. - Key news
              • Eli Lilly and Co. - Key offerings
            • 12.8 Evelo Biosciences Inc.
              • Evelo Biosciences Inc. - Overview
              • Evelo Biosciences Inc. - Product / Service
              • Evelo Biosciences Inc. - Key offerings
            • 12.9 Galderma SA
              • Galderma SA - Overview
              • Galderma SA - Product / Service
              • Galderma SA - Key offerings
            • 12.10 Incyte Corp.
              • Incyte Corp. - Overview
              • Incyte Corp. - Product / Service
              • Incyte Corp. - Key offerings
            • 12.11 LEO Pharma AS
              • LEO Pharma AS - Overview
              • LEO Pharma AS - Business segments
              • LEO Pharma AS - Key offerings
              • LEO Pharma AS - Segment focus
            • 12.12 Maruho Co. Ltd.
              • Maruho Co. Ltd. - Overview
              • Maruho Co. Ltd. - Product / Service
              • Maruho Co. Ltd. - Key news
              • Maruho Co. Ltd. - Key offerings
            • 12.13 Novartis AG
              • Novartis AG - Overview
              • Novartis AG - Business segments
              • Novartis AG - Key news
              • Novartis AG - Key offerings
              • Novartis AG - Segment focus
            • 12.14 Otsuka Holdings Co. Ltd.
              • Otsuka Holdings Co. Ltd. - Overview
              • Otsuka Holdings Co. Ltd. - Business segments
              • Otsuka Holdings Co. Ltd. - Key offerings
              • Otsuka Holdings Co. Ltd. - Segment focus
            • 12.15 Pfizer Inc.
              • Pfizer Inc. - Overview
              • Pfizer Inc. - Product / Service
              • Pfizer Inc. - Key news
              • Pfizer Inc. - Key offerings
            • 12.16 Sanofi SA
              • Sanofi SA - Overview
              • Sanofi SA - Business segments
              • Sanofi SA - Key news
              • Sanofi SA - Key offerings
              • Sanofi SA - Segment focus
            • 12.17 Viatris Inc.
              • Viatris Inc. - Overview
              • Viatris Inc. - Business segments
              • Viatris Inc. - Key news
              • Viatris Inc. - Key offerings
              • Viatris Inc. - Segment focus

            13 Appendix

            • 13.1 Scope of the report
              • 13.2 Inclusions and exclusions checklist
                • Inclusions checklist
                • Exclusions checklist
              • 13.3 Currency conversion rates for US$
                • Currency conversion rates for US$
              • 13.4 Research methodology
                • Research methodology
              • 13.5 Data procurement
                • Information sources
              • 13.6 Data validation
                • Data validation
              • 13.7 Validation techniques employed for market sizing
                • Validation techniques employed for market sizing
              • 13.8 Data synthesis
                • Data synthesis
              • 13.9 360 degree market analysis
                • 360 degree market analysis
              • 13.10 List of abbreviations
                • List of abbreviations

              Research Methodology

              Technavio presents a detailed picture of the market by way of study, synthesis, and summation of data from multiple sources. The analysts have presented the various facets of the market with a particular focus on identifying the key industry influencers. The data thus presented is comprehensive, reliable, and the result of extensive research, both primary and secondary.

              INFORMATION SOURCES

              Primary sources

              • Manufacturers and suppliers
              • Channel partners
              • Industry experts
              • Strategic decision makers

              Secondary sources

              • Industry journals and periodicals
              • Government data
              • Financial reports of key industry players
              • Historical data
              • Press releases

              DATA ANALYSIS

              Data Synthesis

              • Collation of data
              • Estimation of key figures
              • Analysis of derived insights

              Data Validation

              • Triangulation with data models
              • Reference against proprietary databases
              • Corroboration with industry experts

              REPORT WRITING

              Qualitative

              • Market drivers
              • Market challenges
              • Market trends
              • Five forces analysis

              Quantitative

              • Market size and forecast
              • Market segmentation
              • Geographical insights
              • Competitive landscape

              Interested in this report?

              Get your sample now to see our research methodology and insights!

              Download Now

              Frequently Asked Questions

              Atopic Dermatitis Drugs market growth will increase by $ 6204.8 mn during 2024-2028 .

              The Atopic Dermatitis Drugs market is expected to grow at a CAGR of 10.87% during 2024-2028 .

              Atopic Dermatitis Drugs market is segmented by Route Of Administration( Oral, Topical, Injectable) Drug Class( Biologics, PDE4 inhibitors, Corticosteroids, Calcineurin inhibitors)

              AbbVie Inc., Arcutis Biotherapeutics Inc., Asana BioSciences LLC, Astellas Pharma Inc., Bausch Health Companies Inc., Bayer AG, BiomX Inc., Bristol Myers Squibb Co., Dermavant Sciences Inc., Eli Lilly and Co., Evelo Biosciences Inc., Galderma SA, Incyte Corp., LEO Pharma AS, Maruho Co. Ltd., Novartis AG, Otsuka Holdings Co. Ltd., Pfizer Inc., Sanofi SA, Viatris Inc. are a few of the key vendors in the Atopic Dermatitis Drugs market.

              North America will register the highest growth rate of 37% among the other regions. Therefore, the Atopic Dermatitis Drugs market in North America is expected to garner significant business opportunities for the vendors during the forecast period.

              US, Canada, Germany, UK, Italy, France, China, India, Japan, Brazil, Egypt, UAE, Oman, Argentina, KSA

              • High prevalence of atopic dermatitisThere is a high prevalence of atopic dermatitis globally. Atopic dermatitis can be attributed to or aggravated by several factors is the driving factor this market.
              • including exposure to allergens such as peanuts is the driving factor this market.
              • pollen is the driving factor this market.
              • or pet dander; skin irritants such as household cleaners; some types of fabrics is the driving factor this market.
              • or soaps; and stress is the driving factor this market.
              • dry skin is the driving factor this market.
              • and infections. Around 18 million patients with atopic dermatitis currently live in the US alone. In the US is the driving factor this market.
              • around 9-10 million children aged under 18 years are estimated to have atopic dermatitis is the driving factor this market.
              • of which around one-third have a moderate-to-severe form of the disease. Such a large patient pool presents a significant opportunity for the growth of the global atopic dermatitis drugs market. The large patient cohort requires multiple visits to dermatologists and the use of numerous medications for the treatment of atopic dermatitis is the driving factor this market.
              • which consequently drives the market growth. Asia also hosts a huge patient population with atopic dermatitis is the driving factor this market.
              • with China is the driving factor this market.
              • India is the driving factor this market.
              • and Japan being the top three revenue contributors to the market in the region. Developing countries is the driving factor this market.
              • such as India and China is the driving factor this market.
              • present promising market opportunities due to their large population base. According to The World Bank Group is the driving factor this market.
              • the population of China was 1.41 billion in 2022 is the driving factor this market.
              • while that of India was 1.42 billion in the same year. Therefore is the driving factor this market.
              • the high prevalence of atopic dermatitis is expected to drive the growth of the global atopic dermatitis drugs market during the forecast period. is the driving factor this market.

              The Atopic Dermatitis Drugs market vendors should focus on grabbing business opportunities from the Oral segment as it accounted for the largest market share in the base year.