Automated Feeding Systems Market Analysis, Size, and Forecast 2026-2030: Europe (Germany, UK, and France), North America (US, Canada, and Mexico), APAC (China, Japan, and India), South America (Brazil, Argentina, and Chile), Middle East and Africa (Saudi Arabia, UAE, and South Africa), and Rest of World (ROW)

Automated Feeding Systems Market Analysis, Size, and Forecast 2026-2030:
Europe (Germany, UK, and France), North America (US, Canada, and Mexico), APAC (China, Japan, and India), South America (Brazil, Argentina, and Chile), Middle East and Africa (Saudi Arabia, UAE, and South Africa), and Rest of World (ROW)

Published: Oct 2026 294 Pages SKU: IRTNTR71729

Market Overview at a Glance

$5.71 B
Market Opportunity
10.8%
CAGR 2025 - 2030
36.7%
Europe Growth
$5.00 B
Conveyor segment 2024

Automated Feeding Systems Market Size 2026-2030

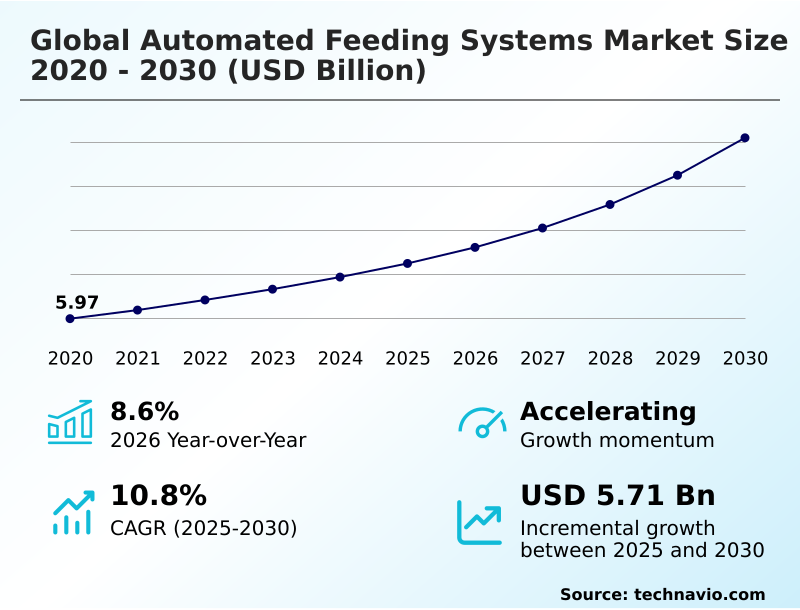
The automated feeding systems market size is valued to increase by USD 5.71 billion, at a CAGR of 10.8% from 2025 to 2030. Technological integration through advanced digital connectivity will drive the automated feeding systems market.

Major Market Trends & Insights

  • Europe dominated the market and accounted for a 36.7% growth during the forecast period.
  • By Type - Conveyor segment was valued at USD 5.00 billion in 2024
  • By Product - Hardware segment accounted for the largest market revenue share in 2024

Market Size & Forecast

  • Market Opportunities: USD 8.23 billion
  • Market Future Opportunities: USD 5.71 billion
  • CAGR from 2025 to 2030 : 10.8%

Market Summary

  • The Automated Feeding Systems Market exhibits robust expansion driven by the critical need for precision nutrition and profound labor shortages across commercial livestock operations. Supply chain optimization within modern mega-dairies increasingly relies on synchronized feed delivery, where autonomous distribution networks seamlessly interface with centralized herd management platforms to ensure consistent nutritional intake.
  • Facilities transitioning from manual routines to robotic dispensing report a 25% reduction in feed wastage, directly lowering raw ingredient procurement costs. The integration of advanced telemetry and machine learning serves as a primary market driver, enabling dynamic ration adjustments based on real-time physiological feedback to maximize milk and meat yields.
  • Conversely, prohibitive initial capital expenditure poses a severe challenge, as independent producers often struggle to secure the financing required for extensive facility retrofits and sensor installations. The deployment of precision metering gates prevents resource depletion while ensuring optimal herd health.
  • Operational intelligence generated through these interconnected systems allows farm operators to mitigate environmental impacts and maintain strict compliance with tightening ecological regulations.

What will be the Size of the Automated Feeding Systems Market during the forecast period?
Get Key Insights on Market Forecast (PDF) Get Free Sample

How is the Automated Feeding Systems Market Segmented?

The automated feeding systems industry research report provides comprehensive data (region-wise segment analysis), with forecasts and estimates in "USD million" for the period 2026-2030, as well as historical data from 2020-2024 for the following segments.

  • Type
    • Conveyor
    • Self-propelled
  • Product
    • Hardware
    • Software
    • Services
  • Animal type
    • Ruminants
    • Poultry
    • Swine
    • Others
  • Geography
    • Europe
      • Germany
      • UK
      • France
      • The Netherlands
      • Italy
      • Spain
    • North America
      • US
      • Canada
      • Mexico
    • APAC
      • China
      • Japan
      • India
      • South Korea
      • Australia
      • Indonesia
    • South America
      • Brazil
      • Argentina
      • Chile
    • Middle East and Africa
      • Saudi Arabia
      • UAE
      • South Africa
      • Israel
      • Turkey

By Type Insights

The conveyor segment is estimated to witness significant growth during the forecast period.

The conveyor segment within the Automated Feeding Systems sector provides foundational infrastructure engineered to transport large volumes of mixed rations from central storage directly to designated feeding troughs.

This mechanical architecture is highly favored in intensive livestock operations where rapid, uniform distribution is critical to minimizing animal stress. By integrating automated belts and augers, agricultural enterprises achieve consistent feed delivery with minimal manual intervention.

The integration of advanced feed flow rate sensors and precision feed metering gates enhances operational control, reducing feed spillage significantly. Facilities implementing these systems report a 15% improvement in overall nutrient utilization efficiency compared to traditional manual distribution methods.

Furthermore, the robust, fixed nature of these networks ensures structural durability, seamlessly supporting centralized nutritional management and total mixed ration systems across massive commercial housing complexes.
Get Free Sample

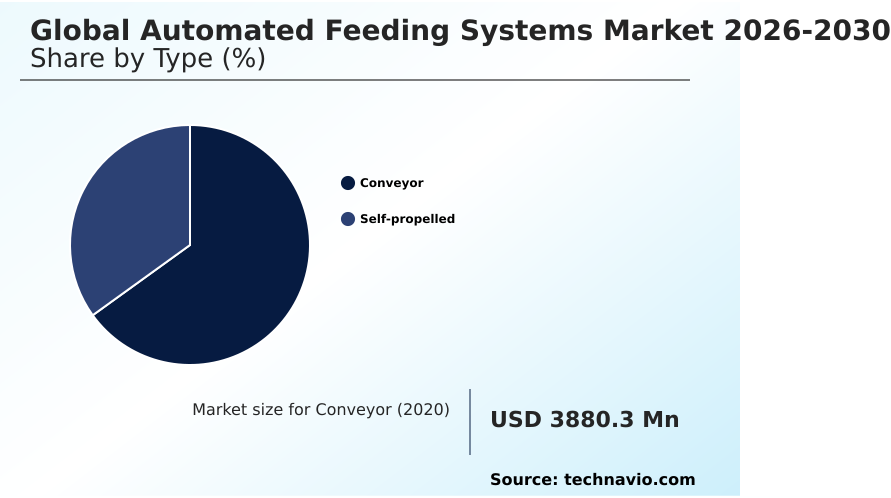
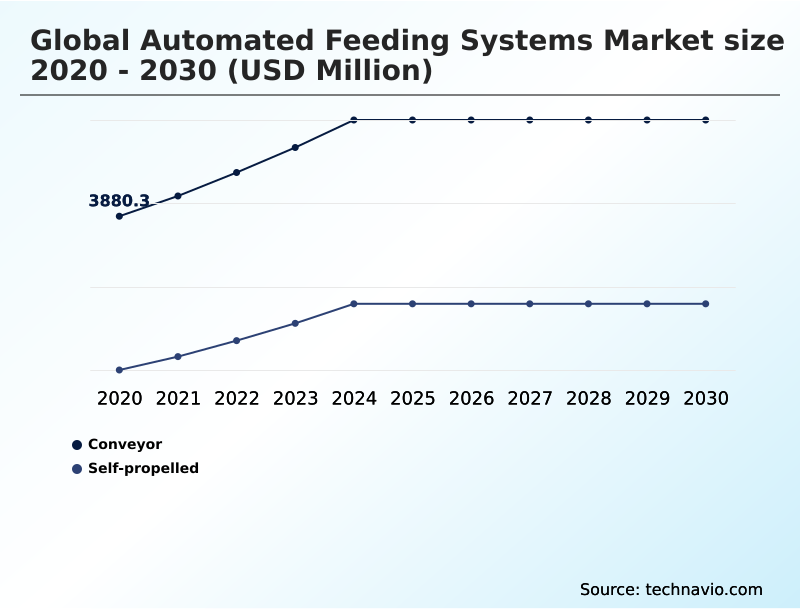
The Conveyor segment was valued at USD 5.00 billion in 2024 and showed a gradual increase during the forecast period.
Get Free Sample

Regional Analysis

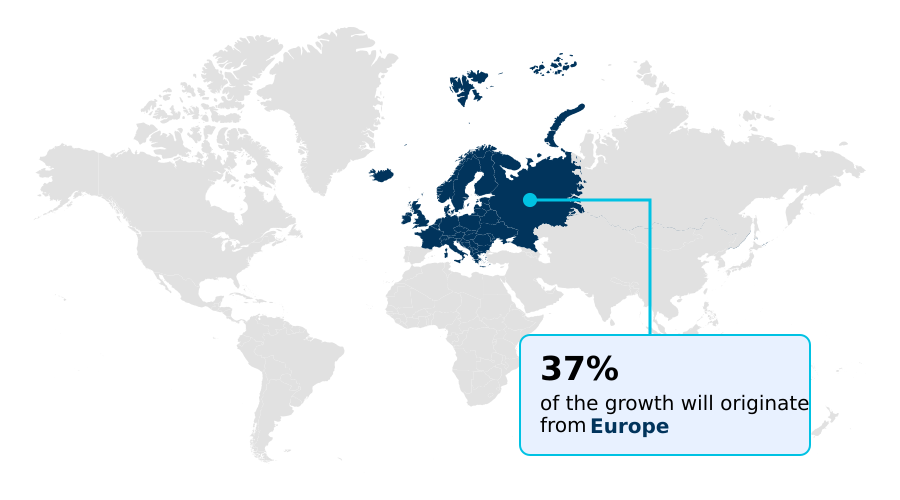
Europe is estimated to contribute 36.7% to the growth of the global market during the forecast period.Technavio’s analysts have elaborately explained the regional trends and drivers that shape the market during the forecast period.
See How Automated Feeding Systems Market Demand is Rising in Europe Get Free Sample

The geographic landscape of the Automated Feeding Systems sector highlights stark contrasts in technological adoption between Europe and APAC.

Europe leads with highly integrated smart farming infrastructure, where stringent environmental mandates force producers to deploy automated dry feeding dispensers and telemetry dashboards, achieving a 30% reduction in nutrient runoff.

In contrast, APAC is experiencing rapid industrialization, transitioning from fragmented operations to commercial complexes, yielding a 40% faster adoption rate of foundational pneumatic feeding networks and automated pan feeding systems.

European facilities prioritize biosecurity protocol compliance and greenhouse gas emission tracking, utilizing advanced data analytics to refine herd nutrition.

Meanwhile, commercial farms in APAC focus heavily on scaling capacity to combat labor shortages, leveraging sensor based monitoring networks to lower daily operational costs by 15%.

This regional divergence demonstrates how differing regulatory pressures and labor dynamics dictate specific modernization strategies across agricultural supply chains.

Market Dynamics

Our researchers analyzed the data with 2025 as the base year, along with the key drivers, trends, and challenges. A holistic analysis of drivers will help companies refine their marketing strategies to gain a competitive advantage.

  • Modern agricultural enterprises face mounting pressures to optimize resource allocation, making improving livestock feed conversion efficiency a critical priority for commercial viability. By transitioning to interconnected digital ecosystems, operators are leveraging cloud based herd nutritional monitoring to gain unprecedented visibility into daily consumption patterns.
  • The deployment of autonomous robotic livestock ration distribution systems significantly outperforms traditional manual delivery, offering an estimated 35% improvement in operational scheduling accuracy. Furthermore, the integration of IoT sensors for precision agriculture enables farm managers to dynamically adjust formulations, drastically optimizing total mixed ration delivery across vast housing facilities.
  • For specialized swine operations, advanced electronic sow feeding management systems prevent feed competition and ensure individualized nutrition, while simultaneously reducing greenhouse gas from livestock through precise nutrient utilization. Similarly, automated poultry pan feeding infrastructure minimizes spillage and supports uniform flock growth.
  • The application of predictive analytics in livestock farming and machine vision for livestock feeding allows for proactive health management, preempting metabolic disorders before they impact overall yield. Facilities utilizing smart silo inventory management software seamlessly coordinate supply chain logistics with rail guided livestock feeding networks, eliminating disruptive feed shortages.
  • Concurrently, biometric tracking for dairy cows syncs with telemetry enabled agricultural equipment management to fine-tune energy intake. The implementation of automated liquid feed dispensing systems alongside precision livestock nutrition adjustment algorithms ensures that every dietary phase is meticulously calibrated, cementing long-term operational resilience and regulatory compliance across diverse farming environments.
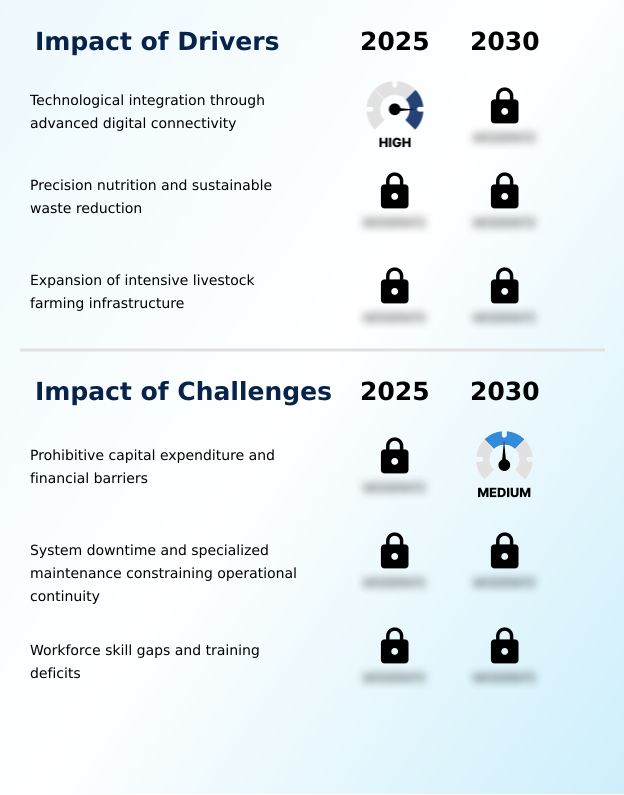
What are the key market drivers leading to the rise in the adoption of Automated Feeding Systems Industry?

  • Technological integration through advanced digital connectivity serves as a primary market driver by establishing highly synchronized, data-driven agricultural management environments.

  • Severe shortages of skilled agricultural labor combined with escalating wage pressures serve as the primary catalysts accelerating mechanization across commercial livestock facilities. Traditional manual distribution methods consistently fail to meet the rigorous consistency required for modern high-yield farming.
  • The deployment of autonomous mobile robots and rail guided distribution units eliminates dependency on manual labor, driving a 35% reduction in routine operational overhead.
  • This mechanical consistency directly impacts businesses by minimizing costly human errors in total mixed ration systems, leading to a 20% enhancement in nutrient utilization efficiency.
  • Furthermore, integrating automated dry feeding dispensers with livestock behavior analytics allows farm managers to preemptively address nutritional deficiencies. This technological synergy ensures continuous feed availability, improving daily livestock weight gain by 12% and securing long-term financial resilience.

What are the market trends shaping the Automated Feeding Systems Industry?

  • The accelerated adoption of automated systems to offset persistent labor volatility represents a prominent market trend. This shift significantly enhances operational continuity across commercial agricultural facilities.

  • The transition toward highly individualized animal nutrition strategies represents a profound structural trend reshaping commercial agriculture. Operators are rapidly replacing generalized flock management with precise livestock biometric tracking systems to optimize growth cycles. The implementation of electronic sow feeding and automated liquid feeding allows facilities to adjust rations dynamically, reducing nutrient excretion by 22%.
  • This shift is driven by strict environmental compliance mandates forcing businesses to monitor rumen health optimization closely. Consequently, farms utilizing machine vision guidance and cloud connected hardware report a 30% reduction in unexpected dietary health interventions. By analyzing real-time consumption data, agribusinesses effectively lower raw material waste, improving overall operational profitability by 15%.
  • This continuous data loop ensures that predictive maintenance algorithms safeguard mechanical uptime, fundamentally transforming traditional barns into highly responsive, data-driven production environments.

What challenges does the Automated Feeding Systems Industry face during its growth?

  • Prohibitive capital expenditure and persistent financial barriers pose significant challenges to industry growth, particularly for independent producers managing tight profit margins.

  • Prohibitive initial capital expenditures and complex technical integration bottlenecks significantly constrain the widespread modernization of mid-sized agricultural enterprises. Integrating sophisticated sensor based monitoring networks and pneumatic feeding networks into legacy barn structures demands extensive electrical and plumbing modifications. These structural barriers often result in a 25% increase in total installation costs, deterring independent producers operating on thin margins.
  • Additionally, rural regions frequently lack specialized technical personnel required to maintain advanced corrosion resistant alloys and repair proprietary IoT telemetry integration modules. When synchronization failures occur within automated pan feeding setups, facilities experience severe operational disruptions, causing a 15% drop in feed delivery efficiency.
  • The persistent skills gap in digital agriculture forces operators to over-rely on factory defaults, limiting the potential optimization of livestock stress reduction protocols.

Exclusive Technavio Analysis on Customer Landscape

The automated feeding systems market forecasting report includes the adoption lifecycle of the market, covering from the innovator’s stage to the laggard’s stage. It focuses on adoption rates in different regions based on penetration. Furthermore, the automated feeding systems market report also includes key purchase criteria and drivers of price sensitivity to help companies evaluate and develop their market growth analysis strategies.
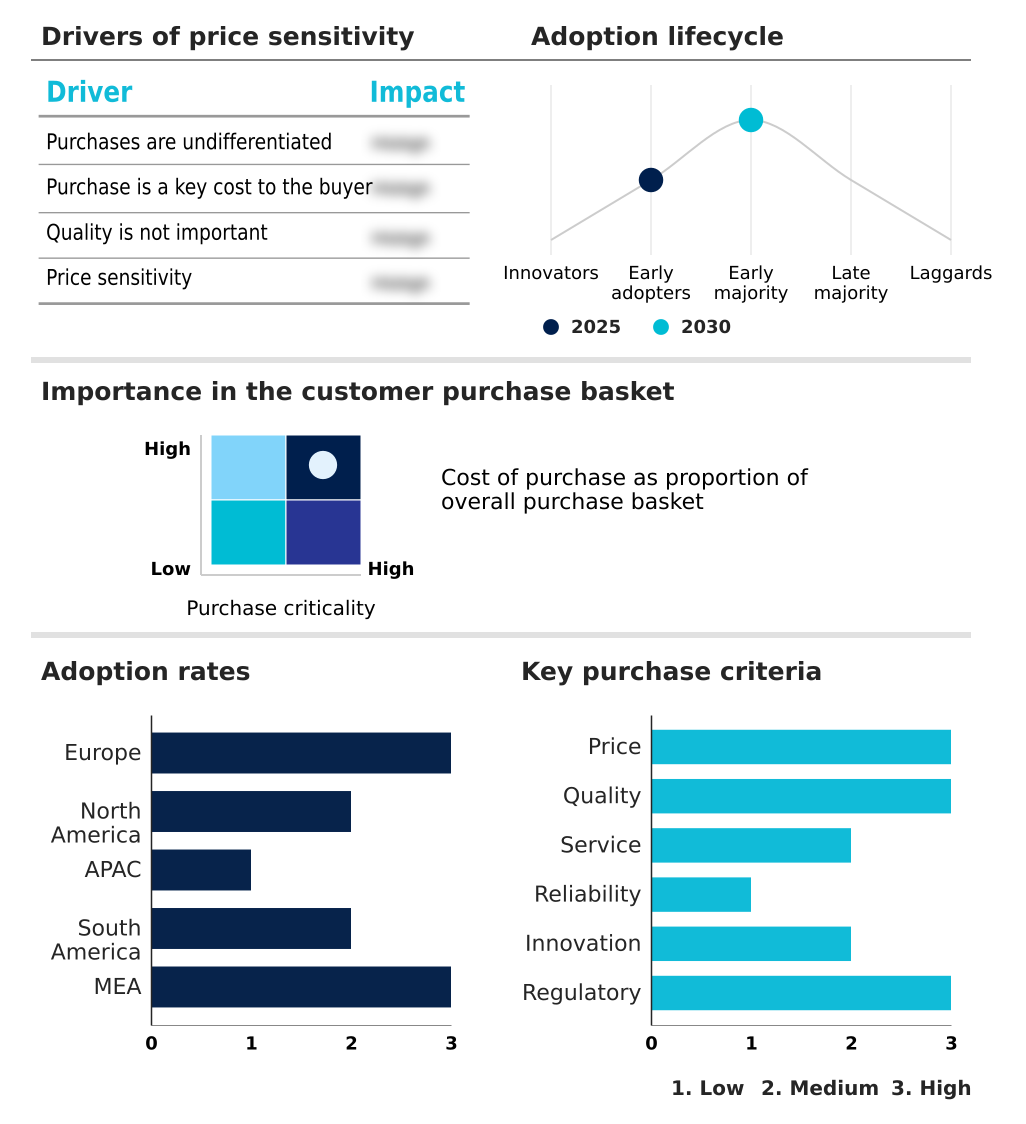
Customer Landscape of Automated Feeding Systems Industry

Competitive Landscape

Companies are implementing various strategies, such as strategic alliances, automated feeding systems market forecast, partnerships, mergers and acquisitions, geographical expansion, and product/service launches, to enhance their presence in the industry.

Afimilk Ltd. - This provider delivers comprehensive dairy automation solutions integrating advanced software and precision dispensing equipment to optimize herd nutrition and streamline daily livestock management routines.

The industry research and growth report includes detailed analyses of the competitive landscape of the market and information about key companies, including:

  • Afimilk Ltd.
  • Big Dutchman AG Holding
  • BouMatic LLC
  • Dairymaster
  • DeLaval International AB
  • Delmer Group
  • Fancom BV
  • Faresin Industries Spa
  • FFF Systems Inc.
  • Gartech Equipments Pvt. Ltd.
  • Hetwin Automation Systems Gmbh
  • Lely International N.V
  • MS Automated LLC
  • Nedap NV
  • RNA Automation Ltd.
  • Rovibec Agrisolutions
  • Schauer Agrotronic GmbH
  • Sgariboldi S.r.l.
  • Trioliet BV
  • Valmetal Inc.
  • VDL Agrotech BV

Qualitative and quantitative analysis of companies has been conducted to help clients understand the wider business environment as well as the strengths and weaknesses of key industry players. Data is qualitatively analyzed to categorize companies as pure play, category-focused, industry-focused, and diversified; it is quantitatively analyzed to categorize companies as dominant, leading, strong, tentative, and weak.

Recent Development and News in Automated feeding systems market

  • In the Agricultural and Farm Machinery industry, the transition toward smart farming infrastructure and IoT telemetry integration established unified data standards across equipment types, directly impacting Automated Feeding Systems demand by enabling seamless synchronization with milking parlors and livestock behavior analytics platforms to achieve a 20% gain in operational synchronization.
  • Strict ecological mandates in Europe targeting agricultural runoff forced manufacturers to develop precision dispensing architectures, directly accelerating the adoption of Automated Feeding Systems equipped with sensor based monitoring networks that guarantee precise portion control and improve nutrient utilization efficiency by up to 18%.
  • The consolidation of independent farms into mega-dairies across North America necessitated robust mechanical distribution solutions, driving the integration of automated mixing wagons and rail guided distribution units to maintain consistent nutritional delivery while mitigating a 30% reduction in available rural labor.
  • Advancements in machine learning architectures for heavy agricultural equipment enhanced predictive maintenance algorithms, directly benefiting Automated Feeding Systems by reducing unexpected mechanical downtime by 25% and ensuring continuous precision ration distribution in intensive controlled environment agriculture facilities.

Dive into Technavio’s robust research methodology, blending expert interviews, extensive data synthesis, and validated models for unparalleled Automated Feeding Systems Market insights. See full methodology.

Market Scope
Page number 294
Base year 2025
Historic period 2020-2024
Forecast period 2026-2030
Growth momentum & CAGR Accelerate at a CAGR of 10.8%
Market growth 2026-2030 USD 5712.2 million
Market structure Fragmented
YoY growth 2025-2026(%) 8.6%
Key countries Germany, UK, France, The Netherlands, Italy, Spain, US, Canada, Mexico, China, Japan, India, South Korea, Australia, Indonesia, Brazil, Argentina, Chile, Saudi Arabia, UAE, South Africa, Israel and Turkey
Competitive landscape Leading Companies, Market Positioning of Companies, Competitive Strategies, and Industry Risks

Request Free Sample

Research Analyst Overview

  • The Automated Feeding Systems sector continuously evolves to address acute labor deficits and tightening ecological mandates across commercial agriculture. Precision livestock farming frameworks increasingly rely on synchronized mechanical architecture to execute exact nutritional strategies without manual intervention.
  • By deploying robotic feed pushers and automated mixing wagons, facility operators ensure constant feed availability, which fundamentally optimizes the feed conversion ratio across large-scale herds. The integration of radio frequency identification tags with herd management platforms enables individualized dietary tracking, allowing enterprises to lower raw material expenditures by 20% through precise portion control.
  • This data-driven approach directly influences boardroom-level budgeting strategies, as executives prioritize resilient supply chain infrastructure over recurring manual labor costs. Furthermore, the implementation of predictive nutritional algorithms and feed flow rate sensors prevents equipment bottlenecks and minimizes costly feed degradation.
  • As intensive livestock operations transition toward autonomous workflows, the utilization of automated feed storage silos connected to real-time telemetry dashboards provides comprehensive visibility into inventory depletion, safeguarding operational continuity and maintaining strict adherence to tightening animal welfare compliance protocols.

What are the Key Data Covered in this Automated Feeding Systems Market Research and Growth Report?

  • What is the expected growth of the Automated Feeding Systems Market between 2026 and 2030?

    • USD 5.71 billion, at a CAGR of 10.8%

  • What segmentation does the market report cover?

    • The report is segmented by Type (Conveyor, and Self-propelled), Product (Hardware, Software, and Services), Animal Type (Ruminants, Poultry, Swine, and Others) and Geography (Europe, North America, APAC, South America, Middle East and Africa)

  • Which regions are analyzed in the report?

    • Europe, North America, APAC, South America and Middle East and Africa

  • What are the key growth drivers and market challenges?

    • Technological integration through advanced digital connectivity, Prohibitive capital expenditure and financial barriers

  • Who are the major players in the Automated Feeding Systems Market?

    • Afimilk Ltd., Big Dutchman AG Holding, BouMatic LLC, Dairymaster, DeLaval International AB, Delmer Group, Fancom BV, Faresin Industries Spa, FFF Systems Inc., Gartech Equipments Pvt. Ltd., Hetwin Automation Systems Gmbh, Lely International N.V, MS Automated LLC, Nedap NV, RNA Automation Ltd., Rovibec Agrisolutions, Schauer Agrotronic GmbH, Sgariboldi S.r.l., Trioliet BV, Valmetal Inc. and VDL Agrotech BV

Market Research Insights

  • The Automated Feeding Systems Market operates as a vital catalyst for operational modernization within intensive livestock production. The widespread adoption of smart farming infrastructure and IoT telemetry integration allows commercial producers to shift from reactive management to highly synchronized, data-driven workflows. Facilities implementing precision ration distribution report a 25% decrease in costly feed spillage, directly boosting operating margins.
  • Furthermore, the deployment of autonomous mobile robots mitigates severe rural labor shortages, delivering a 30% improvement in daily labor reallocation toward critical animal welfare metrics. By integrating centralized nutritional management tools, farm operators ensure exact dietary consistency, which translates into a 15% enhancement in overall nutrient utilization efficiency and strict alignment with regional ecological compliance standards.

We can help! Our analysts can customize this automated feeding systems market research report to meet your requirements.

Get in touch

1. Executive Summary

1.1 Market overview

Executive Summary - Chart on Market Overview
Executive Summary - Data Table on Market Overview
Executive Summary - Chart on Global Market Characteristics
Executive Summary - Chart on Market by Geography
Executive Summary - Chart on Market Segmentation by Type
Executive Summary - Chart on Market Segmentation by Product
Executive Summary - Chart on Market Segmentation by Animal Type
Executive Summary - Chart on Incremental Growth
Executive Summary - Data Table on Incremental Growth
Executive Summary - Chart on Company Market Positioning

2. Technavio Analysis

2.1 Analysis of price sensitivity, lifecycle, customer purchase basket, adoption rates, and purchase criteria

2.2 Criticality of inputs and Factors of differentiation

Chart on Overview on criticality of inputs and factors of differentiation

2.3 Factors of disruption

Chart on Overview on factors of disruption

2.4 Impact of drivers and challenges

Chart on Impact of drivers and challenges in 2025 and 2030

3. Market Landscape

3.1 Market ecosystem

Chart on Parent Market
Data Table on - Parent Market

3.2 Market characteristics

Chart on Market characteristics analysis

3.3 Value chain analysis

Chart on Value chain analysis

4. Market Sizing

4.1 Market definition

Data Table on Offerings of companies included in the market definition

4.2 Market segment analysis

Market segments

4.3 Market size 2025

4.4 Market outlook: Forecast for 2025-2030

Chart on Global - Market size and forecast 2025-2030 ($ million)
Data Table on Global - Market size and forecast 2025-2030 ($ million)
Chart on Global Market: Year-over-year growth 2025-2030 (%)
Data Table on Global Market: Year-over-year growth 2025-2030 (%)

5. Historic Market Size

5.1 Global Automated Feeding Systems Market 2020 - 2024

Historic Market Size - Data Table on Global Automated Feeding Systems Market 2020 - 2024 ($ million)

5.2 Type segment analysis 2020 - 2024

Historic Market Size - Type Segment 2020 - 2024 ($ million)

5.3 Product segment analysis 2020 - 2024

Historic Market Size - Product Segment 2020 - 2024 ($ million)

5.4 Animal Type segment analysis 2020 - 2024

Historic Market Size - Animal Type Segment 2020 - 2024 ($ million)

5.5 Geography segment analysis 2020 - 2024

Historic Market Size - Geography Segment 2020 - 2024 ($ million)

5.6 Country segment analysis 2020 - 2024

Historic Market Size - Country Segment 2020 - 2024 ($ million)

6. Qualitative Analysis

6.1 Impact of AI on Global Automated Feeding Systems Market

6.2 Impact of geopolitical conflicts on Global Automated Feeding Systems Market

7. Five Forces Analysis

7.1 Five forces summary

Five forces analysis - Comparison between 2025 and 2030

7.2 Bargaining power of buyers

Bargaining power of buyers - Impact of key factors 2025 and 2030

7.3 Bargaining power of suppliers

Bargaining power of suppliers - Impact of key factors in 2025 and 2030

7.4 Threat of new entrants

Threat of new entrants - Impact of key factors in 2025 and 2030

7.5 Threat of substitutes

Threat of substitutes - Impact of key factors in 2025 and 2030

7.6 Threat of rivalry

Threat of rivalry - Impact of key factors in 2025 and 2030

7.7 Market condition

Chart on Market condition - Five forces 2025 and 2030

8. Market Segmentation by Type

8.1 Market segments

Chart on Type - Market share 2025-2030 (%)
Data Table on Type - Market share 2025-2030 (%)

8.2 Comparison by Type

Chart on Comparison by Type
Data Table on Comparison by Type

8.3 Conveyor - Market size and forecast 2025-2030

Chart on Conveyor - Market size and forecast 2025-2030 ($ million)
Data Table on Conveyor - Market size and forecast 2025-2030 ($ million)
Chart on Conveyor - Year-over-year growth 2025-2030 (%)
Data Table on Conveyor - Year-over-year growth 2025-2030 (%)

8.4 Self-propelled - Market size and forecast 2025-2030

Chart on Self-propelled - Market size and forecast 2025-2030 ($ million)
Data Table on Self-propelled - Market size and forecast 2025-2030 ($ million)
Chart on Self-propelled - Year-over-year growth 2025-2030 (%)
Data Table on Self-propelled - Year-over-year growth 2025-2030 (%)

8.5 Market opportunity by Type

Market opportunity by Type ($ million)
Data Table on Market opportunity by Type ($ million)

9. Market Segmentation by Product

9.1 Market segments

Chart on Product - Market share 2025-2030 (%)
Data Table on Product - Market share 2025-2030 (%)

9.2 Comparison by Product

Chart on Comparison by Product
Data Table on Comparison by Product

9.3 Hardware - Market size and forecast 2025-2030

Chart on Hardware - Market size and forecast 2025-2030 ($ million)
Data Table on Hardware - Market size and forecast 2025-2030 ($ million)
Chart on Hardware - Year-over-year growth 2025-2030 (%)
Data Table on Hardware - Year-over-year growth 2025-2030 (%)

9.4 Software - Market size and forecast 2025-2030

Chart on Software - Market size and forecast 2025-2030 ($ million)
Data Table on Software - Market size and forecast 2025-2030 ($ million)
Chart on Software - Year-over-year growth 2025-2030 (%)
Data Table on Software - Year-over-year growth 2025-2030 (%)

9.5 Services - Market size and forecast 2025-2030

Chart on Services - Market size and forecast 2025-2030 ($ million)
Data Table on Services - Market size and forecast 2025-2030 ($ million)
Chart on Services - Year-over-year growth 2025-2030 (%)
Data Table on Services - Year-over-year growth 2025-2030 (%)

9.6 Market opportunity by Product

Market opportunity by Product ($ million)
Data Table on Market opportunity by Product ($ million)

10. Market Segmentation by Animal Type

10.1 Market segments

Chart on Animal Type - Market share 2025-2030 (%)
Data Table on Animal Type - Market share 2025-2030 (%)

10.2 Comparison by Animal Type

Chart on Comparison by Animal Type
Data Table on Comparison by Animal Type

10.3 Ruminants - Market size and forecast 2025-2030

Chart on Ruminants - Market size and forecast 2025-2030 ($ million)
Data Table on Ruminants - Market size and forecast 2025-2030 ($ million)
Chart on Ruminants - Year-over-year growth 2025-2030 (%)
Data Table on Ruminants - Year-over-year growth 2025-2030 (%)

10.4 Poultry - Market size and forecast 2025-2030

Chart on Poultry - Market size and forecast 2025-2030 ($ million)
Data Table on Poultry - Market size and forecast 2025-2030 ($ million)
Chart on Poultry - Year-over-year growth 2025-2030 (%)
Data Table on Poultry - Year-over-year growth 2025-2030 (%)

10.5 Swine - Market size and forecast 2025-2030

Chart on Swine - Market size and forecast 2025-2030 ($ million)
Data Table on Swine - Market size and forecast 2025-2030 ($ million)
Chart on Swine - Year-over-year growth 2025-2030 (%)
Data Table on Swine - Year-over-year growth 2025-2030 (%)

10.6 Others - Market size and forecast 2025-2030

Chart on Others - Market size and forecast 2025-2030 ($ million)
Data Table on Others - Market size and forecast 2025-2030 ($ million)
Chart on Others - Year-over-year growth 2025-2030 (%)
Data Table on Others - Year-over-year growth 2025-2030 (%)

10.7 Market opportunity by Animal Type

Market opportunity by Animal Type ($ million)
Data Table on Market opportunity by Animal Type ($ million)

11. Customer Landscape

11.1 Customer landscape overview

Analysis of price sensitivity, lifecycle, customer purchase basket, adoption rates, and purchase criteria

12. Geographic Landscape

12.1 Geographic segmentation

Chart on Market share by geography 2025-2030 (%)
Data Table on Market share by geography 2025-2030 (%)

12.2 Geographic comparison

Chart on Geographic comparison
Data Table on Geographic comparison

12.3 Europe - Market size and forecast 2025-2030

Chart on Europe - Market size and forecast 2025-2030 ($ million)
Data Table on Europe - Market size and forecast 2025-2030 ($ million)
Chart on Europe - Year-over-year growth 2025-2030 (%)
Data Table on Europe - Year-over-year growth 2025-2030 (%)
Chart on Regional Comparison - Europe
Data Table on Regional Comparison - Europe

12.3.1 Germany - Market size and forecast 2025-2030

Chart on Germany - Market size and forecast 2025-2030 ($ million)
Data Table on Germany - Market size and forecast 2025-2030 ($ million)
Chart on Germany - Year-over-year growth 2025-2030 (%)
Data Table on Germany - Year-over-year growth 2025-2030 (%)

12.3.2 UK - Market size and forecast 2025-2030

Chart on UK - Market size and forecast 2025-2030 ($ million)
Data Table on UK - Market size and forecast 2025-2030 ($ million)
Chart on UK - Year-over-year growth 2025-2030 (%)
Data Table on UK - Year-over-year growth 2025-2030 (%)

12.3.3 France - Market size and forecast 2025-2030

Chart on France - Market size and forecast 2025-2030 ($ million)
Data Table on France - Market size and forecast 2025-2030 ($ million)
Chart on France - Year-over-year growth 2025-2030 (%)
Data Table on France - Year-over-year growth 2025-2030 (%)

12.3.4 The Netherlands - Market size and forecast 2025-2030

Chart on The Netherlands - Market size and forecast 2025-2030 ($ million)
Data Table on The Netherlands - Market size and forecast 2025-2030 ($ million)
Chart on The Netherlands - Year-over-year growth 2025-2030 (%)
Data Table on The Netherlands - Year-over-year growth 2025-2030 (%)

12.3.5 Italy - Market size and forecast 2025-2030

Chart on Italy - Market size and forecast 2025-2030 ($ million)
Data Table on Italy - Market size and forecast 2025-2030 ($ million)
Chart on Italy - Year-over-year growth 2025-2030 (%)
Data Table on Italy - Year-over-year growth 2025-2030 (%)

12.3.6 Spain - Market size and forecast 2025-2030

Chart on Spain - Market size and forecast 2025-2030 ($ million)
Data Table on Spain - Market size and forecast 2025-2030 ($ million)
Chart on Spain - Year-over-year growth 2025-2030 (%)
Data Table on Spain - Year-over-year growth 2025-2030 (%)

12.4 North America - Market size and forecast 2025-2030

Chart on North America - Market size and forecast 2025-2030 ($ million)
Data Table on North America - Market size and forecast 2025-2030 ($ million)
Chart on North America - Year-over-year growth 2025-2030 (%)
Data Table on North America - Year-over-year growth 2025-2030 (%)
Chart on Regional Comparison - North America
Data Table on Regional Comparison - North America

12.4.1 US - Market size and forecast 2025-2030

Chart on US - Market size and forecast 2025-2030 ($ million)
Data Table on US - Market size and forecast 2025-2030 ($ million)
Chart on US - Year-over-year growth 2025-2030 (%)
Data Table on US - Year-over-year growth 2025-2030 (%)

12.4.2 Canada - Market size and forecast 2025-2030

Chart on Canada - Market size and forecast 2025-2030 ($ million)
Data Table on Canada - Market size and forecast 2025-2030 ($ million)
Chart on Canada - Year-over-year growth 2025-2030 (%)
Data Table on Canada - Year-over-year growth 2025-2030 (%)

12.4.3 Mexico - Market size and forecast 2025-2030

Chart on Mexico - Market size and forecast 2025-2030 ($ million)
Data Table on Mexico - Market size and forecast 2025-2030 ($ million)
Chart on Mexico - Year-over-year growth 2025-2030 (%)
Data Table on Mexico - Year-over-year growth 2025-2030 (%)

12.5 APAC - Market size and forecast 2025-2030

Chart on APAC - Market size and forecast 2025-2030 ($ million)
Data Table on APAC - Market size and forecast 2025-2030 ($ million)
Chart on APAC - Year-over-year growth 2025-2030 (%)
Data Table on APAC - Year-over-year growth 2025-2030 (%)
Chart on Regional Comparison - APAC
Data Table on Regional Comparison - APAC

12.5.1 China - Market size and forecast 2025-2030

Chart on China - Market size and forecast 2025-2030 ($ million)
Data Table on China - Market size and forecast 2025-2030 ($ million)
Chart on China - Year-over-year growth 2025-2030 (%)
Data Table on China - Year-over-year growth 2025-2030 (%)

12.5.2 Japan - Market size and forecast 2025-2030

Chart on Japan - Market size and forecast 2025-2030 ($ million)
Data Table on Japan - Market size and forecast 2025-2030 ($ million)
Chart on Japan - Year-over-year growth 2025-2030 (%)
Data Table on Japan - Year-over-year growth 2025-2030 (%)

12.5.3 India - Market size and forecast 2025-2030

Chart on India - Market size and forecast 2025-2030 ($ million)
Data Table on India - Market size and forecast 2025-2030 ($ million)
Chart on India - Year-over-year growth 2025-2030 (%)
Data Table on India - Year-over-year growth 2025-2030 (%)

12.5.4 South Korea - Market size and forecast 2025-2030

Chart on South Korea - Market size and forecast 2025-2030 ($ million)
Data Table on South Korea - Market size and forecast 2025-2030 ($ million)
Chart on South Korea - Year-over-year growth 2025-2030 (%)
Data Table on South Korea - Year-over-year growth 2025-2030 (%)

12.5.5 Australia - Market size and forecast 2025-2030

Chart on Australia - Market size and forecast 2025-2030 ($ million)
Data Table on Australia - Market size and forecast 2025-2030 ($ million)
Chart on Australia - Year-over-year growth 2025-2030 (%)
Data Table on Australia - Year-over-year growth 2025-2030 (%)

12.5.6 Indonesia - Market size and forecast 2025-2030

Chart on Indonesia - Market size and forecast 2025-2030 ($ million)
Data Table on Indonesia - Market size and forecast 2025-2030 ($ million)
Chart on Indonesia - Year-over-year growth 2025-2030 (%)
Data Table on Indonesia - Year-over-year growth 2025-2030 (%)

12.6 South America - Market size and forecast 2025-2030

Chart on South America - Market size and forecast 2025-2030 ($ million)
Data Table on South America - Market size and forecast 2025-2030 ($ million)
Chart on South America - Year-over-year growth 2025-2030 (%)
Data Table on South America - Year-over-year growth 2025-2030 (%)
Chart on Regional Comparison - South America
Data Table on Regional Comparison - South America

12.6.1 Brazil - Market size and forecast 2025-2030

Chart on Brazil - Market size and forecast 2025-2030 ($ million)
Data Table on Brazil - Market size and forecast 2025-2030 ($ million)
Chart on Brazil - Year-over-year growth 2025-2030 (%)
Data Table on Brazil - Year-over-year growth 2025-2030 (%)

12.6.2 Argentina - Market size and forecast 2025-2030

Chart on Argentina - Market size and forecast 2025-2030 ($ million)
Data Table on Argentina - Market size and forecast 2025-2030 ($ million)
Chart on Argentina - Year-over-year growth 2025-2030 (%)
Data Table on Argentina - Year-over-year growth 2025-2030 (%)

12.6.3 Chile - Market size and forecast 2025-2030

Chart on Chile - Market size and forecast 2025-2030 ($ million)
Data Table on Chile - Market size and forecast 2025-2030 ($ million)
Chart on Chile - Year-over-year growth 2025-2030 (%)
Data Table on Chile - Year-over-year growth 2025-2030 (%)

12.7 Middle East and Africa - Market size and forecast 2025-2030

Chart on Middle East and Africa - Market size and forecast 2025-2030 ($ million)
Data Table on Middle East and Africa - Market size and forecast 2025-2030 ($ million)
Chart on Middle East and Africa - Year-over-year growth 2025-2030 (%)
Data Table on Middle East and Africa - Year-over-year growth 2025-2030 (%)
Chart on Regional Comparison - Middle East and Africa
Data Table on Regional Comparison - Middle East and Africa

12.7.1 Saudi Arabia - Market size and forecast 2025-2030

Chart on Saudi Arabia - Market size and forecast 2025-2030 ($ million)
Data Table on Saudi Arabia - Market size and forecast 2025-2030 ($ million)
Chart on Saudi Arabia - Year-over-year growth 2025-2030 (%)
Data Table on Saudi Arabia - Year-over-year growth 2025-2030 (%)

12.7.2 UAE - Market size and forecast 2025-2030

Chart on UAE - Market size and forecast 2025-2030 ($ million)
Data Table on UAE - Market size and forecast 2025-2030 ($ million)
Chart on UAE - Year-over-year growth 2025-2030 (%)
Data Table on UAE - Year-over-year growth 2025-2030 (%)

12.7.3 South Africa - Market size and forecast 2025-2030

Chart on South Africa - Market size and forecast 2025-2030 ($ million)
Data Table on South Africa - Market size and forecast 2025-2030 ($ million)
Chart on South Africa - Year-over-year growth 2025-2030 (%)
Data Table on South Africa - Year-over-year growth 2025-2030 (%)

12.7.4 Israel - Market size and forecast 2025-2030

Chart on Israel - Market size and forecast 2025-2030 ($ million)
Data Table on Israel - Market size and forecast 2025-2030 ($ million)
Chart on Israel - Year-over-year growth 2025-2030 (%)
Data Table on Israel - Year-over-year growth 2025-2030 (%)

12.7.5 Turkey - Market size and forecast 2025-2030

Chart on Turkey - Market size and forecast 2025-2030 ($ million)
Data Table on Turkey - Market size and forecast 2025-2030 ($ million)
Chart on Turkey - Year-over-year growth 2025-2030 (%)
Data Table on Turkey - Year-over-year growth 2025-2030 (%)

12.8 Market opportunity by geography

Market opportunity by geography ($ million)
Data Tables on Market opportunity by geography ($ million)

13. Drivers, Challenges, and Opportunity

13.1 Market drivers

Technological integration through advanced digital connectivity
Precision nutrition and sustainable waste reduction
Expansion of intensive livestock farming infrastructure

13.2 Market challenges

Prohibitive capital expenditure and financial barriers
System downtime and specialized maintenance constraining operational continuity
Workforce skill gaps and training deficits

13.3 Impact of drivers and challenges

Impact of drivers and challenges in 2025 and 2030

13.4 Market opportunities

Accelerated adoption of automated systems to offset labor volatility
Rise of precision livestock farming
Increasing demand for sustainable agriculture

14. Competitive Landscape

14.1 Overview

14.2

Overview on criticality of inputs and factors of differentiation

14.3 Landscape disruption

Overview on factors of disruption

14.4 Industry risks

Impact of key risks on business

15. Competitive Analysis

15.1 Companies profiled

Companies covered

15.2 Company ranking index

15.3 Market positioning of companies

Matrix on companies position and classification

15.4 Afimilk Ltd.

Afimilk Ltd. - Overview
Afimilk Ltd. - Product / Service
Afimilk Ltd. - Key offerings
SWOT

15.5 Big Dutchman AG Holding

Big Dutchman AG Holding - Overview
Big Dutchman AG Holding - Product / Service
Big Dutchman AG Holding - Key offerings
SWOT

15.6 BouMatic LLC

BouMatic LLC - Overview
BouMatic LLC - Product / Service
BouMatic LLC - Key offerings
SWOT

15.7 Dairymaster

Dairymaster - Overview
Dairymaster - Product / Service
Dairymaster - Key offerings
SWOT

15.8 DeLaval International AB

DeLaval International AB - Overview
DeLaval International AB - Product / Service
DeLaval International AB - Key offerings
SWOT

15.9 Delmer Group

Delmer Group - Overview
Delmer Group - Product / Service
Delmer Group - Key offerings
SWOT

15.10 Fancom BV

Fancom BV - Overview
Fancom BV - Product / Service
Fancom BV - Key offerings
SWOT

15.11 Faresin Industries Spa

Faresin Industries Spa - Overview
Faresin Industries Spa - Product / Service
Faresin Industries Spa - Key offerings
SWOT

15.12 Gartech Equipments Pvt. Ltd.

Gartech Equipments Pvt. Ltd. - Overview
Gartech Equipments Pvt. Ltd. - Product / Service
Gartech Equipments Pvt. Ltd. - Key offerings
SWOT

15.13 Hetwin Automation Systems Gmbh

Hetwin Automation Systems Gmbh - Overview
Hetwin Automation Systems Gmbh - Product / Service
Hetwin Automation Systems Gmbh - Key offerings
SWOT

15.14 Lely International N.V

Lely International N.V - Overview
Lely International N.V - Product / Service
Lely International N.V - Key offerings
SWOT

15.15 Nedap NV

Nedap NV - Overview
Nedap NV - Business segments
Nedap NV - Key news
Nedap NV - Key offerings
Nedap NV - Segment focus
SWOT

15.16 RNA Automation Ltd.

RNA Automation Ltd. - Overview
RNA Automation Ltd. - Product / Service
RNA Automation Ltd. - Key offerings
SWOT

15.17 Rovibec Agrisolutions

Rovibec Agrisolutions - Overview
Rovibec Agrisolutions - Product / Service
Rovibec Agrisolutions - Key offerings
SWOT

15.18 Schauer Agrotronic GmbH

Schauer Agrotronic GmbH - Overview
Schauer Agrotronic GmbH - Product / Service
Schauer Agrotronic GmbH - Key offerings
SWOT

16. Appendix

16.1 Scope of the report

Market definition
Objectives
Notes and caveats

16.2 Inclusions and exclusions checklist

Inclusions checklist
Exclusions checklist

16.3 Currency conversion rates for US$

16.4 Research methodology

16.5 Data procurement

Information sources

16.6 Data validation

16.7 Validation techniques employed for market sizing

16.8 Data synthesis

16.9 360 degree market analysis

16.10 List of abbreviations

Research Methodology

Technavio presents a detailed picture of the market by way of study, synthesis, and summation of data from multiple sources. The analysts have presented the various facets of the market with a particular focus on identifying the key industry influencers. The data thus presented is comprehensive, reliable, and the result of extensive research, both primary and secondary.

INFORMATION SOURCES

Primary sources

  • Manufacturers and suppliers
  • Channel partners
  • Industry experts
  • Strategic decision makers

Secondary sources

  • Industry journals and periodicals
  • Government data
  • Financial reports of key industry players
  • Historical data
  • Press releases

DATA ANALYSIS

Data Synthesis

  • Collation of data
  • Estimation of key figures
  • Analysis of derived insights

Data Validation

  • Triangulation with data models
  • Reference against proprietary databases
  • Corroboration with industry experts

REPORT WRITING

Qualitative

  • Market drivers
  • Market challenges
  • Market trends
  • Five forces analysis

Quantitative

  • Market size and forecast
  • Market segmentation
  • Geographical insights
  • Competitive landscape

Interested in this report?

Get your sample now to see our research methodology and insights!

Download Now

Frequently Asked Questions

Automated Feeding Systems market growth will increase by USD 5712.2 million during 2026-2030.

The Automated Feeding Systems market is expected to grow at a CAGR of 10.8% during 2026-2030.

Automated Feeding Systems market is segmented by Type (Conveyor, Self-propelled) Product (Hardware, Software, Services) Animal type (Ruminants, Poultry, Swine, Others)

Afimilk Ltd., Big Dutchman AG Holding, BouMatic LLC, Dairymaster, DeLaval International AB, Delmer Group, Fancom BV, Faresin Industries Spa, FFF Systems Inc., Gartech Equipments Pvt. Ltd., Hetwin Automation Systems Gmbh, Lely International N.V, MS Automated LLC, Nedap NV, RNA Automation Ltd., Rovibec Agrisolutions, Schauer Agrotronic GmbH, Sgariboldi S.r.l., Trioliet BV, Valmetal Inc., VDL Agrotech BV are a few of the key vendors in the Automated Feeding Systems market.

Europe will register the highest growth rate of 36.7% among the other regions. Therefore, the Automated Feeding Systems market in Europe is expected to garner significant business opportunities for the vendors during the forecast period.

Germany, UK, France, The Netherlands, Italy, Spain, US, Canada, Mexico, China, Japan, India, South Korea, Australia, Indonesia, Brazil, Argentina, Chile, Saudi Arabia, UAE, South Africa, Israel, Turkey

  • Technological integration through advanced digital connectivity is the driving factor this market.

The Automated Feeding Systems market vendors should focus on grabbing business opportunities from the Type segment as it accounted for the largest market share in the base year.
RIA - Research AI Assistant
Ask RIA
