Automl Market Analysis, Size, and Forecast 2026-2030: North America (US, Canada, and Mexico), APAC (China, Japan, and India), Europe (Germany, UK, and France), South America (Brazil and Argentina), Middle East and Africa (Saudi Arabia, UAE, and South Africa), and Rest of World (ROW)

Automl Market Analysis, Size, and Forecast 2026-2030:
North America (US, Canada, and Mexico), APAC (China, Japan, and India), Europe (Germany, UK, and France), South America (Brazil and Argentina), Middle East and Africa (Saudi Arabia, UAE, and South Africa), and Rest of World (ROW)

Published: May 2026 332 Pages SKU: IRTNTR80656

Market Overview at a Glance

$17.66 B
Market Opportunity
44.5%
CAGR 2025 - 2030
41.6%
North America Growth
$1.12 B
Services segment 2024

Automl Market Size 2026-2030

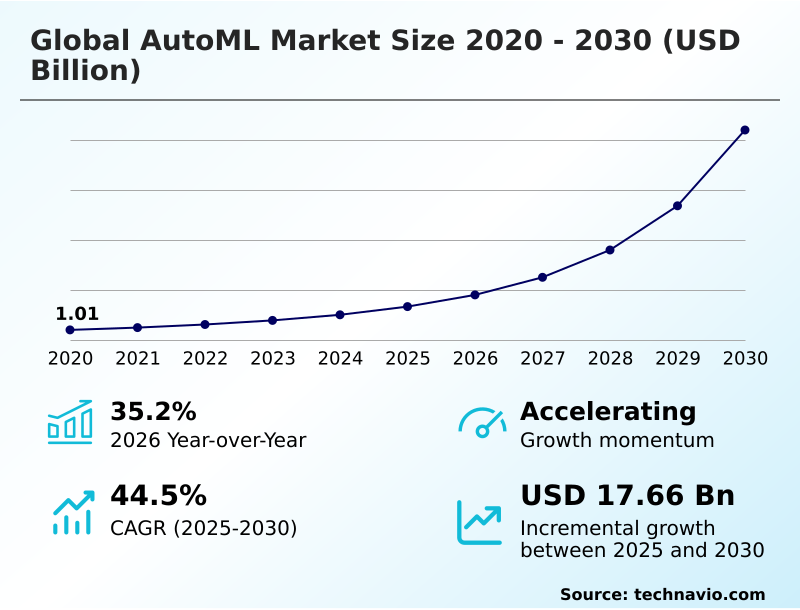
The Automl Market size was valued at USD 3.34 billion in 2025, growing at a CAGR of 44.5% during the forecast period 2026-2030.

Major Market Trends & Insights

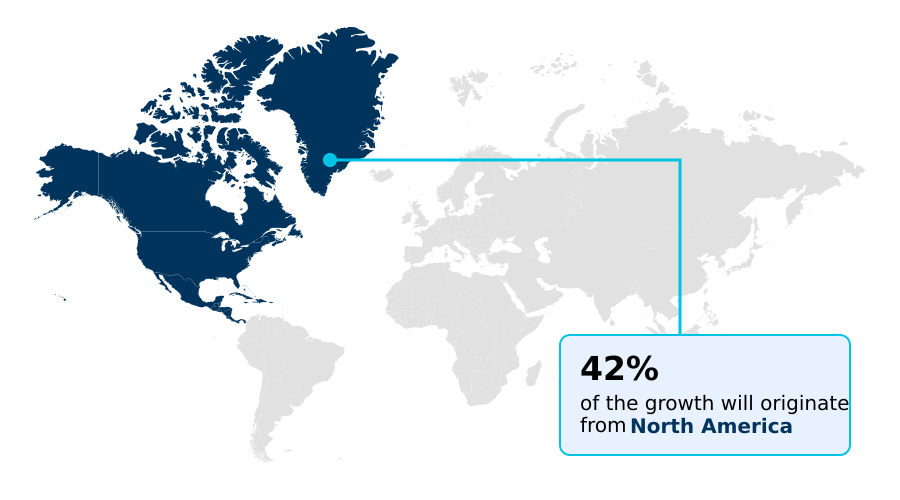
  • North America dominated the market and accounted for a 41.6% growth during the forecast period.
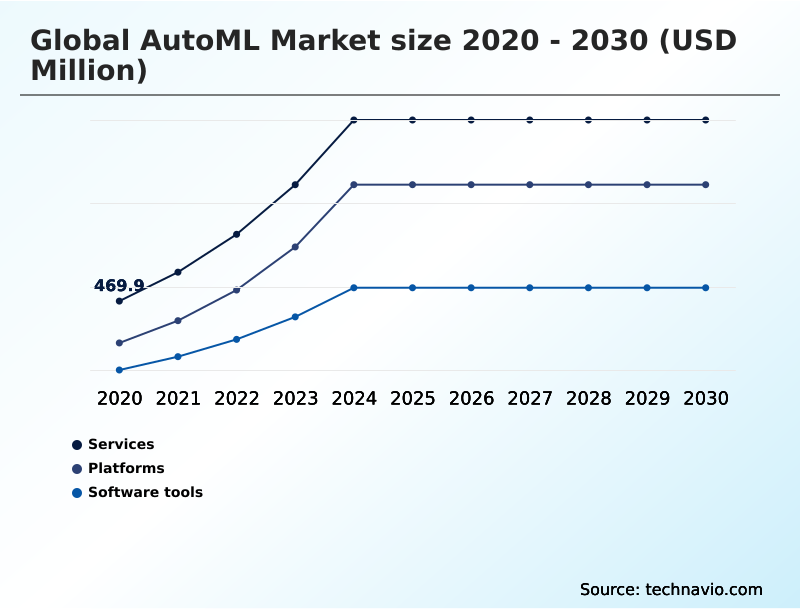
  • By Type - Services segment was valued at USD 1.12 billion in 2024
  • By Deployment - Cloud segment accounted for the largest market revenue share in 2024

Market Size & Forecast

  • Historic Market Opportunities 2020-2024: USD 19.99 billion
  • Market Future Opportunities 2025-2030: USD 17.66 billion
  • CAGR from 2025 to 2030 : 44.5%

Market Summary

  • The autoML market is characterized by rapid platform evolution, with a 35% year-over-year increase in adoption driven by the need for accessible predictive analytics. Tools are now capable of reducing model development time by over 70% compared to manual methods.
  • This acceleration is a direct response to the primary market driver: the persistent shortage of expert data scientists, which autoML mitigates by empowering non-specialists to build and deploy models. For instance, a retail company can use an autoML platform for demand forecasting, optimizing inventory across its supply chain without needing a dedicated machine learning engineering team.
  • This democratization of AI enables faster business process automation. However, a significant challenge remains the 'black box' nature of some models, which creates a trust deficit, especially in regulated sectors where model explainability is a non-negotiable requirement for auditability and compliance. The industry's focus is shifting toward a data-centric AI approach to improve model robustness and transparency.

What will be the Size of the Automl Market during the forecast period?

Get Key Insights on Market Forecast (PDF) Request Free Sample

How is the Automl Market Segmented?

The automl industry research report provides comprehensive data (region-wise segment analysis), with forecasts and analysis for the period 2026-2030, as well as historical data from 2020-2024 for the following segments.

  • Type
    • Services
    • Platforms
    • Software tools
  • Deployment
    • Cloud
    • On-premises
  • Application
    • Data processing
    • Model selection
    • Hyperparameter tuning
  • Sector
    • BFSI
    • Retail and e-commerce
    • Manufacturing
    • Healthcare
  • End-user
    • Large enterprises
    • SMEs
  • Geography
    • North America
      • US
      • Canada
      • Mexico
    • APAC
      • China
      • Japan
      • India
    • Europe
      • Germany
      • UK
      • France
    • South America
      • Brazil
      • Argentina
    • Middle East and Africa
      • Saudi Arabia
      • UAE
      • South Africa
    • Rest of World (ROW)

How is the Automl Market Segmented by Type?

The services segment is estimated to witness significant growth during the forecast period.

The services segment, which accounts for over 40% of deployments, is critical for enterprise AI adoption.

Implementation services accelerate model deployment by up to 60% compared to internal efforts, directly addressing the persistent talent gap mitigation needs of organizations without dedicated data science teams.

These services, encompassing strategic consulting and machine learning workflow orchestration, ensure that autoML platforms are integrated securely within existing IT infrastructures.

Furthermore, managed support and training services focus on AI model risk management, helping organizations achieve regulatory compliance automation and reducing long-term model performance degradation by over 25%.

This comprehensive support structure is essential for de-risking investments and maximizing the operational value derived from automated predictive modeling.

Request Free Sample

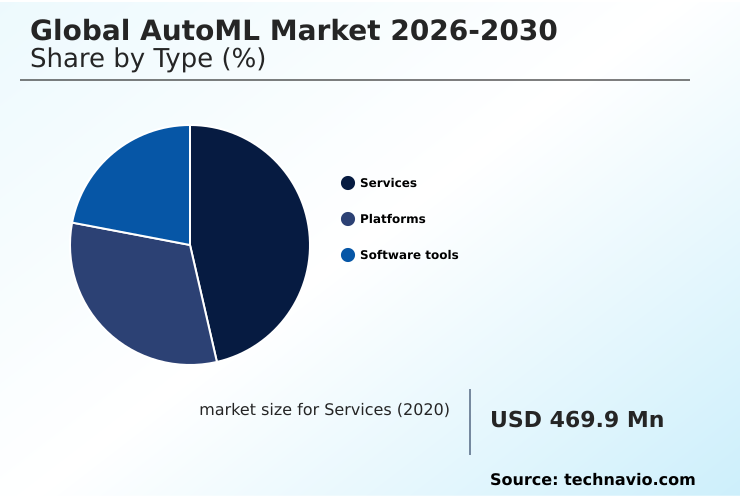
The Services segment was valued at USD 1.12 billion in 2024 and showed a gradual increase during the forecast period.

Request Free Sample

How demand for the Automl market is rising in the leading region?

North America is estimated to contribute 41.6% to the growth of the global market during the forecast period.Technavio’s analysts have elaborately explained the regional trends and drivers that shape the market during the forecast period.

See How Automl Market demand is rising in North America Request Free Sample

The global autoML market's geographic landscape is led by North America, which accounts for 41.6% of the incremental growth, a figure 12% higher than that of APAC.

This dominance is driven by the US, which contributes over 78% of the region's revenue, and is fueled by early enterprise AI adoption and a mature scalable AI infrastructure.

In contrast, APAC, the fastest-growing region, is characterized by mobile-first digital transformation and government-led AI initiatives, particularly in China and India.

European adoption, which is growing at 43.7%, is heavily shaped by stringent data privacy regulations, making AI model risk management and regulatory compliance automation core requirements for market entry.

South America and the Middle East and Africa are emerging markets, primarily focused on using autoML for talent gap mitigation and to leapfrog legacy analytics technologies in the finance and telecom sectors, fostering AI-driven decision making.

What are the key Drivers, Trends, and Challenges in the Automl Market?

Our researchers analyzed the data with 2025 as the base year, along with the key drivers, trends, and challenges. A holistic analysis of drivers will help companies refine their marketing strategies to gain a competitive advantage.

  • Organizations evaluating autoML platforms for enterprise use are increasingly moving beyond pure performance metrics to assess total cost of ownership and governance capabilities, where cloud-native solutions show a 25% lower upfront infrastructure cost.
  • When conducting an open source autoML tools comparison, enterprises find that while these tools offer high flexibility, they often require 40% more specialized personnel for maintenance and security hardening compared to commercial offerings.
  • In the industrial sector, the specific autoML for predictive maintenance benefits are clear; firms report reductions in unplanned downtime by over 30% by deploying models that analyze sensor data in real-time.
  • Similarly, in the financial industry, the use of automated machine learning for finance to process loan applications has accelerated decision times by up to 80% while improving risk assessment accuracy.
  • The process of building classification models with autoML has become a foundational use case, enabling business analysts to create and validate models for customer churn prediction or sentiment analysis in a fraction of the time it would take a data science team.
  • This shift allows expert data scientists to focus on more complex, novel problems rather than routine modeling tasks, effectively amplifying their strategic impact on the business.

What are the key market drivers leading to the rise in the adoption of Automl Industry?

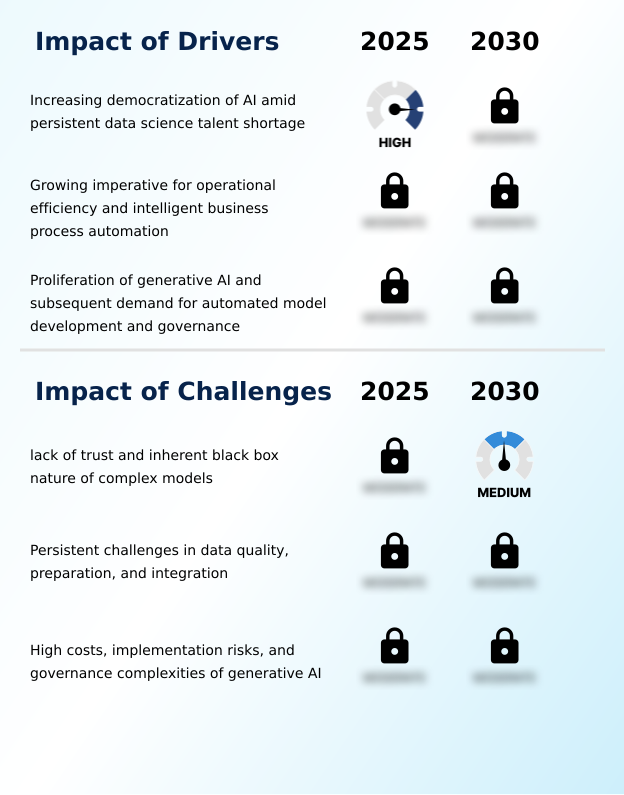
  • The increasing democratization of AI, driven by a persistent shortage of data science talent, is a primary driver for market growth.

  • The primary driver for the autoML market is the imperative for democratized AI access, which directly addresses the chronic data science talent gap and empowers citizen data scientists.
  • AutoML platforms provide operational efficiency gains of over 40% by automating time-consuming tasks like hyperparameter optimization. This allows organizations to accelerate business process automation and embed AI-driven decision making into core operations, such as supply chain management and customer service.
  • By providing intuitive, low-code interfaces, these platforms enable a 3x increase in the number of employees who can build and deploy machine learning models, leading to widespread talent gap mitigation and a more data-literate workforce.

What are the market trends shaping the Automl Industry?

  • A defining market trend is the fusion of predictive automated machine learning with generative AI. This convergence is expanding automation across the entire AI model lifecycle.

  • A defining trend in the autoML market is the convergence of predictive modeling with the generative AI lifecycle, a shift that expands automation beyond structured data tasks. This integration automates complex processes like fine-tuning large language models, reducing the manual effort by up to 60%.
  • Consequently, platforms are evolving into unified, end-to-end MLOps workflow solutions, where model explainability and responsible AI principles are embedded by design. This platformization is critical, as enterprises seek a single AI governance framework to manage both predictive and generative models, with automated systems now able to detect and flag potential algorithmic bias 30% faster than manual review processes.
  • This focus on building trustworthy AI through feature engineering automation and governance is becoming a core competitive differentiator.

What challenges does the Automl Industry face during its growth?

  • A key challenge affecting industry growth is the lack of trust stemming from the inherent black-box nature of complex autoML models.

  • A significant challenge restraining autoML adoption is the 'black box' nature of complex models, which can increase AI model risk management liabilities by over 50% in regulated industries if not properly addressed. The lack of interpretability creates a trust deficit, making model transparency reporting a critical yet difficult requirement.
  • Another major hurdle is poor data quality, which can degrade model accuracy by more than 30% and requires extensive, manual data quality assessment before autoML tools can be effective. Furthermore, the high costs associated with training large models and the complexities of real-time inference deployment present substantial operational barriers, slowing down the transition from development to production.

Exclusive Technavio Analysis on Customer Landscape

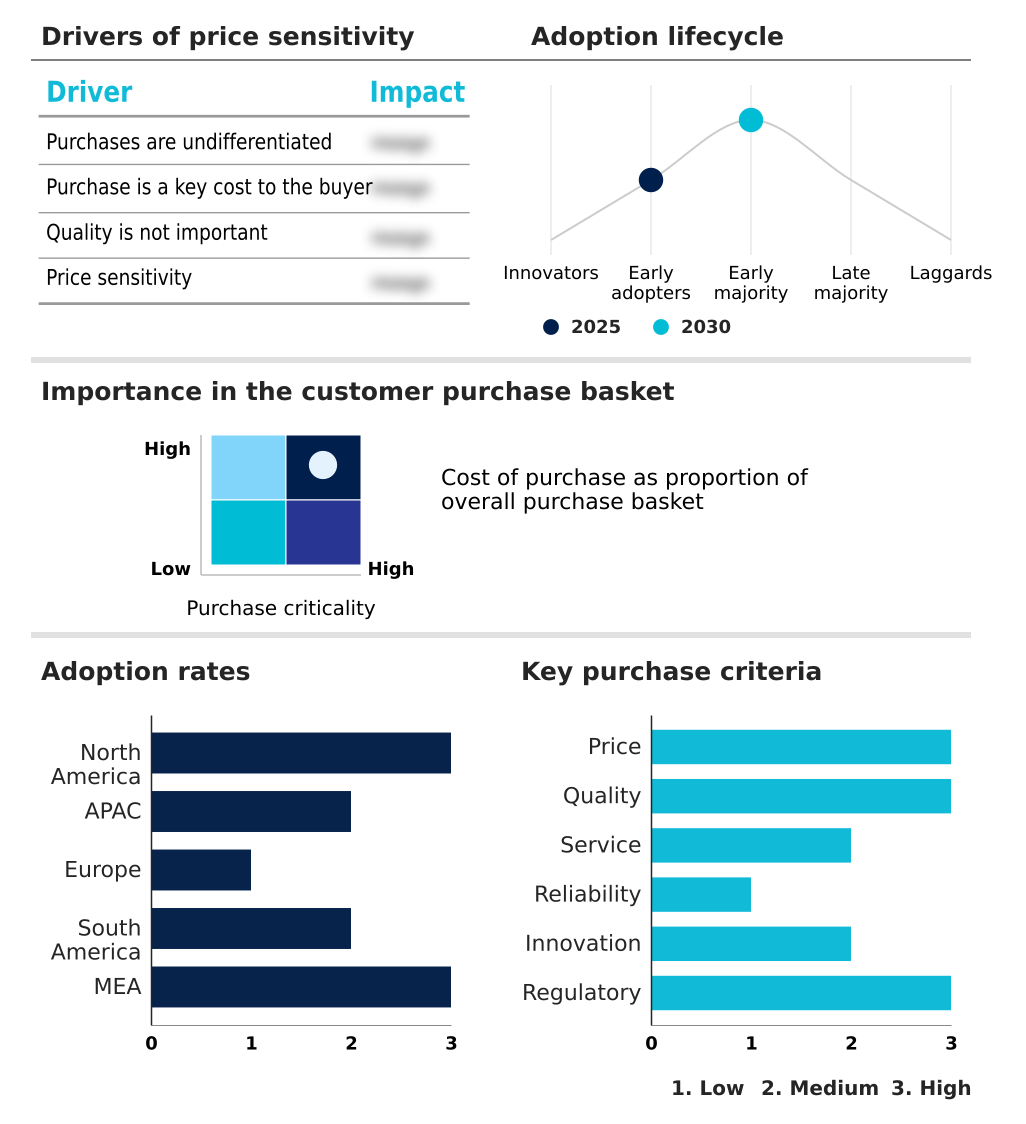
The automl market forecasting report includes the adoption lifecycle of the market, covering from the innovator’s stage to the laggard’s stage. It focuses on adoption rates in different regions based on penetration. Furthermore, the automl market report also includes key purchase criteria and drivers of price sensitivity to help companies evaluate and develop their market growth analysis strategies.

Customer Landscape of Automl Industry

Competitive Landscape

Companies are implementing various strategies, such as strategic alliances, automl market forecast, partnerships, mergers and acquisitions, geographical expansion, and product/service launches, to enhance their presence in the industry.

Akkio Inc. - Delivers a unified platform combining predictive and generative AI with embedded governance to streamline workflows and accelerate enterprise-wide AI adoption.

The industry research and growth report includes detailed analyses of the competitive landscape of the market and information about key companies, including:

  • Akkio Inc.
  • Altair Engineering Inc.
  • Alteryx Inc.
  • Amazon Web Services Inc.
  • BigML Inc.
  • Databricks Inc.
  • Dataiku Inc.
  • DataRobot Inc.
  • Google LLC
  • H2O.ai Inc.
  • Hewlett Packard Enterprise Co.
  • IBM Corp.
  • KNIME AG
  • Microsoft Corp.
  • Oracle Corp.
  • QlikTech International AB
  • Salesforce Inc.
  • SAP SE
  • SAS Institute Inc.
  • TIBCO Software Inc.

Qualitative and quantitative analysis of companies has been conducted to help clients understand the wider business environment as well as the strengths and weaknesses of key industry players. Data is qualitatively analyzed to categorize companies as pure play, category-focused, industry-focused, and diversified; it is quantitatively analyzed to categorize companies as dominant, leading, strong, tentative, and weak.

Market Intelligence Radar: High-Impact Developments & Growth Signals

  • In the Application Software industry, the rising adoption of cloud-native analytics platforms is creating a unified environment for data management and model development, which directly accelerates enterprise AI adoption by providing a scalable AI infrastructure for autoML solutions.
  • In the Application Software industry, heightened data security and privacy regulations are compelling developers to embed robust AI governance frameworks and model transparency reporting capabilities directly into autoML platforms to ensure regulatory compliance automation.
  • In the Application Software industry, the increasing automation of business processes through technologies like robotic process automation is driving demand for autoML to provide the predictive intelligence layer, enabling more sophisticated AI-driven decision making within automated workflows.
  • In the Application Software industry, persistent challenges with data integration from disparate enterprise systems are fueling the development of autoML tools with advanced data preprocessing automation and data quality assessment features to streamline the machine learning pipeline.

Dive into Technavio’s robust research methodology, blending expert interviews, extensive data synthesis, and validated models for unparalleled Automl Market insights. See full methodology.

Market Scope
Page number 332
Base year 2025
Historic period 2020-2024
Forecast period 2026-2030
Growth momentum & CAGR Accelerate at a CAGR of 44.5%
Market growth 2026-2030 USD 17664.1 million
Market structure Fragmented
YoY growth 2025-2026(%) 35.2%
Key countries US, Canada, Mexico, China, Japan, India, South Korea, Australia, Indonesia, Germany, UK, France, Italy, Spain, The Netherlands, Brazil, Argentina, Chile, Saudi Arabia, UAE, South Africa, Israel and Turkey
Competitive landscape Leading Companies, Market Positioning of Companies, Competitive Strategies, and Industry Risks

Request Free Sample

Research Analyst Overview

  • The autoML market ecosystem functions through a complex value chain, where cloud hyperscalers provide the foundational scalable AI infrastructure, accounting for over 70% of the compute resources used for model training. Upon this layer, specialized autoML platform providers build solutions that enable citizen data scientist empowerment, simplifying the machine learning workflow.
  • These platforms feature MLOps integration to automate model performance monitoring and lifecycle management. The output is consumed by enterprises across sectors like finance and retail, where automated models drive operational efficiencies, such as a 15% reduction in inventory waste through better demand forecasting.
  • Regulatory bodies and industry consortiums influence the market by establishing standards for AI governance frameworks and data privacy, compelling platform vendors to incorporate features for explainability and bias detection, thus ensuring responsible and trustworthy deployment.

What are the Key Data Covered in this Automl Market Research and Growth Report?

  • What is the expected growth of the Automl Market between 2026 and 2030?

    • The Automl Market is expected to grow by USD 17.66 billion during 2026-2030, registering a CAGR of 44.5%. Year-over-year growth in 2026 is estimated at 35.2%%. This acceleration is shaped by increasing democratization of ai amid persistent data science talent shortage, which is intensifying demand across multiple end-use verticals covered in the report.

  • What segmentation does the market report cover?

    • The report is segmented by Type (Services, Platforms, and Software tools), Deployment (Cloud, and On-premises), Application (Data processing, Model selection, and Hyperparameter tuning), Sector (BFSI, Retail and e-commerce, Manufacturing, and Healthcare), End-user (Large enterprises, and SMEs) and Geography (North America, APAC, Europe, South America, Middle East and Africa). Among these, the Services segment is estimated to witness significant growth during the forecast period, driven by rising adoption across key application areas. Each segment includes detailed qualitative and quantitative analysis, along with historical data from 2020-2024 and forecasts through 2030 with year-over-year growth rates.

  • Which regions are analyzed in the report?

    • The report covers North America, APAC, Europe, South America and Middle East and Africa. North America is estimated to contribute 41.6% to market growth during the forecast period. Country-level analysis includes US, Canada, Mexico, China, Japan, India, South Korea, Australia, Indonesia, Germany, UK, France, Italy, Spain, The Netherlands, Brazil, Argentina, Chile, Saudi Arabia, UAE, South Africa, Israel and Turkey, with dedicated market size tables and year-over-year growth for each.

  • What are the key growth drivers and market challenges?

    • The primary driver is increasing democratization of ai amid persistent data science talent shortage, which is accelerating investment and industry demand. The main challenge is lack of trust and inherent black box nature of complex models, creating operational barriers for key market participants. The report quantifies the impact of each driver and challenge across 2026 and 2030 with comparative analysis.

  • Who are the major players in the Automl Market?

    • Key vendors include Akkio Inc., Altair Engineering Inc., Alteryx Inc., Amazon Web Services Inc., BigML Inc., Databricks Inc., Dataiku Inc., DataRobot Inc., Google LLC, H2O.ai Inc., Hewlett Packard Enterprise Co., IBM Corp., KNIME AG, Microsoft Corp., Oracle Corp., QlikTech International AB, Salesforce Inc., SAP SE, SAS Institute Inc. and TIBCO Software Inc.. The report provides qualitative and quantitative analysis categorizing companies as dominant, leading, strong, tentative, and weak based on their market positioning. Company profiles include business segment analysis, SWOT assessment, key offerings, and recent strategic developments.

Market Research Insights

  • The competitive landscape of the autoML market is intensely fragmented, with the top three cloud hyperscalers capturing over 55% of the market share through integrated platform offerings. Major providers like Google, Microsoft, and Amazon Web Services leverage their extensive cloud infrastructure to bundle autoML services, creating significant entry barriers.
  • In response, specialized vendors such as DataRobot and H2O.ai are differentiating through advanced features in the generative AI lifecycle and end-to-end MLOps workflow, achieving a 20% higher performance on specific benchmarks. These companies are focusing on delivering robust AI governance frameworks to meet enterprise demands for responsible AI.
  • The primary challenge for all players is navigating the high costs and implementation risks associated with scaling generative AI, forcing a strategic focus on platforms that are not only powerful but also cost-effective and governable.

We can help! Our analysts can customize this automl market research report to meet your requirements.

Get in touch

1. Executive Summary

1.1 Market overview

Executive Summary - Chart on Market Overview
Executive Summary - Data Table on Market Overview
Executive Summary - Chart on Global Market Characteristics
Executive Summary - Chart on Market by Geography
Executive Summary - Chart on Market Segmentation by Type
Executive Summary - Chart on Market Segmentation by Deployment
Executive Summary - Chart on Market Segmentation by Application
Executive Summary - Chart on Market Segmentation by Sector
Executive Summary - Chart on Market Segmentation by End-user
Executive Summary - Chart on Incremental Growth
Executive Summary - Data Table on Incremental Growth
Executive Summary - Chart on Company Market Positioning

2. Technavio Analysis

2.1 Analysis of price sensitivity, lifecycle, customer purchase basket, adoption rates, and purchase criteria

2.2 Criticality of inputs and Factors of differentiation

Chart on Overview on criticality of inputs and factors of differentiation

2.3 Factors of disruption

Chart on Overview on factors of disruption

2.4 Impact of drivers and challenges

Chart on Impact of drivers and challenges in 2025 and 2030

3. Market Landscape

3.1 Market ecosystem

Chart on Parent Market
Data Table on - Parent Market

3.2 Market characteristics

Chart on Market characteristics analysis

3.3 Value chain analysis

Chart on Value chain analysis

4. Market Sizing

4.1 Market definition

Data Table on Offerings of companies included in the market definition

4.2 Market segment analysis

Market segments

4.3 Market size 2025

4.4 Market outlook: Forecast for 2025-2030

Chart on Global - Market size and forecast 2025-2030 ($ million)
Data Table on Global - Market size and forecast 2025-2030 ($ million)
Chart on Global Market: Year-over-year growth 2025-2030 (%)
Data Table on Global Market: Year-over-year growth 2025-2030 (%)

5. Historic Market Size

5.1 Global AutoML Market 2020 - 2024

Historic Market Size - Data Table on Global AutoML Market 2020 - 2024 ($ million)

5.2 Type segment analysis 2020 - 2024

Historic Market Size - Type Segment 2020 - 2024 ($ million)

5.3 Deployment segment analysis 2020 - 2024

Historic Market Size - Deployment Segment 2020 - 2024 ($ million)

5.4 Application segment analysis 2020 - 2024

Historic Market Size - Application Segment 2020 - 2024 ($ million)

5.5 Sector segment analysis 2020 - 2024

Historic Market Size - Sector Segment 2020 - 2024 ($ million)

5.6 End-user segment analysis 2020 - 2024

Historic Market Size - End-user Segment 2020 - 2024 ($ million)

5.7 Geography segment analysis 2020 - 2024

Historic Market Size - Geography Segment 2020 - 2024 ($ million)

5.8 Country segment analysis 2020 - 2024

Historic Market Size - Country Segment 2020 - 2024 ($ million)

6. Qualitative Analysis

6.1 Impact of AI on global autoML market

6.2 Impact of geopolitical conflicts on global autoML market

7. Five Forces Analysis

7.1 Five forces summary

Five forces analysis - Comparison between 2025 and 2030

7.2 Bargaining power of buyers

Bargaining power of buyers - Impact of key factors 2025 and 2030

7.3 Bargaining power of suppliers

Bargaining power of suppliers - Impact of key factors in 2025 and 2030

7.4 Threat of new entrants

Threat of new entrants - Impact of key factors in 2025 and 2030

7.5 Threat of substitutes

Threat of substitutes - Impact of key factors in 2025 and 2030

7.6 Threat of rivalry

Threat of rivalry - Impact of key factors in 2025 and 2030

7.7 Market condition

Chart on Market condition - Five forces 2025 and 2030

8. Market Segmentation by Type

8.1 Market segments

Chart on Type - Market share 2025-2030 (%)
Data Table on Type - Market share 2025-2030 (%)

8.2 Comparison by Type

Chart on Comparison by Type
Data Table on Comparison by Type

8.3 Services - Market size and forecast 2025-2030

Chart on Services - Market size and forecast 2025-2030 ($ million)
Data Table on Services - Market size and forecast 2025-2030 ($ million)
Chart on Services - Year-over-year growth 2025-2030 (%)
Data Table on Services - Year-over-year growth 2025-2030 (%)

8.4 Platforms - Market size and forecast 2025-2030

Chart on Platforms - Market size and forecast 2025-2030 ($ million)
Data Table on Platforms - Market size and forecast 2025-2030 ($ million)
Chart on Platforms - Year-over-year growth 2025-2030 (%)
Data Table on Platforms - Year-over-year growth 2025-2030 (%)

8.5 Software tools - Market size and forecast 2025-2030

Chart on Software tools - Market size and forecast 2025-2030 ($ million)
Data Table on Software tools - Market size and forecast 2025-2030 ($ million)
Chart on Software tools - Year-over-year growth 2025-2030 (%)
Data Table on Software tools - Year-over-year growth 2025-2030 (%)

8.6 Market opportunity by Type

Market opportunity by Type ($ million)
Data Table on Market opportunity by Type ($ million)

9. Market Segmentation by Deployment

9.1 Market segments

Chart on Deployment - Market share 2025-2030 (%)
Data Table on Deployment - Market share 2025-2030 (%)

9.2 Comparison by Deployment

Chart on Comparison by Deployment
Data Table on Comparison by Deployment

9.3 Cloud - Market size and forecast 2025-2030

Chart on Cloud - Market size and forecast 2025-2030 ($ million)
Data Table on Cloud - Market size and forecast 2025-2030 ($ million)
Chart on Cloud - Year-over-year growth 2025-2030 (%)
Data Table on Cloud - Year-over-year growth 2025-2030 (%)

9.4 On-premises - Market size and forecast 2025-2030

Chart on On-premises - Market size and forecast 2025-2030 ($ million)
Data Table on On-premises - Market size and forecast 2025-2030 ($ million)
Chart on On-premises - Year-over-year growth 2025-2030 (%)
Data Table on On-premises - Year-over-year growth 2025-2030 (%)

9.5 Market opportunity by Deployment

Market opportunity by Deployment ($ million)
Data Table on Market opportunity by Deployment ($ million)

10. Market Segmentation by Application

10.1 Market segments

Chart on Application - Market share 2025-2030 (%)
Data Table on Application - Market share 2025-2030 (%)

10.2 Comparison by Application

Chart on Comparison by Application
Data Table on Comparison by Application

10.3 Data processing - Market size and forecast 2025-2030

Chart on Data processing - Market size and forecast 2025-2030 ($ million)
Data Table on Data processing - Market size and forecast 2025-2030 ($ million)
Chart on Data processing - Year-over-year growth 2025-2030 (%)
Data Table on Data processing - Year-over-year growth 2025-2030 (%)

10.4 Model selection - Market size and forecast 2025-2030

Chart on Model selection - Market size and forecast 2025-2030 ($ million)
Data Table on Model selection - Market size and forecast 2025-2030 ($ million)
Chart on Model selection - Year-over-year growth 2025-2030 (%)
Data Table on Model selection - Year-over-year growth 2025-2030 (%)

10.5 Hyperparameter tuning - Market size and forecast 2025-2030

Chart on Hyperparameter tuning - Market size and forecast 2025-2030 ($ million)
Data Table on Hyperparameter tuning - Market size and forecast 2025-2030 ($ million)
Chart on Hyperparameter tuning - Year-over-year growth 2025-2030 (%)
Data Table on Hyperparameter tuning - Year-over-year growth 2025-2030 (%)

10.6 Market opportunity by Application

Market opportunity by Application ($ million)
Data Table on Market opportunity by Application ($ million)

11. Market Segmentation by Sector

11.1 Market segments

Chart on Sector - Market share 2025-2030 (%)
Data Table on Sector - Market share 2025-2030 (%)

11.2 Comparison by Sector

Chart on Comparison by Sector
Data Table on Comparison by Sector

11.3 BFSI - Market size and forecast 2025-2030

Chart on BFSI - Market size and forecast 2025-2030 ($ million)
Data Table on BFSI - Market size and forecast 2025-2030 ($ million)
Chart on BFSI - Year-over-year growth 2025-2030 (%)
Data Table on BFSI - Year-over-year growth 2025-2030 (%)

11.4 Retail and e-commerce - Market size and forecast 2025-2030

Chart on Retail and e-commerce - Market size and forecast 2025-2030 ($ million)
Data Table on Retail and e-commerce - Market size and forecast 2025-2030 ($ million)
Chart on Retail and e-commerce - Year-over-year growth 2025-2030 (%)
Data Table on Retail and e-commerce - Year-over-year growth 2025-2030 (%)

11.5 Manufacturing - Market size and forecast 2025-2030

Chart on Manufacturing - Market size and forecast 2025-2030 ($ million)
Data Table on Manufacturing - Market size and forecast 2025-2030 ($ million)
Chart on Manufacturing - Year-over-year growth 2025-2030 (%)
Data Table on Manufacturing - Year-over-year growth 2025-2030 (%)

11.6 Healthcare - Market size and forecast 2025-2030

Chart on Healthcare - Market size and forecast 2025-2030 ($ million)
Data Table on Healthcare - Market size and forecast 2025-2030 ($ million)
Chart on Healthcare - Year-over-year growth 2025-2030 (%)
Data Table on Healthcare - Year-over-year growth 2025-2030 (%)

11.7 Market opportunity by Sector

Market opportunity by Sector ($ million)
Data Table on Market opportunity by Sector ($ million)

12. Market Segmentation by End-user

12.1 Market segments

Chart on End-user - Market share 2025-2030 (%)
Data Table on End-user - Market share 2025-2030 (%)

12.2 Comparison by End-user

Chart on Comparison by End-user
Data Table on Comparison by End-user

12.3 Large enterprises - Market size and forecast 2025-2030

Chart on Large enterprises - Market size and forecast 2025-2030 ($ million)
Data Table on Large enterprises - Market size and forecast 2025-2030 ($ million)
Chart on Large enterprises - Year-over-year growth 2025-2030 (%)
Data Table on Large enterprises - Year-over-year growth 2025-2030 (%)

12.4 SMEs - Market size and forecast 2025-2030

Chart on SMEs - Market size and forecast 2025-2030 ($ million)
Data Table on SMEs - Market size and forecast 2025-2030 ($ million)
Chart on SMEs - Year-over-year growth 2025-2030 (%)
Data Table on SMEs - Year-over-year growth 2025-2030 (%)

12.5 Market opportunity by End-user

Market opportunity by End-user ($ million)
Data Table on Market opportunity by End-user ($ million)

13. Customer Landscape

13.1 Customer landscape overview

Analysis of price sensitivity, lifecycle, customer purchase basket, adoption rates, and purchase criteria

14. Geographic Landscape

14.1 Geographic segmentation

Chart on Market share by geography 2025-2030 (%)
Data Table on Market share by geography 2025-2030 (%)

14.2 Geographic comparison

Chart on Geographic comparison
Data Table on Geographic comparison

14.3 North America - Market size and forecast 2025-2030

Chart on North America - Market size and forecast 2025-2030 ($ million)
Data Table on North America - Market size and forecast 2025-2030 ($ million)
Chart on North America - Year-over-year growth 2025-2030 (%)
Data Table on North America - Year-over-year growth 2025-2030 (%)
Chart on Regional Comparison - North America
Data Table on Regional Comparison - North America

14.3.1 US - Market size and forecast 2025-2030

Chart on US - Market size and forecast 2025-2030 ($ million)
Data Table on US - Market size and forecast 2025-2030 ($ million)
Chart on US - Year-over-year growth 2025-2030 (%)
Data Table on US - Year-over-year growth 2025-2030 (%)

14.3.2 Canada - Market size and forecast 2025-2030

Chart on Canada - Market size and forecast 2025-2030 ($ million)
Data Table on Canada - Market size and forecast 2025-2030 ($ million)
Chart on Canada - Year-over-year growth 2025-2030 (%)
Data Table on Canada - Year-over-year growth 2025-2030 (%)

14.3.3 Mexico - Market size and forecast 2025-2030

Chart on Mexico - Market size and forecast 2025-2030 ($ million)
Data Table on Mexico - Market size and forecast 2025-2030 ($ million)
Chart on Mexico - Year-over-year growth 2025-2030 (%)
Data Table on Mexico - Year-over-year growth 2025-2030 (%)

14.4 APAC - Market size and forecast 2025-2030

Chart on APAC - Market size and forecast 2025-2030 ($ million)
Data Table on APAC - Market size and forecast 2025-2030 ($ million)
Chart on APAC - Year-over-year growth 2025-2030 (%)
Data Table on APAC - Year-over-year growth 2025-2030 (%)
Chart on Regional Comparison - APAC
Data Table on Regional Comparison - APAC

14.4.1 China - Market size and forecast 2025-2030

Chart on China - Market size and forecast 2025-2030 ($ million)
Data Table on China - Market size and forecast 2025-2030 ($ million)
Chart on China - Year-over-year growth 2025-2030 (%)
Data Table on China - Year-over-year growth 2025-2030 (%)

14.4.2 Japan - Market size and forecast 2025-2030

Chart on Japan - Market size and forecast 2025-2030 ($ million)
Data Table on Japan - Market size and forecast 2025-2030 ($ million)
Chart on Japan - Year-over-year growth 2025-2030 (%)
Data Table on Japan - Year-over-year growth 2025-2030 (%)

14.4.3 India - Market size and forecast 2025-2030

Chart on India - Market size and forecast 2025-2030 ($ million)
Data Table on India - Market size and forecast 2025-2030 ($ million)
Chart on India - Year-over-year growth 2025-2030 (%)
Data Table on India - Year-over-year growth 2025-2030 (%)

14.4.4 South Korea - Market size and forecast 2025-2030

Chart on South Korea - Market size and forecast 2025-2030 ($ million)
Data Table on South Korea - Market size and forecast 2025-2030 ($ million)
Chart on South Korea - Year-over-year growth 2025-2030 (%)
Data Table on South Korea - Year-over-year growth 2025-2030 (%)

14.4.5 Australia - Market size and forecast 2025-2030

Chart on Australia - Market size and forecast 2025-2030 ($ million)
Data Table on Australia - Market size and forecast 2025-2030 ($ million)
Chart on Australia - Year-over-year growth 2025-2030 (%)
Data Table on Australia - Year-over-year growth 2025-2030 (%)

14.4.6 Indonesia - Market size and forecast 2025-2030

Chart on Indonesia - Market size and forecast 2025-2030 ($ million)
Data Table on Indonesia - Market size and forecast 2025-2030 ($ million)
Chart on Indonesia - Year-over-year growth 2025-2030 (%)
Data Table on Indonesia - Year-over-year growth 2025-2030 (%)

14.5 Europe - Market size and forecast 2025-2030

Chart on Europe - Market size and forecast 2025-2030 ($ million)
Data Table on Europe - Market size and forecast 2025-2030 ($ million)
Chart on Europe - Year-over-year growth 2025-2030 (%)
Data Table on Europe - Year-over-year growth 2025-2030 (%)
Chart on Regional Comparison - Europe
Data Table on Regional Comparison - Europe

14.5.1 Germany - Market size and forecast 2025-2030

Chart on Germany - Market size and forecast 2025-2030 ($ million)
Data Table on Germany - Market size and forecast 2025-2030 ($ million)
Chart on Germany - Year-over-year growth 2025-2030 (%)
Data Table on Germany - Year-over-year growth 2025-2030 (%)

14.5.2 UK - Market size and forecast 2025-2030

Chart on UK - Market size and forecast 2025-2030 ($ million)
Data Table on UK - Market size and forecast 2025-2030 ($ million)
Chart on UK - Year-over-year growth 2025-2030 (%)
Data Table on UK - Year-over-year growth 2025-2030 (%)

14.5.3 France - Market size and forecast 2025-2030

Chart on France - Market size and forecast 2025-2030 ($ million)
Data Table on France - Market size and forecast 2025-2030 ($ million)
Chart on France - Year-over-year growth 2025-2030 (%)
Data Table on France - Year-over-year growth 2025-2030 (%)

14.5.4 Italy - Market size and forecast 2025-2030

Chart on Italy - Market size and forecast 2025-2030 ($ million)
Data Table on Italy - Market size and forecast 2025-2030 ($ million)
Chart on Italy - Year-over-year growth 2025-2030 (%)
Data Table on Italy - Year-over-year growth 2025-2030 (%)

14.5.5 Spain - Market size and forecast 2025-2030

Chart on Spain - Market size and forecast 2025-2030 ($ million)
Data Table on Spain - Market size and forecast 2025-2030 ($ million)
Chart on Spain - Year-over-year growth 2025-2030 (%)
Data Table on Spain - Year-over-year growth 2025-2030 (%)

14.5.6 The Netherlands - Market size and forecast 2025-2030

Chart on The Netherlands - Market size and forecast 2025-2030 ($ million)
Data Table on The Netherlands - Market size and forecast 2025-2030 ($ million)
Chart on The Netherlands - Year-over-year growth 2025-2030 (%)
Data Table on The Netherlands - Year-over-year growth 2025-2030 (%)

14.6 South America - Market size and forecast 2025-2030

Chart on South America - Market size and forecast 2025-2030 ($ million)
Data Table on South America - Market size and forecast 2025-2030 ($ million)
Chart on South America - Year-over-year growth 2025-2030 (%)
Data Table on South America - Year-over-year growth 2025-2030 (%)
Chart on Regional Comparison - South America
Data Table on Regional Comparison - South America

14.6.1 Brazil - Market size and forecast 2025-2030

Chart on Brazil - Market size and forecast 2025-2030 ($ million)
Data Table on Brazil - Market size and forecast 2025-2030 ($ million)
Chart on Brazil - Year-over-year growth 2025-2030 (%)
Data Table on Brazil - Year-over-year growth 2025-2030 (%)

14.6.2 Argentina - Market size and forecast 2025-2030

Chart on Argentina - Market size and forecast 2025-2030 ($ million)
Data Table on Argentina - Market size and forecast 2025-2030 ($ million)
Chart on Argentina - Year-over-year growth 2025-2030 (%)
Data Table on Argentina - Year-over-year growth 2025-2030 (%)

14.6.3 Chile - Market size and forecast 2025-2030

Chart on Chile - Market size and forecast 2025-2030 ($ million)
Data Table on Chile - Market size and forecast 2025-2030 ($ million)
Chart on Chile - Year-over-year growth 2025-2030 (%)
Data Table on Chile - Year-over-year growth 2025-2030 (%)

14.7 Middle East and Africa - Market size and forecast 2025-2030

Chart on Middle East and Africa - Market size and forecast 2025-2030 ($ million)
Data Table on Middle East and Africa - Market size and forecast 2025-2030 ($ million)
Chart on Middle East and Africa - Year-over-year growth 2025-2030 (%)
Data Table on Middle East and Africa - Year-over-year growth 2025-2030 (%)
Chart on Regional Comparison - Middle East and Africa
Data Table on Regional Comparison - Middle East and Africa

14.7.1 Saudi Arabia - Market size and forecast 2025-2030

Chart on Saudi Arabia - Market size and forecast 2025-2030 ($ million)
Data Table on Saudi Arabia - Market size and forecast 2025-2030 ($ million)
Chart on Saudi Arabia - Year-over-year growth 2025-2030 (%)
Data Table on Saudi Arabia - Year-over-year growth 2025-2030 (%)

14.7.2 UAE - Market size and forecast 2025-2030

Chart on UAE - Market size and forecast 2025-2030 ($ million)
Data Table on UAE - Market size and forecast 2025-2030 ($ million)
Chart on UAE - Year-over-year growth 2025-2030 (%)
Data Table on UAE - Year-over-year growth 2025-2030 (%)

14.7.3 South Africa - Market size and forecast 2025-2030

Chart on South Africa - Market size and forecast 2025-2030 ($ million)
Data Table on South Africa - Market size and forecast 2025-2030 ($ million)
Chart on South Africa - Year-over-year growth 2025-2030 (%)
Data Table on South Africa - Year-over-year growth 2025-2030 (%)

14.7.4 Israel - Market size and forecast 2025-2030

Chart on Israel - Market size and forecast 2025-2030 ($ million)
Data Table on Israel - Market size and forecast 2025-2030 ($ million)
Chart on Israel - Year-over-year growth 2025-2030 (%)
Data Table on Israel - Year-over-year growth 2025-2030 (%)

14.7.5 Turkey - Market size and forecast 2025-2030

Chart on Turkey - Market size and forecast 2025-2030 ($ million)
Data Table on Turkey - Market size and forecast 2025-2030 ($ million)
Chart on Turkey - Year-over-year growth 2025-2030 (%)
Data Table on Turkey - Year-over-year growth 2025-2030 (%)

14.8 Market opportunity by geography

Market opportunity by geography ($ million)
Data Tables on Market opportunity by geography ($ million)

15. Drivers, Challenges, and Opportunity

15.1 Market drivers

Increasing democratization of AI amid persistent data science talent shortage
Growing imperative for operational efficiency and intelligent business process automation
Proliferation of generative AI and subsequent demand for automated model development and governance

15.2 Market challenges

lack of trust and inherent black box nature of complex models
Persistent challenges in data quality, preparation, and integration
High costs, implementation risks, and governance complexities of generative AI

15.3 Impact of drivers and challenges

Impact of drivers and challenges in 2025 and 2030

15.4 Market opportunities

Fusion of predictive autoML with generative AI lifecycle automation
Platformization of AI embedding autoML into end-to-end machine learning operations workflows
Responsible AI by design from optional feature to core architectural requirement

16. Competitive Landscape

16.1 Overview

16.2

Overview on criticality of inputs and factors of differentiation

16.3 Landscape disruption

Overview on factors of disruption

16.4 Industry risks

Impact of key risks on business

17. Competitive Analysis

17.1 Companies profiled

Companies covered

17.2 Company ranking index

17.3 Market positioning of companies

Matrix on companies position and classification

17.4 Altair Engineering Inc.

Altair Engineering Inc. - Overview
Altair Engineering Inc. - Product / Service
Altair Engineering Inc. - Key offerings
SWOT

17.5 Alteryx Inc.

Alteryx Inc. - Overview
Alteryx Inc. - Product / Service
Alteryx Inc. - Key offerings
SWOT

17.6 Amazon Web Services Inc.

Amazon Web Services Inc. - Overview
Amazon Web Services Inc. - Product / Service
Amazon Web Services Inc. - Key offerings
SWOT

17.7 Databricks Inc.

Databricks Inc. - Overview
Databricks Inc. - Product / Service
Databricks Inc. - Key offerings
SWOT

17.8 Dataiku Inc.

Dataiku Inc. - Overview
Dataiku Inc. - Product / Service
Dataiku Inc. - Key offerings
SWOT

17.9 DataRobot Inc.

DataRobot Inc. - Overview
DataRobot Inc. - Product / Service
DataRobot Inc. - Key offerings
SWOT

17.10 Google LLC

Google LLC - Overview
Google LLC - Product / Service
Google LLC - Key offerings
SWOT

17.11 Hewlett Packard Enterprise Co.

Hewlett Packard Enterprise Co. - Overview
Hewlett Packard Enterprise Co. - Business segments
Hewlett Packard Enterprise Co. - Key news
Hewlett Packard Enterprise Co. - Key offerings
Hewlett Packard Enterprise Co. - Segment focus
SWOT

17.12 IBM Corp.

IBM Corp. - Overview
IBM Corp. - Business segments
IBM Corp. - Key news
IBM Corp. - Key offerings
IBM Corp. - Segment focus
SWOT

17.13 Microsoft Corp.

Microsoft Corp. - Overview
Microsoft Corp. - Business segments
Microsoft Corp. - Key news
Microsoft Corp. - Key offerings
Microsoft Corp. - Segment focus
SWOT

17.14 Oracle Corp.

Oracle Corp. - Overview
Oracle Corp. - Business segments
Oracle Corp. - Key news
Oracle Corp. - Key offerings
Oracle Corp. - Segment focus
SWOT

17.15 Salesforce Inc.

Salesforce Inc. - Overview
Salesforce Inc. - Business segments
Salesforce Inc. - Key news
Salesforce Inc. - Key offerings
Salesforce Inc. - Segment focus
SWOT

17.16 SAP SE

SAP SE - Overview
SAP SE - Business segments
SAP SE - Key news
SAP SE - Key offerings
SAP SE - Segment focus
SWOT

17.17 SAS Institute Inc.

SAS Institute Inc. - Overview
SAS Institute Inc. - Product / Service
SAS Institute Inc. - Key offerings
SWOT

17.18 TIBCO Software Inc.

TIBCO Software Inc. - Overview
TIBCO Software Inc. - Product / Service
TIBCO Software Inc. - Key offerings
SWOT

18. Appendix

18.1 Scope of the report

Market definition
Objectives
Notes and caveats

18.2 Inclusions and exclusions checklist

Inclusions checklist
Exclusions checklist

18.3 Currency conversion rates for US$

18.4 Research methodology

18.5 Data procurement

Information sources

18.6 Data validation

18.7 Validation techniques employed for market sizing

18.8 Data synthesis

18.9 360 degree market analysis

18.10 List of abbreviations

Research Methodology

Technavio presents a detailed picture of the market by way of study, synthesis, and summation of data from multiple sources. The analysts have presented the various facets of the market with a particular focus on identifying the key industry influencers. The data thus presented is comprehensive, reliable, and the result of extensive research, both primary and secondary.

INFORMATION SOURCES

Primary sources

  • Manufacturers and suppliers
  • Channel partners
  • Industry experts
  • Strategic decision makers

Secondary sources

  • Industry journals and periodicals
  • Government data
  • Financial reports of key industry players
  • Historical data
  • Press releases

DATA ANALYSIS

Data Synthesis

  • Collation of data
  • Estimation of key figures
  • Analysis of derived insights

Data Validation

  • Triangulation with data models
  • Reference against proprietary databases
  • Corroboration with industry experts

REPORT WRITING

Qualitative

  • Market drivers
  • Market challenges
  • Market trends
  • Five forces analysis

Quantitative

  • Market size and forecast
  • Market segmentation
  • Geographical insights
  • Competitive landscape

Interested in this report?

Get your sample now to see our research methodology and insights!

Download Now

Frequently Asked Questions

Automl market growth will increase by USD 17664.1 million during 2026-2030.

The Automl market is expected to grow at a CAGR of 44.5% during 2026-2030.

Automl market is segmented by Type (Services, Platforms, Software tools) Deployment (Cloud, On-premises) Application (Data processing, Model selection, Hyperparameter tuning) Sector (BFSI, Retail and e-commerce, Manufacturing, Healthcare) End-user (Large enterprises, SMEs)

Akkio Inc., Altair Engineering Inc., Alteryx Inc., Amazon Web Services Inc., BigML Inc., Databricks Inc., Dataiku Inc., DataRobot Inc., Google LLC, H2O.ai Inc., Hewlett Packard Enterprise Co., IBM Corp., KNIME AG, Microsoft Corp., Oracle Corp., QlikTech International AB, Salesforce Inc., SAP SE, SAS Institute Inc., TIBCO Software Inc. are a few of the key vendors in the Automl market.

North America will register the highest growth rate of 41.6% among the other regions. Therefore, the Automl market in North America is expected to garner significant business opportunities for the vendors during the forecast period.

US, Canada, Mexico, China, Japan, India, South Korea, Australia, Indonesia, Germany, UK, France, Italy, Spain, The Netherlands, Brazil, Argentina, Chile, Saudi Arabia, UAE, South Africa, Israel, Turkey

  • Increasing democratization of AI amid persistent data science talent shortage is the driving factor this market.

The Automl market vendors should focus on grabbing business opportunities from the Type segment as it accounted for the largest market share in the base year.
RIA - Research AI Assistant
Ask RIA