Automotive Inertial Measurement Unit Sensors Market Size - APAC, North America, Europe, South America, Middle East and Africa - US, China, Japan, Germany, France - Trends and Forecast Report 2024-2028

Automotive Inertial Measurement Unit Sensors Market Size - APAC, North America, Europe, South America, Middle East and Africa - US, China, Japan, Germany, France - Trends and Forecast Report 2024-2028

Published: Jan 2024 172 Pages SKU: IRTNTR41289

Market Overview at a Glance

$8.67 B
Market Opportunity
23.04%
CAGR
21.75
YoY growth 2023-2024(%)

Automotive Inertial Measurement Unit (IMU) Sensors Market 2024-2028 

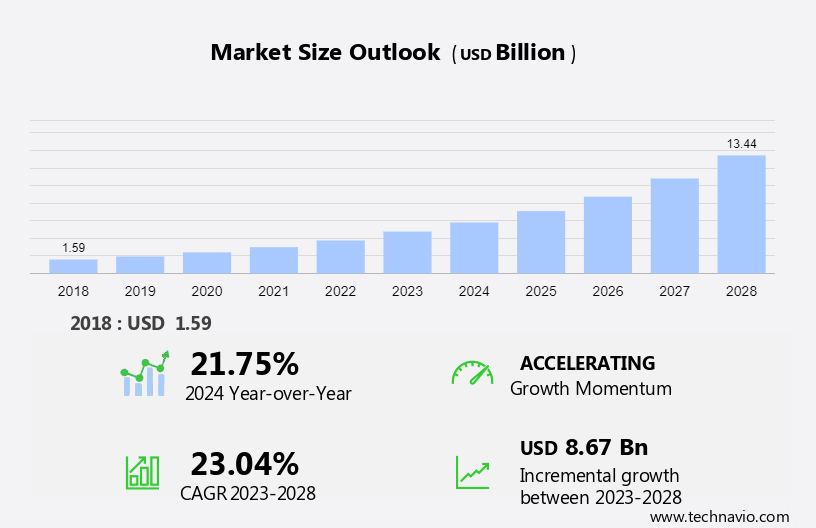
The automotive inertial measurement unit (IMU) sensors market size is forecast to increase by USD 8.67 billion, at a CAGR of 23.04% between 2023 and 2028. Several factors play a crucial role in market growth and forecasting, such as the reduction in the cost of IMU sensors due to economies of scale, the strong demand for IMU sensors from automotive applications, and the presence of stringent regulatory frameworks in automobile safety standards. 

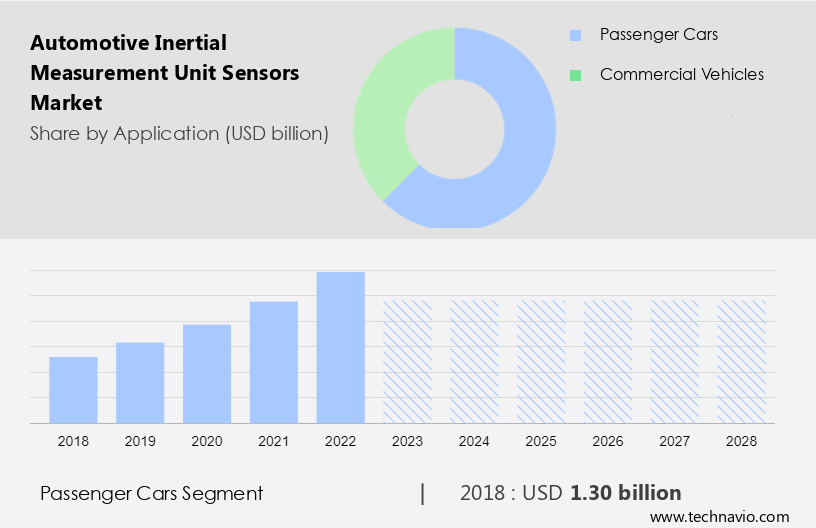
The market forecast report delves into the intricacies of the Automotive Inertial Measurement Unit Sensors Market, offering a detailed outlook on the industry. This comprehensive analysis segments the market by Application, encompassing passenger cars and commercial vehicles. Furthermore, the Product landscape is categorized into FOG-based IMUs and MEMS gyroscope-based IMUs. The report's extensive geographical coverage includes APAC, North America, Europe, South America, and Middle East and Africa.

In addition to these segments, the Automotive Airbag Electronic Control Unit (ECU) is another crucial component of the automotive sector that interacts with IMUs. The market analysis and report provide valuable insights into market size, historical data from 2018 to 2022, and future projections, all presented in terms of value in USD billion for each segment. The Automotive Airbag Electronic Control Unit (ECU) plays a vital role in deploying airbags in the event of a collision, and its integration with IMUs enhances the safety features of modern vehicles by providing real-time data on vehicle dynamics and impact forces

What will be the size of the Automotive Inertial Measurement Unit Sensors Market During the Forecast Period?

Automotive Inertial Measurement Unit Sensors Market Size

For More Highlights About this Report, Download Free Sample in a Minute 

Automotive Inertial Measurement Unit Sensors Market: Key Drivers, Trends and Challenges

Our researchers analyzed the data with 2023 as the base year, along with the key drivers, trends, and challenges. A holistic analysis of drivers will help companies refine their marketing strategies to gain a competitive advantage.

Automotive Inertial Measurement Unit Sensors Market Driver 

As per Automotive Inertial Measurement Unit Sensors Market Analysis,the robust demand for IMU (Inertial Measurement Unit) sensors in automotive applications is a key driver of Automotive Inertial Measurement Unit Sensors market growth. These sensors, including gyroscopes and accelerometers, are integral to ADAS (Advanced Driver Assistance Systems), which are designed to reduce human error while driving and mitigate accident risks. ADAS plays a particularly crucial role during long drives, where fatigue is a leading cause of accidents. Developed regions like North America and Europe are expected to dominate the ADAS market, boosting the growth of the global automotive IMU sensor market during the forecast period.

Furthermore, airbags, which are essential for ensuring occupant safety in the event of a crash, are operated by an airbag control unit that relies on various sensors, such as automotive IMU sensors. The increasing demand for airbags in vehicles is a significant factor driving the adoption of these sensors. As a result, this trend will positively impact the global automotive sensor market.

In addition to automotive applications, IMU sensors are pivotal in several other sectors, including aerospace, defense, consumer electronics, and robotics. In consumer electronics, sensors support functions such as motion tracking, stabilization, and navigation in smartphones, AR/VR systems, and drones. The rise of AI-powered autonomous vehicles, along with the increasing integration of IMU sensors in robotics, drones, and military systems, will further contribute to the market's expansion across various industries.

Automotive Inertial Measurement Unit Sensors Market Trends

The growing development of autonomous vehicles to increase IMU adoption is the primary trend shaping market growth. Leading automotive manufacturers like Mercedes-Benz and BMW are actively propelling the development of self-driving cars, driving significant market trends and analysis. The increasing acceptance of semi-autonomous vehicles is concurrently fueling the demand for automotive sensors. It is anticipated that self-driving or unmanned vehicles will boost the quantum of electronic content in future vehicles, which will aid in accessing large volumes of data to make better decisions while driving. 

Furthermore, the growth in the global autonomous vehicle market is crucial for the growth in the global automotive inertial measurement unit sensors market. This is attributed to the adoption of automotive IMU sensors as an integral part of many systems used in automated vehicles. Thus, the advent of autonomous technology will boost the global automotive inertial measurement unit sensors market growth during the forecast period.

Automotive Inertial Measurement Unit Sensors Market Challenge

Improper tuning of IMU sensors impacting driving behavior is a challenge that affects market growth. Improper tuning of the autonomous car technology system can create problems in vehicles due to the electronic output from sensors (such as IMU sensors) positioned for chassis control. This can cause serious mishaps while driving. Consequently, electronic system manufacturers need to be wary of such consequences if they are to deliver as per the user's expectations. Even occasional faults in the system can have a deleterious effect on the adoption of sensors, which can also negatively impact the overall growth of the market.

Furthermore, multiple sets of calibrations (as required in the sensor fusion unit) increase the power consumption of the device. Good calibration is a prerequisite for sensor fusion and, preferably, without the need for additional hardware. This and the issue of sensor drift are expected to be some of the primary issues to impede market growth during the forecast period.

Automotive Inertial Measurement Unit Sensors Market Customer Landscape

The market research report includes the adoption lifecycle of the market, covering from the innovator's stage to the laggard's stage. It focuses on adoption rates in different regions based on penetration. Furthermore, the market research and growth report also includes key purchase criteria and drivers of price sensitivity to help companies evaluate and develop their growth strategies.

Automotive Inertial Measurement Unit Sensors Market Share by Geography

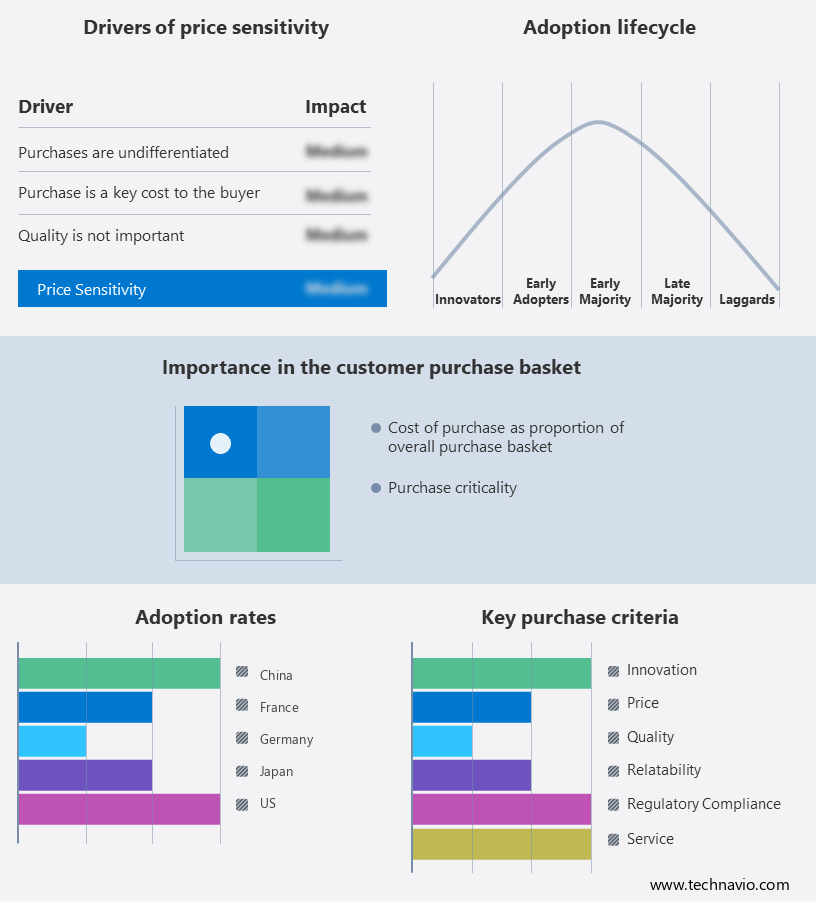
Global Automotive Inertial Measurement Unit Sensors Market Customer Landscape

Who are the Major Automotive Inertial Measurement Unit Sensors Market Companies?

Companies are implementing various strategies, such as strategic alliances, partnerships, mergers and acquisitions, geographical expansion, and product/service launches, to enhance their presence in the market.

  • ACEINNA Inc.: The company offers intertial measurement unit sensors such as IMU330RA sensor that is designed for use in automotive level 3 and higher ADAS systems.

The research report also includes detailed analyses of the competitive landscape of the market and information about 17 market companies, including:

  • Adafruit Industries LLC
  • Advanced Navigation Pty Ltd.
  • Continental AG
  • Gladiator Technologies Inc.
  • Honeywell International Inc.
  • Hottinger Bruel and Kjaer GmbH
  • ifm electronic gmbh
  • Murata Manufacturing Co. Ltd.
  • ON Semiconductor Corp.
  • Robert Bosch GmbH
  • Safran SA
  • STMicroelectronics International N.V.
  • TE Connectivity Ltd.
  • Texas Instruments Inc.
  • Thales Group
  • VectorNav Technologies LLC

Qualitative and quantitative analysis of companies has been conducted to help clients understand the wider business environment as well as the strengths and weaknesses of key market players. Data is qualitatively analyzed to categorize companies as pure play, category-focused, industry-focused, and diversified; it is quantitatively analyzed to categorize companies as dominant, leading, strong, tentative, and weak.

Latest Market Development and News

  • In December 2023, STMicroelectronics introduced the ASM330LHBG1, an automotive-grade 6-axis IMU sensor designed for advanced driver assistance systems (ADAS) and navigation applications. This sensor combines accelerometer and gyroscope functionalities to enhance vehicle safety and performance.

  • In November 2023, a comprehensive market analysis projected the automotive IMU sensors market to reach USD 27,243.96 million by 2032, growing at a compound annual growth rate (CAGR) of 19.96% from 2024 to 2032. This growth is driven by the increasing adoption of autonomous vehicles, electric vehicles, and advanced driver assistance systems (ADAS).

  • In January 2024, Technavio released a forecast indicating that the automotive IMU sensors market is expected to grow by USD 8.67 billion between 2023 and 2028, at a CAGR of 23.04%. This growth is attributed to the rising demand for IMU sensors in automotive applications, including passenger cars and commercial vehicles.

  • In February 2024, a market research report highlighted that the automotive IMU sensors market is projected to grow significantly at a CAGR of 8.4% during the forecast period from 2021 to 2028. This growth is driven by the increasing demand for car safety and driver assistance systems, such as autonomous driving and collision avoidance.

What is the Largest-Growing Segments in the Automotive Inertial Measurement Unit Sensors Market?

The passenger cars segment StartFragment is estimated to witness significant growth during the forecast period. The growing focus of the automotive OEMs toward offering advanced navigation systems and ADAS is fostering the adoption of IMU sensors in the passenger cars segment. Navigation systems are widely adopted due to the growing penetration of infotainment systems in passenger cars. 

Automotive Inertial Measurement Unit Sensors Market Size

Get a glance at the market contribution of various segments Download the PDF Sample

The passenger cars segment StartFragment was the largest segment and was valued at  USD 1.30 billion in 2018In the past few years, growing concerns about safety among consumers have compelled automobile manufacturers to incorporate additional advanced safety features in vehicles, especially in entry-level vehicles. Furthermore, the growing focus of automotive OEMs on transitioning to fully autonomous vehicles is fostering the development of various sensor technologies that incorporate driver assistance systems for use during critical events. These developments will be a positive driver for the growth of the global automotive inertial measurement unit sensors market in this segment during the forecast period.

Which are the Key Regions for the Automotive Inertial Measurement Unit Sensors Market?

Automotive Inertial Measurement Unit Sensors Market Share by Geography

For more insights on the market share of various regions Download PDF Sample now!

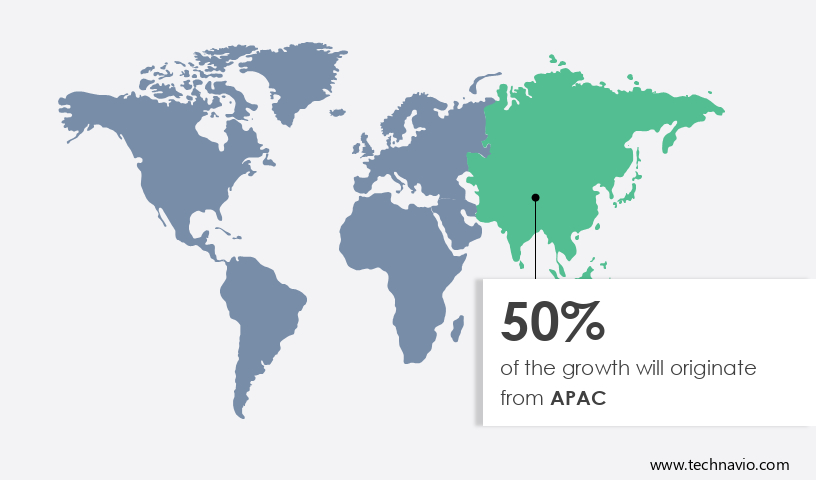
APAC is estimated to contribute 50% to the growth of the global market during the forecast period. Technavio's analysts have elaborately explained the regional trends and drivers that shape the market during the forecast period. In APAC, China, India, and Japan are the prominent revenue-contributing countries in the automotive inertial measurement unit (IMU) sensors market. China, India, Japan, and South Korea are the dominant markets in APAC, where China leads the market, followed by Japan and India.

Furthermore, sensor companies are also attracted to markets in APAC. Some of these players have located their foundries to mark the beginning of a long-term presence in the region. Additionally, establishing a supplier base in APAC gives automotive OEMs significant cost benefits and also enables collaborative working models that may spark innovation in drivetrain technologies for future vehicles. Such developments are anticipated to expand the market for automotive IMU sensor manufacturers in APAC during the forecast period. 

Segment Overview

The automotive inertial measurement unit sensors market report forecasts market growth analysis by revenue at global, regional & country levels and provides an analysis of the market growth and trends from 2018 to 2028. 

  • Application Outlook
    • Passenger cars
    • Commercial vehicles
  • Product Outlook 
    • FOG-based IMUs
    • MEMS gyroscope-based IMUs
  • Region Outlook 
    • North America
      • The U.S.
      • Canada
    • Europe
      • The U.K.
      • Germany
      • France
      • Rest of Europe
    • APAC
      • China
      • India
    • South America
      • Chile
      • Brazil
      • Argentina
    • Middle East & Africa
      • Saudi Arabia
      • South Africa
      • Rest of the Middle East & Africa

Automotive Inertial Measurement Unit Sensors Market Scope

Report Coverage

Details

Page number

172

Base year

2023

Historic period

2018-2022

Market forecasting period

2024-2028

Growth momentum & CAGR

Accelerate at a CAGR of 23.04%

Market Growth 2024-2028

USD 8.67 billion

Market structure

Fragmented

YoY growth 2023-2024(%)

21.75

Regional analysis

APAC, North America, Europe, South America, and Middle East and Africa

Performing market contribution

APAC at 50%

Key countries

US, China, Japan, Germany, and France

Competitive landscape

Leading Companies, Market Positioning of Companies, Competitive Strategies, and Industry Risks

Key companies profiled

ACEINNA Inc., Adafruit Industries LLC, Advanced Navigation Pty Ltd., Continental AG, Gladiator Technologies Inc., Honeywell International Inc., Hottinger Bruel and Kjaer GmbH, ifm electronic gmbh, Murata Manufacturing Co. Ltd., ON Semiconductor Corp., Robert Bosch GmbH, Safran SA, STMicroelectronics International N.V., TE Connectivity Ltd., Texas Instruments Inc., Thales Group, and VectorNav Technologies LLC

Market dynamics

Parent market analysis, Market growth inducers and obstacles, Fast-growing and slow-growing segment analysis, COVID-19 impact and recovery analysis and future consumer dynamics, Market condition analysis for the forecast period. 

Customization purview

If our report has not included the data that you are looking for, you can reach out to our analysts and get segments customized.

Download PDF Sample

What are the Key Data Covered in this Automotive Inertial Measurement Unit Sensors Market Research Report?

  • CAGR of the market during the forecast period
  • Detailed information on factors that will drive the growth of the market between 2024 and 2028
  • Precise estimation of the market size and its contribution to the market in focus to the parent market
  • Accurate predictions about upcoming trends and changes in consumer behavior
  • Growth of the market across APAC, North America, Europe, South America, and the Middle East and Africa
  • A thorough analysis of the market's competitive landscape and detailed information about companies
  • Comprehensive analysis of factors that will challenge the growth of market companies

We can help! Our analysts can customize this market research report to meet your requirements. 

Get in touch

1 Executive Summary

  • 1.1 Market overview
    • Exhibit 01: Executive Summary – Chart on Market Overview
    • Exhibit 02: Executive Summary – Data Table on Market Overview
    • Exhibit 03: Executive Summary – Chart on Global Market Characteristics
    • Exhibit 04: Executive Summary – Chart on Market by Geography
    • Exhibit 05: Executive Summary – Chart on Market Segmentation by Application
    • Exhibit 06: Executive Summary – Chart on Market Segmentation by Product
    • Exhibit 07: Executive Summary – Chart on Incremental Growth
    • Exhibit 08: Executive Summary – Data Table on Incremental Growth
    • Exhibit 09: Executive Summary – Chart on Vendor Market Positioning

2 Market Landscape

  • 2.1 Market ecosystem
    • Exhibit 10: Parent market
    • Exhibit 11: Market Characteristics

3 Market Sizing

  • 3.1 Market definition
    • Exhibit 12: Offerings of vendors included in the market definition
  • 3.2 Market segment analysis
    • Exhibit 13: Market segments
  • 3.3 Market size 2023
    • 3.4 Market outlook: Forecast for 2023-2028
      • Exhibit 14: Chart on Global - Market size and forecast 2023-2028 ($ billion)
      • Exhibit 15: Data Table on Global - Market size and forecast 2023-2028 ($ billion)
      • Exhibit 16: Chart on Global Market: Year-over-year growth 2023-2028 (%)
      • Exhibit 17: Data Table on Global Market: Year-over-year growth 2023-2028 (%)

    4 Historic Market Size

    • 4.1 Global automotive inertial measurement unit sensors market 2018 - 2022
      • Exhibit 18: Historic Market Size – Data Table on global automotive inertial measurement unit sensors market 2018 - 2022 ($ billion)
    • 4.2 Application Segment Analysis 2018 - 2022
      • Exhibit 19: Historic Market Size – Application Segment 2018 - 2022 ($ billion)
    • 4.3 Product Segment Analysis 2018 - 2022
      • Exhibit 20: Historic Market Size – Product Segment 2018 - 2022 ($ billion)
    • 4.4 Geography Segment Analysis 2018 - 2022
      • Exhibit 21: Historic Market Size – Geography Segment 2018 - 2022 ($ billion)
    • 4.5 Country Segment Analysis 2018 - 2022
      • Exhibit 22: Historic Market Size – Country Segment 2018 - 2022 ($ billion)

    5 Five Forces Analysis

    • 5.1 Five forces summary
      • Exhibit 23: Five forces analysis - Comparison between 2023 and 2028
    • 5.2 Bargaining power of buyers
      • Exhibit 24: Chart on Bargaining power of buyers – Impact of key factors 2023 and 2028
    • 5.3 Bargaining power of suppliers
      • Exhibit 25: Bargaining power of suppliers – Impact of key factors in 2023 and 2028
    • 5.4 Threat of new entrants
      • Exhibit 26: Threat of new entrants – Impact of key factors in 2023 and 2028
    • 5.5 Threat of substitutes
      • Exhibit 27: Threat of substitutes – Impact of key factors in 2023 and 2028
    • 5.6 Threat of rivalry
      • Exhibit 28: Threat of rivalry – Impact of key factors in 2023 and 2028
    • 5.7 Market condition
      • Exhibit 29: Chart on Market condition - Five forces 2023 and 2028

    6 Market Segmentation by Application

    • 6.1 Market segments
      • Exhibit 30: Chart on Application - Market share 2023-2028 (%)
      • Exhibit 31: Data Table on Application - Market share 2023-2028 (%)
    • 6.2 Comparison by Application
      • Exhibit 32: Chart on Comparison by Application
      • Exhibit 33: Data Table on Comparison by Application
    • 6.3 Passenger cars - Market size and forecast 2023-2028
      • Exhibit 34: Chart on Passenger cars - Market size and forecast 2023-2028 ($ billion)
      • Exhibit 35: Data Table on Passenger cars - Market size and forecast 2023-2028 ($ billion)
      • Exhibit 36: Chart on Passenger cars - Year-over-year growth 2023-2028 (%)
      • Exhibit 37: Data Table on Passenger cars - Year-over-year growth 2023-2028 (%)
    • 6.4 Commercial vehicles - Market size and forecast 2023-2028
      • Exhibit 38: Chart on Commercial vehicles - Market size and forecast 2023-2028 ($ billion)
      • Exhibit 39: Data Table on Commercial vehicles - Market size and forecast 2023-2028 ($ billion)
      • Exhibit 40: Chart on Commercial vehicles - Year-over-year growth 2023-2028 (%)
      • Exhibit 41: Data Table on Commercial vehicles - Year-over-year growth 2023-2028 (%)
    • 6.5 Market opportunity by Application
      • Exhibit 42: Market opportunity by Application ($ billion)
      • Exhibit 43: Data Table on Market opportunity by Application ($ billion)

    7 Market Segmentation by Product

    • 7.1 Market segments
      • Exhibit 44: Chart on Product - Market share 2023-2028 (%)
      • Exhibit 45: Data Table on Product - Market share 2023-2028 (%)
    • 7.2 Comparison by Product
      • Exhibit 46: Chart on Comparison by Product
      • Exhibit 47: Data Table on Comparison by Product
    • 7.3 FOG-based IMUs - Market size and forecast 2023-2028
      • Exhibit 48: Chart on FOG-based IMUs - Market size and forecast 2023-2028 ($ billion)
      • Exhibit 49: Data Table on FOG-based IMUs - Market size and forecast 2023-2028 ($ billion)
      • Exhibit 50: Chart on FOG-based IMUs - Year-over-year growth 2023-2028 (%)
      • Exhibit 51: Data Table on FOG-based IMUs - Year-over-year growth 2023-2028 (%)
    • 7.4 MEMS gyroscope-based IMUs - Market size and forecast 2023-2028
      • Exhibit 52: Chart on MEMS gyroscope-based IMUs - Market size and forecast 2023-2028 ($ billion)
      • Exhibit 53: Data Table on MEMS gyroscope-based IMUs - Market size and forecast 2023-2028 ($ billion)
      • Exhibit 54: Chart on MEMS gyroscope-based IMUs - Year-over-year growth 2023-2028 (%)
      • Exhibit 55: Data Table on MEMS gyroscope-based IMUs - Year-over-year growth 2023-2028 (%)
    • 7.5 Market opportunity by Product
      • Exhibit 56: Market opportunity by Product ($ billion)
      • Exhibit 57: Data Table on Market opportunity by Product ($ billion)

    8 Customer Landscape

    • 8.1 Customer landscape overview
      • Exhibit 58: Analysis of price sensitivity, lifecycle, customer purchase basket, adoption rates, and purchase criteria

    9 Geographic Landscape

    • 9.1 Geographic segmentation
      • Exhibit 59: Chart on Market share by geography 2023-2028 (%)
      • Exhibit 60: Data Table on Market share by geography 2023-2028 (%)
    • 9.2 Geographic comparison
      • Exhibit 61: Chart on Geographic comparison
      • Exhibit 62: Data Table on Geographic comparison
    • 9.3 APAC - Market size and forecast 2023-2028
      • Exhibit 63: Chart on APAC - Market size and forecast 2023-2028 ($ billion)
      • Exhibit 64: Data Table on APAC - Market size and forecast 2023-2028 ($ billion)
      • Exhibit 65: Chart on APAC - Year-over-year growth 2023-2028 (%)
      • Exhibit 66: Data Table on APAC - Year-over-year growth 2023-2028 (%)
    • 9.4 North America - Market size and forecast 2023-2028
      • Exhibit 67: Chart on North America - Market size and forecast 2023-2028 ($ billion)
      • Exhibit 68: Data Table on North America - Market size and forecast 2023-2028 ($ billion)
      • Exhibit 69: Chart on North America - Year-over-year growth 2023-2028 (%)
      • Exhibit 70: Data Table on North America - Year-over-year growth 2023-2028 (%)
    • 9.5 Europe - Market size and forecast 2023-2028
      • Exhibit 71: Chart on Europe - Market size and forecast 2023-2028 ($ billion)
      • Exhibit 72: Data Table on Europe - Market size and forecast 2023-2028 ($ billion)
      • Exhibit 73: Chart on Europe - Year-over-year growth 2023-2028 (%)
      • Exhibit 74: Data Table on Europe - Year-over-year growth 2023-2028 (%)
    • 9.6 South America - Market size and forecast 2023-2028
      • Exhibit 75: Chart on South America - Market size and forecast 2023-2028 ($ billion)
      • Exhibit 76: Data Table on South America - Market size and forecast 2023-2028 ($ billion)
      • Exhibit 77: Chart on South America - Year-over-year growth 2023-2028 (%)
      • Exhibit 78: Data Table on South America - Year-over-year growth 2023-2028 (%)
    • 9.7 Middle East and Africa - Market size and forecast 2023-2028
      • Exhibit 79: Chart on Middle East and Africa - Market size and forecast 2023-2028 ($ billion)
      • Exhibit 80: Data Table on Middle East and Africa - Market size and forecast 2023-2028 ($ billion)
      • Exhibit 81: Chart on Middle East and Africa - Year-over-year growth 2023-2028 (%)
      • Exhibit 82: Data Table on Middle East and Africa - Year-over-year growth 2023-2028 (%)
    • 9.8 US - Market size and forecast 2023-2028
      • Exhibit 83: Chart on US - Market size and forecast 2023-2028 ($ billion)
      • Exhibit 84: Data Table on US - Market size and forecast 2023-2028 ($ billion)
      • Exhibit 85: Chart on US - Year-over-year growth 2023-2028 (%)
      • Exhibit 86: Data Table on US - Year-over-year growth 2023-2028 (%)
    • 9.9 China - Market size and forecast 2023-2028
      • Exhibit 87: Chart on China - Market size and forecast 2023-2028 ($ billion)
      • Exhibit 88: Data Table on China - Market size and forecast 2023-2028 ($ billion)
      • Exhibit 89: Chart on China - Year-over-year growth 2023-2028 (%)
      • Exhibit 90: Data Table on China - Year-over-year growth 2023-2028 (%)
    • 9.10 Japan - Market size and forecast 2023-2028
      • Exhibit 91: Chart on Japan - Market size and forecast 2023-2028 ($ billion)
      • Exhibit 92: Data Table on Japan - Market size and forecast 2023-2028 ($ billion)
      • Exhibit 93: Chart on Japan - Year-over-year growth 2023-2028 (%)
      • Exhibit 94: Data Table on Japan - Year-over-year growth 2023-2028 (%)
    • 9.11 Germany - Market size and forecast 2023-2028
      • Exhibit 95: Chart on Germany - Market size and forecast 2023-2028 ($ billion)
      • Exhibit 96: Data Table on Germany - Market size and forecast 2023-2028 ($ billion)
      • Exhibit 97: Chart on Germany - Year-over-year growth 2023-2028 (%)
      • Exhibit 98: Data Table on Germany - Year-over-year growth 2023-2028 (%)
    • 9.12 France - Market size and forecast 2023-2028
      • Exhibit 99: Chart on France - Market size and forecast 2023-2028 ($ billion)
      • Exhibit 100: Data Table on France - Market size and forecast 2023-2028 ($ billion)
      • Exhibit 101: Chart on France - Year-over-year growth 2023-2028 (%)
      • Exhibit 102: Data Table on France - Year-over-year growth 2023-2028 (%)
    • 9.13 Market opportunity by geography
      • Exhibit 103: Market opportunity by geography ($ billion)
      • Exhibit 104: Data Tables on Market opportunity by geography ($ billion)

    10 Drivers, Challenges, and Trends

    • 10.1 Market drivers
      • 10.2 Market challenges
        • 10.3 Impact of drivers and challenges
          • Exhibit 105: Impact of drivers and challenges in 2023 and 2028
        • 10.4 Market trends

          11 Vendor Landscape

          • 11.1 Overview
            • 11.2 Vendor landscape
              • Exhibit 106: Overview on Criticality of inputs and Factors of differentiation
            • 11.3 Landscape disruption
              • Exhibit 107: Overview on factors of disruption
            • 11.4 Industry risks
              • Exhibit 108: Impact of key risks on business

            12 Vendor Analysis

            • 12.1 Vendors covered
              • Exhibit 109: Vendors covered
            • 12.2 Market positioning of vendors
              • Exhibit 110: Matrix on vendor position and classification
            • 12.3 ACEINNA Inc.
              • Exhibit 111: ACEINNA Inc. - Overview
              • Exhibit 112: ACEINNA Inc. - Product / Service
              • Exhibit 113: ACEINNA Inc. - Key offerings
            • 12.4 Adafruit Industries LLC
              • Exhibit 114: Adafruit Industries LLC - Overview
              • Exhibit 115: Adafruit Industries LLC - Product / Service
              • Exhibit 116: Adafruit Industries LLC - Key offerings
            • 12.5 Advanced Navigation Pty Ltd.
              • Exhibit 117: Advanced Navigation Pty Ltd. - Overview
              • Exhibit 118: Advanced Navigation Pty Ltd. - Product / Service
              • Exhibit 119: Advanced Navigation Pty Ltd. - Key offerings
            • 12.6 Continental AG
              • Exhibit 120: Continental AG - Overview
              • Exhibit 121: Continental AG - Business segments
              • Exhibit 122: Continental AG - Key offerings
              • Exhibit 123: Continental AG - Segment focus
            • 12.7 Honeywell International Inc.
              • Exhibit 124: Honeywell International Inc. - Overview
              • Exhibit 125: Honeywell International Inc. - Business segments
              • Exhibit 126: Honeywell International Inc. - Key news
              • Exhibit 127: Honeywell International Inc. - Key offerings
              • Exhibit 128: Honeywell International Inc. - Segment focus
            • 12.8 Hottinger Bruel and Kjaer GmbH
              • Exhibit 129: Hottinger Bruel and Kjaer GmbH - Overview
              • Exhibit 130: Hottinger Bruel and Kjaer GmbH - Product / Service
              • Exhibit 131: Hottinger Bruel and Kjaer GmbH - Key offerings
            • 12.9 ifm electronic gmbh
              • Exhibit 132: ifm electronic gmbh - Overview
              • Exhibit 133: ifm electronic gmbh - Product / Service
              • Exhibit 134: ifm electronic gmbh - Key offerings
            • 12.10 Murata Manufacturing Co. Ltd.
              • Exhibit 135: Murata Manufacturing Co. Ltd. - Overview
              • Exhibit 136: Murata Manufacturing Co. Ltd. - Business segments
              • Exhibit 137: Murata Manufacturing Co. Ltd. - Key news
              • Exhibit 138: Murata Manufacturing Co. Ltd. - Key offerings
              • Exhibit 139: Murata Manufacturing Co. Ltd. - Segment focus
            • 12.11 ON Semiconductor Corp.
              • Exhibit 140: ON Semiconductor Corp. - Overview
              • Exhibit 141: ON Semiconductor Corp. - Business segments
              • Exhibit 142: ON Semiconductor Corp. - Key offerings
              • Exhibit 143: ON Semiconductor Corp. - Segment focus
            • 12.12 Robert Bosch GmbH
              • Exhibit 144: Robert Bosch GmbH - Overview
              • Exhibit 145: Robert Bosch GmbH - Business segments
              • Exhibit 146: Robert Bosch GmbH - Key news
              • Exhibit 147: Robert Bosch GmbH - Key offerings
              • Exhibit 148: Robert Bosch GmbH - Segment focus
            • 12.13 Safran SA
              • Exhibit 149: Safran SA - Overview
              • Exhibit 150: Safran SA - Business segments
              • Exhibit 151: Safran SA - Key news
              • Exhibit 152: Safran SA - Key offerings
              • Exhibit 153: Safran SA - Segment focus
            • 12.14 STMicroelectronics International N.V.
              • Exhibit 154: STMicroelectronics International N.V. - Overview
              • Exhibit 155: STMicroelectronics International N.V. - Business segments
              • Exhibit 156: STMicroelectronics International N.V. - Key news
              • Exhibit 157: STMicroelectronics International N.V. - Key offerings
              • Exhibit 158: STMicroelectronics International N.V. - Segment focus
            • 12.15 TE Connectivity Ltd.
              • Exhibit 159: TE Connectivity Ltd. - Overview
              • Exhibit 160: TE Connectivity Ltd. - Business segments
              • Exhibit 161: TE Connectivity Ltd. - Key offerings
              • Exhibit 162: TE Connectivity Ltd. - Segment focus
            • 12.16 Texas Instruments Inc.
              • Exhibit 163: Texas Instruments Inc. - Overview
              • Exhibit 164: Texas Instruments Inc. - Business segments
              • Exhibit 165: Texas Instruments Inc. - Key news
              • Exhibit 166: Texas Instruments Inc. - Key offerings
              • Exhibit 167: Texas Instruments Inc. - Segment focus
            • 12.17 Thales Group
              • Exhibit 168: Thales Group - Overview
              • Exhibit 169: Thales Group - Business segments
              • Exhibit 170: Thales Group - Key news
              • Exhibit 171: Thales Group - Key offerings
              • Exhibit 172: Thales Group - Segment focus

            13 Appendix

            • 13.1 Scope of the report
              • 13.2 Inclusions and exclusions checklist
                • Exhibit 173: Inclusions checklist
                • Exhibit 174: Exclusions checklist
              • 13.3 Currency conversion rates for US$
                • Exhibit 175: Currency conversion rates for US$
              • 13.4 Research methodology
                • Exhibit 176: Research methodology
                • Exhibit 177: Validation techniques employed for market sizing
                • Exhibit 178: Information sources
              • 13.5 List of abbreviations
                • Exhibit 179: List of abbreviations

              Research Methodology

              Technavio presents a detailed picture of the market by way of study, synthesis, and summation of data from multiple sources. The analysts have presented the various facets of the market with a particular focus on identifying the key industry influencers. The data thus presented is comprehensive, reliable, and the result of extensive research, both primary and secondary.

              INFORMATION SOURCES

              Primary sources

              • Manufacturers and suppliers
              • Channel partners
              • Industry experts
              • Strategic decision makers

              Secondary sources

              • Industry journals and periodicals
              • Government data
              • Financial reports of key industry players
              • Historical data
              • Press releases

              DATA ANALYSIS

              Data Synthesis

              • Collation of data
              • Estimation of key figures
              • Analysis of derived insights

              Data Validation

              • Triangulation with data models
              • Reference against proprietary databases
              • Corroboration with industry experts

              REPORT WRITING

              Qualitative

              • Market drivers
              • Market challenges
              • Market trends
              • Five forces analysis

              Quantitative

              • Market size and forecast
              • Market segmentation
              • Geographical insights
              • Competitive landscape

              Interested in this report?

              Get your sample now to see our research methodology and insights!

              Download Now

              Frequently Asked Questions

              Automotive Inertial Measurement Unit Sensors market growth will increase by $ 8.67 bn during 2024-2028 .

              The Automotive Inertial Measurement Unit Sensors market is expected to grow at a CAGR of 23.04% during 2024-2028 .

              Automotive Inertial Measurement Unit Sensors market is segmented by Application( Passenger cars, Commercial vehicles) Product( FOG-based IMUs, MEMS gyroscope-based IMUs, Europe, South America)

              ACEINNA Inc., Adafruit Industries LLC, Advanced Navigation Pty Ltd., Continental AG, Gladiator Technologies Inc., Honeywell International Inc., Hottinger Bruel and Kjaer GmbH, ifm electronic gmbh, Murata Manufacturing Co. Ltd., ON Semiconductor Corp., Robert Bosch GmbH, Safran SA, STMicroelectronics International N.V., TE Connectivity Ltd., Texas Instruments Inc., Thales Group, VectorNav Technologies LLC are a few of the key vendors in the Automotive Inertial Measurement Unit Sensors market.

              APAC will register the highest growth rate of 50% among the other regions. Therefore, the Automotive Inertial Measurement Unit Sensors market in APAC is expected to garner significant business opportunities for the vendors during the forecast period.

              US, China, Japan, Germany, France

              • Reduction in cost of IMU sensors due to economies of scaleSuppliers started offering low-cost solutions through economies of scale due to advancements in manufacturing technologies. For instance is the driving factor this market.
              • the cost of sensors has been reduced in the last decade because of their wider adoption in various segments such as smart homes and automotive. Due to the cost reduction is the driving factor this market.
              • automotive OEMs are able to offer modern vehicles equipped with several sensors (at times even more than sixty sensors) used in various applications. Advances in autonomous vehicle technology are expected to foster the demand for automotive IMU sensors. Automotive IMU sensors are used in conjunction with LiDAR (Light Detection and Ranging) is the driving factor this market.
              • cameras is the driving factor this market.
              • and other radar-like sensors to provide the navigational intelligence needed for autonomous cars to function on the road alongside human-driven vehicles. Automotive IMU sensors provide precise azimuthal measurements that are essential for autonomous cars to function accurately in curvilinear motion. Furthermore is the driving factor this market.
              • automotive IMU sensors also provide six degrees of freedom angular velocity and acceleration data for the car to calculate its own position offline in the absence of GPS signals in areas with low connectivity. Earlier is the driving factor this market.
              • MEMS gyroscope-based IMUs were extensively used in automobiles as they were heavy but cost-effective. However is the driving factor this market.
              • because of their inability to provide precise data is the driving factor this market.
              • the demand for FOG-based IMUs has increased is the driving factor this market.
              • especially in the autonomous vehicle segment. FOG-based IMUs are more precise and lightweight than MEMS-based IMUs. These sensors are costlier but best suited for autonomous vehicles. Thus is the driving factor this market.
              • the growing adoption of FOG-based IMUs will boost market growth. The demand for a substantial reduction in the net manufacturing cost of these IMUs is motivating suppliers to achieve economies of scale for automotive IMU sensors. KVH Industries Inc. offers low-cost FOG-based IMUs for various applications. The company also offers low-cost IMUs equipped with FOG-based IMUs and GPS for autonomous cars. KVH Industries Inc. has claimed it was able to meet such cost criteria as it controls the entire FOG-based IMU design and manufacturing process is the driving factor this market.
              • which allowed enough leeway to cut costs. This cost reduction is fueling the adoption of FOG-based IMUs in the automotive market. These new manufacturing practices will propel the growth of the global automotive inertial measurement unit sensors market during the forecast period. is the driving factor this market.

              The Automotive Inertial Measurement Unit Sensors market vendors should focus on grabbing business opportunities from the Passenger cars segment as it accounted for the largest market share in the base year.