Automotive Junction Box Market Analysis, Size, and Forecast 2025-2029: APAC (Japan, China, and India), North America (US, Canada, and Mexico), Europe (Germany, UK, and France), South America (Brazil, Argentina, and Colombia), Middle East and Africa (UAE, Saudi Arabia, and South Africa), and Rest of World (ROW)

Automotive Junction Box Market Analysis, Size, and Forecast 2025-2029:
APAC (Japan, China, and India), North America (US, Canada, and Mexico), Europe (Germany, UK, and France), South America (Brazil, Argentina, and Colombia), Middle East and Africa (UAE, Saudi Arabia, and South Africa), and Rest of World (ROW)

Published: Dec 2025 292 Pages SKU: IRTNTR46505

Market Overview at a Glance

$4.91 B
Market Opportunity
10.5%
CAGR 2024 - 2029
56.5%
APAC Growth
$4.89 B
Passenger cars segment 2023

Automotive Junction Box Market Size 2025-2029

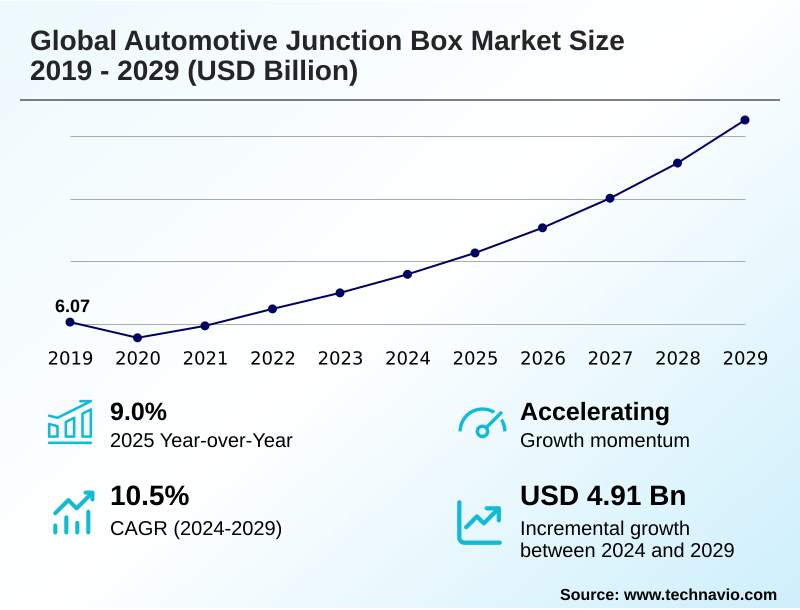
The automotive junction box market size is valued to increase by USD 4.91 billion, at a CAGR of 10.5% from 2024 to 2029. Penetration of hybrid and electric powertrains will drive the automotive junction box market.

Major Market Trends & Insights

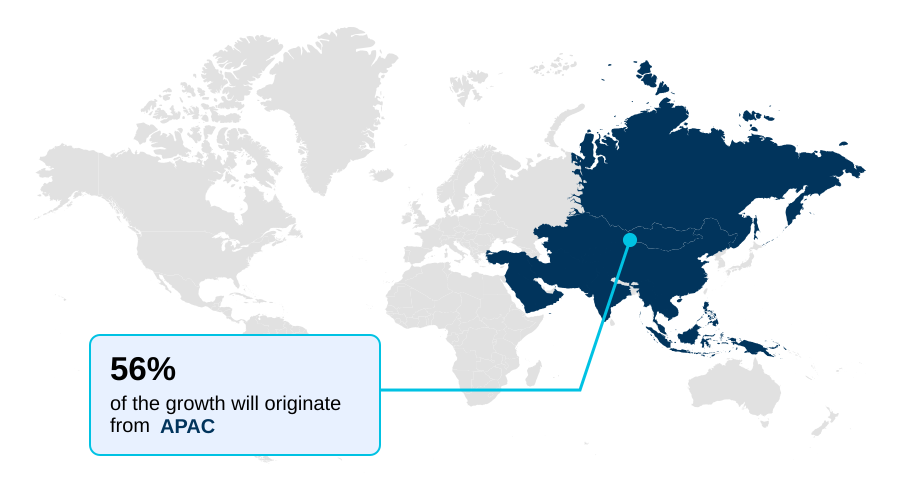
  • APAC dominated the market and accounted for a 56.5% growth during the forecast period.
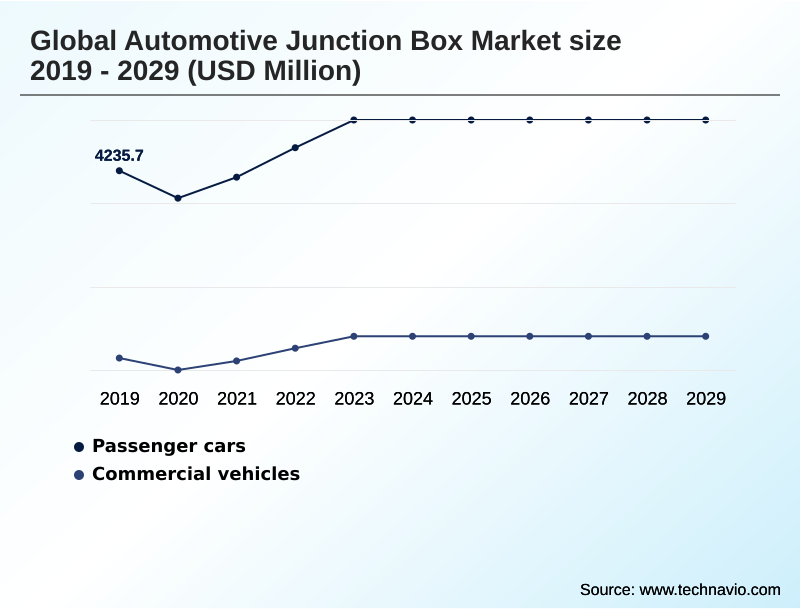
  • By Vehicle Type - Passenger cars segment was valued at USD 4.89 billion in 2023
  • By Technology - Smart junction box segment accounted for the largest market revenue share in 2023

Market Size & Forecast

  • Market Opportunities: USD 6.42 billion
  • Market Future Opportunities: USD 4.91 billion
  • CAGR from 2024 to 2029 : 10.5%

Market Summary

  • The automotive junction box market is transitioning from conventional fuse and relay centers to highly sophisticated electrical distribution systems. This evolution is driven by the inexorable rise of vehicle electrification and the increasing complexity of automotive electronics systems.
  • A modern power distribution unit is no longer just a passive safety device; it is an intelligent hub responsible for high-current circuit management and seamless vehicle power distribution. In a typical business scenario, an automaker developing a new electric vehicle platform must optimize its entire vehicle electrical architecture.
  • By implementing a zonal electrical architecture with multiple smart junction box modules, the company can significantly reduce the complexity and weight of its high-voltage wiring harness. This strategy not only improves manufacturing efficiency but also enhances the vehicle's overall performance and reliability.
  • As vehicles become more connected and autonomous, the role of the power distribution module as a critical enabler of advanced functionalities will only intensify, making it a focal point for innovation in automotive power electronics and microcontroller-based technology.

What will be the Size of the Automotive Junction Box Market during the forecast period?

Get Key Insights on Market Forecast (PDF) Request Free Sample

How is the Automotive Junction Box Market Segmented?

The automotive junction box industry research report provides comprehensive data (region-wise segment analysis), with forecasts and estimates in "USD million" for the period 2025-2029, as well as historical data from 2019-2023 for the following segments.

  • Vehicle type
    • Passenger cars
    • Commercial vehicles
  • Technology
    • Smart junction box
    • Passive junction box
  • Channel
    • OEMs
    • Aftermarket
  • Geography
    • APAC
      • Japan
      • China
      • India
    • North America
      • US
      • Canada
      • Mexico
    • Europe
      • Germany
      • UK
      • France
    • South America
      • Brazil
      • Argentina
      • Colombia
    • Middle East and Africa
      • UAE
      • Saudi Arabia
      • South Africa
    • Rest of World (ROW)

By Vehicle Type Insights

The passenger cars segment is estimated to witness significant growth during the forecast period.

The passenger car segment is undergoing a significant transformation, driven by the dual trends of electrification and the proliferation of advanced electronic features.

The traditional reliance on a passive junction box is yielding to the adoption of the smart junction box, which is essential for managing the complex power requirements of modern vehicles.

As automakers integrate more advanced driver-assistance systems (ADAS), the demands on in-vehicle power management intensify. In response, designers are leveraging resettable poly switch devices and exploring zonal electrical architecture to streamline wiring and improve reliability.

The development of sophisticated thermal management solutions is critical, especially within electric vehicle powertrains.

This shift toward intelligent power distribution is not merely an upgrade; it is a fundamental redesign, with some integrated systems reducing the number of discrete components by over 30%, simplifying manufacturing and enhancing diagnostic capabilities in software-defined vehicle platforms.

Request Free Sample

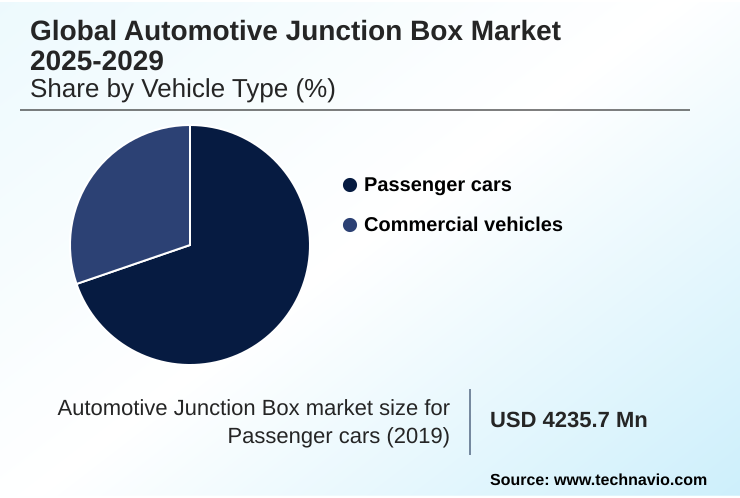
The Passenger cars segment was valued at USD 4.89 billion in 2023 and showed a gradual increase during the forecast period.

Request Free Sample

Regional Analysis

APAC is estimated to contribute 56.5% to the growth of the global market during the forecast period.Technavio’s analysts have elaborately explained the regional trends and drivers that shape the market during the forecast period.

See How Automotive Junction Box Market Demand is Rising in APAC Request Free Sample

The geographic landscape is defined by distinct regional dynamics and OEM sourcing strategy priorities.

APAC currently dominates, accounting for over 56% of the market's incremental growth, a direct result of its massive scale in electric vehicle production and a robust automotive manufacturing process for components like the high-voltage wiring harness.

This region's focus is on volume and cost-effective supply chain logistics.

In contrast, North America contributes nearly 23% of the growth, driven by demand for high-value, technologically advanced components such as the power distribution unit and battery disconnect unit, particularly for electric trucks and SUVs.

Europe's market is characterized by stringent automotive safety standards, pushing innovation in vehicle control unit integration and advanced power management solutions.

The dynamics of aftermarket replacement parts also vary, with mature markets demanding sophisticated replacements while emerging regions focus on basic component availability.

Market Dynamics

Our researchers analyzed the data with 2024 as the base year, along with the key drivers, trends, and challenges. A holistic analysis of drivers will help companies refine their marketing strategies to gain a competitive advantage.

  • A critical debate in modern vehicle design is the choice between a smart junction box vs passive junction box. While passive boxes offer simplicity, smart systems provide advanced diagnostics and reconfigurability, which is vital for complex electronics.
  • The requirements for high-voltage junction box design for EVs are particularly stringent, demanding robust thermal management and safety mechanisms to handle immense power loads. Simultaneously, the impact of ECU consolidation on junction boxes is reshaping electrical architectures; as single controllers absorb more functions, the nature of power and data distribution shifts.
  • This trend is a precursor to a full automotive zonal architecture power distribution model, where decentralized intelligent nodes replace a central box. The ultimate goal is achieving greater functional integration in power distribution units, which consolidates control, protection, and distribution into a single, optimized module.
  • This integration offers significant operational benefits, with some analyses indicating it can reduce vehicle diagnostic and repair times by over 40% compared to traditional, distributed electrical systems, directly improving serviceability and lowering ownership costs.

What are the key market drivers leading to the rise in the adoption of Automotive Junction Box Industry?

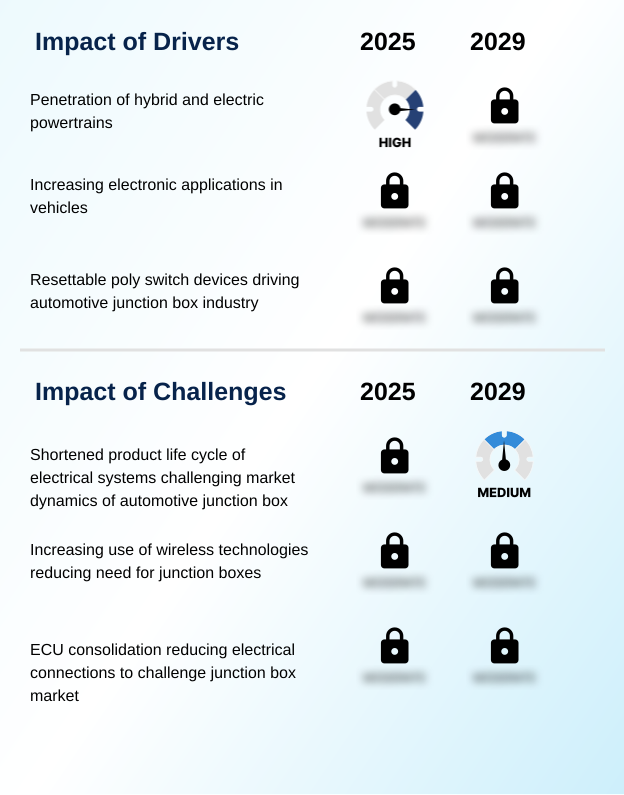
  • The increasing penetration of hybrid and electric powertrains is a key driver for the market's growth.

  • The market's primary driver is the rapid pace of vehicle electrification, which necessitates a complete reimagining of vehicle power distribution.
  • The transition to electric vehicle powertrains requires robust high-voltage junction box designs capable of high-current circuit management at levels exceeding 800 volts, a stark contrast to traditional 12-volt systems.
  • This is compounded by the proliferation of automotive electronics systems, including advanced driver-assistance systems (ADAS) and sophisticated in-vehicle infotainment (IVI), which now account for up to 40% of a new vehicle's total cost.
  • Adherence to evolving automotive safety standards is also compelling automakers to adopt more resilient and intelligent power architectures, further fueling demand for advanced power management solutions.

What are the market trends shaping the Automotive Junction Box Industry?

  • The functional integration of junction boxes is an emerging market trend. This involves consolidating features from passive units with electronic module functionalities for enhanced performance.

  • Key market trends are centered on the functional integration of the fuse and relay center into a single, intelligent solid-state smart junction box. This shift, driven by advanced microcontroller-based technology, allows for significant component miniaturization and simplifies complex automotive wiring systems. Innovations in automotive design engineering are leading to electrical component integration that reduces assembly weight by up to 15%.
  • Furthermore, the use of lightweight wiring materials and heat-resistant composites is becoming standard practice to enhance efficiency and durability. This approach not only streamlines the manufacturing process but has been shown to reduce the number of individual power-switching components by over 25% in some platforms.

What challenges does the Automotive Junction Box Industry face during its growth?

  • The shortened product life cycle of electrical systems presents a key challenge to the market dynamics of automotive junction boxes.

  • Significant challenges are reshaping the competitive landscape, primarily stemming from deep architectural changes within the vehicle. The trend of ECU consolidation, where multiple controllers are replaced by a single, powerful automotive system-on-chip (SoC), is altering the traditional vehicle network topology and reducing the need for certain interconnect systems.
  • This consolidation can eliminate up to 40% of physical ECUs, impacting the demand for associated wiring. Concurrently, the shortened automotive component lifecycle makes it difficult for suppliers to keep pace.
  • For example, the 18-to-36-month development timeline for a new power distribution module directly conflicts with vehicle platform refreshes occurring every four to six years, creating immense pressure on automotive power electronics innovation and electrical system optimization.

Exclusive Technavio Analysis on Customer Landscape

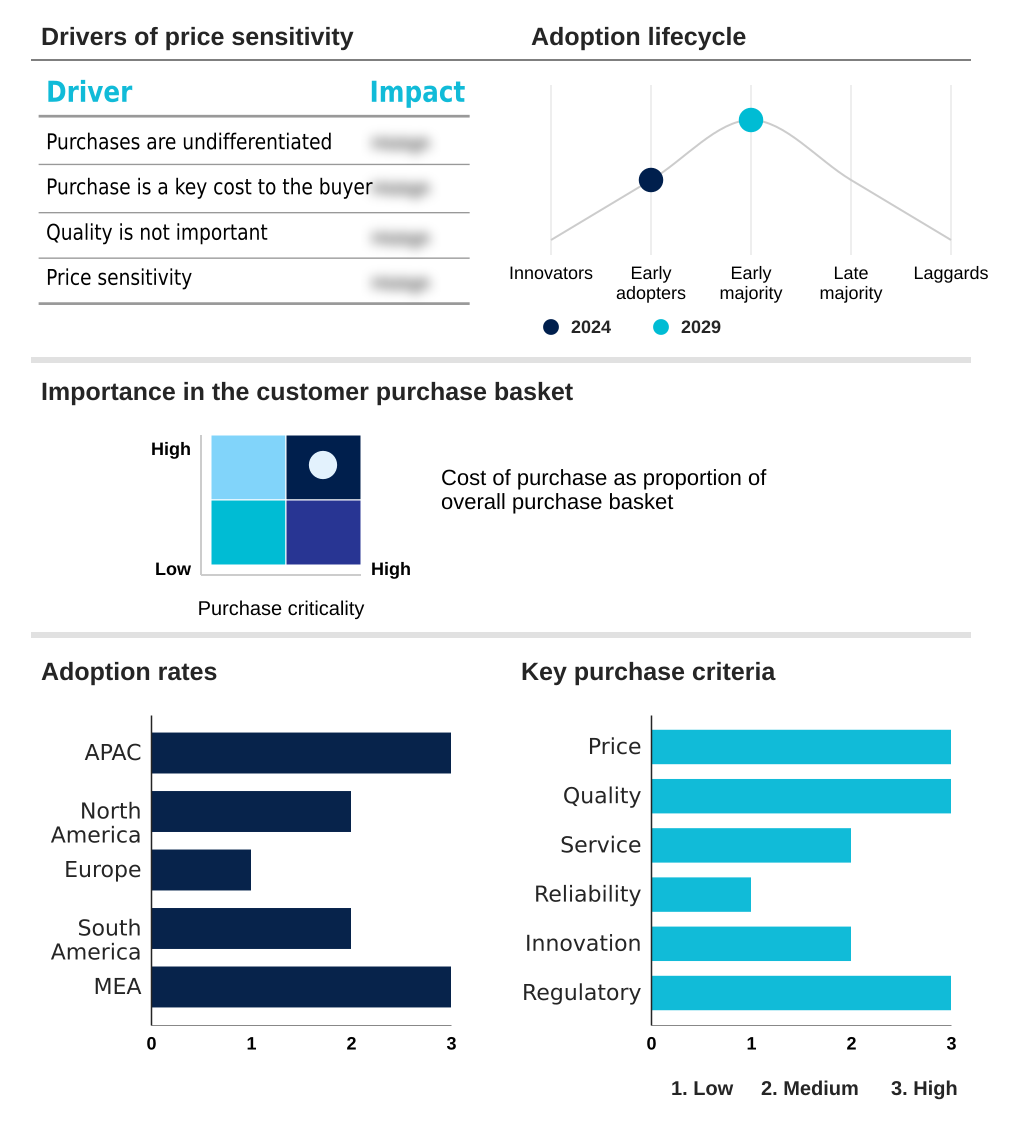
The automotive junction box market forecasting report includes the adoption lifecycle of the market, covering from the innovator’s stage to the laggard’s stage. It focuses on adoption rates in different regions based on penetration. Furthermore, the automotive junction box market report also includes key purchase criteria and drivers of price sensitivity to help companies evaluate and develop their market growth analysis strategies.

Customer Landscape of Automotive Junction Box Industry

Competitive Landscape

Companies are implementing various strategies, such as strategic alliances, automotive junction box market forecast, partnerships, mergers and acquisitions, geographical expansion, and product/service launches, to enhance their presence in the industry.

Amphenol Corp. - Key offerings center on advanced electrical distribution systems and smart junction boxes, engineered for modern vehicle electrification and complex power management requirements.

The industry research and growth report includes detailed analyses of the competitive landscape of the market and information about key companies, including:

  • Amphenol Corp.
  • Apparatebau Kirchheim-Teck GmbH
  • Aptiv Plc
  • BorgWarner Inc.
  • Continental AG
  • Dejini Systems
  • Eaton Corp. Plc
  • Fujikura Co. Ltd.
  • Jenkin Electric Co.
  • Lear Corp.
  • Leoni AG
  • M M Sankhla Electricals
  • Motherson Group
  • ON Semiconductor Corp.
  • Sumitomo Electric Industries Ltd.
  • TE Connectivity Ltd.
  • Valeo SA
  • Vitesco Technologies Group AG
  • Yazaki Corp.

Qualitative and quantitative analysis of companies has been conducted to help clients understand the wider business environment as well as the strengths and weaknesses of key industry players. Data is qualitatively analyzed to categorize companies as pure play, category-focused, industry-focused, and diversified; it is quantitatively analyzed to categorize companies as dominant, leading, strong, tentative, and weak.

Recent Development and News in Automotive junction box market

  • In May, 2025, Aptiv Plc announced a strategic partnership with a leading semiconductor firm to co-develop next-generation zonal controllers, integrating advanced processing with power distribution functionalities for software-defined vehicles.
  • In February, 2025, Continental AG launched its new modular high-voltage junction box designed for 800-volt EV architectures, featuring enhanced thermal management and a 15% reduction in weight compared to previous models.
  • In November, 2024, Lear Corp. confirmed a significant investment to expand its manufacturing facility in Mexico, aiming to increase production capacity for solid-state smart junction boxes by 40% to meet growing North American OEM demand.
  • In August, 2024, Yazaki Corp. secured a major contract to supply its integrated power distribution units for a new line of all-electric commercial trucks, supporting the industry's transition to zero-emission logistics.

Dive into Technavio’s robust research methodology, blending expert interviews, extensive data synthesis, and validated models for unparalleled Automotive Junction Box Market insights. See full methodology.

Market Scope
Page number 292
Base year 2024
Historic period 2019-2023
Forecast period 2025-2029
Growth momentum & CAGR Accelerate at a CAGR of 10.5%
Market growth 2025-2029 USD 4906.2 million
Market structure Fragmented
YoY growth 2024-2025(%) 9.0%
Key countries Japan, China, India, South Korea, Australia, Indonesia, US, Canada, Mexico, Germany, UK, France, Italy, Spain, The Netherlands, Brazil, Argentina, Colombia, UAE, Saudi Arabia, South Africa, Egypt and Nigeria
Competitive landscape Leading Companies, Market Positioning of Companies, Competitive Strategies, and Industry Risks

Request Free Sample

Research Analyst Overview

  • The automotive junction box market is undergoing a fundamental technological shift, moving beyond the traditional fuse and relay center to become a critical node in the vehicle's nervous system. Success for suppliers now hinges on mastering advanced automotive power electronics and microcontroller-based technology.
  • The modern electrical distribution system, whether a centralized power distribution unit or a decentralized power distribution module, must handle sophisticated high-current circuit management for electric propulsion and autonomous systems. Integrating a battery disconnect unit into the high-voltage junction box is now a standard safety requirement.
  • For boardroom strategy, the most pressing concern is the accelerated pace of innovation, with the average automotive component lifecycle shrinking from over eight years to just 4-6 years. This compression demands a complete overhaul of R&D cycles and supply chain agility to avoid obsolescence, compelling a strategic pivot toward modular and software-upgradable vehicle electrical architecture and automotive wiring systems.
  • Mastery of the solid-state smart junction box and its role in a zonal electrical architecture is no longer optional but essential for survival.

What are the Key Data Covered in this Automotive Junction Box Market Research and Growth Report?

  • What is the expected growth of the Automotive Junction Box Market between 2025 and 2029?

    • USD 4.91 billion, at a CAGR of 10.5%

  • What segmentation does the market report cover?

    • The report is segmented by Vehicle Type (Passenger cars, and Commercial vehicles), Technology (Smart junction box, and Passive junction box), Channel (OEMs, and Aftermarket) and Geography (APAC, North America, Europe, South America, Middle East and Africa)

  • Which regions are analyzed in the report?

    • APAC, North America, Europe, South America and Middle East and Africa

  • What are the key growth drivers and market challenges?

    • Penetration of hybrid and electric powertrains, Shortened product life cycle of electrical systems challenging market dynamics of automotive junction box

  • Who are the major players in the Automotive Junction Box Market?

    • Amphenol Corp., Apparatebau Kirchheim-Teck GmbH, Aptiv Plc, BorgWarner Inc., Continental AG, Dejini Systems, Eaton Corp. Plc, Fujikura Co. Ltd., Jenkin Electric Co., Lear Corp., Leoni AG, M M Sankhla Electricals, Motherson Group, ON Semiconductor Corp., Sumitomo Electric Industries Ltd., TE Connectivity Ltd., Valeo SA, Vitesco Technologies Group AG and Yazaki Corp.

Market Research Insights

  • Market dynamics are increasingly shaped by the push for electrical system optimization and component miniaturization. The trend of ECU consolidation, facilitated by the adoption of powerful automotive system-on-chip (SoC) technology, is fundamentally altering vehicle network topology. This shift enables automakers to streamline designs and reduce wiring complexity.
  • For instance, advanced thermal management solutions have been shown to improve the operational reliability of high-current components by over 20%, a critical factor in high-voltage applications. Concurrently, ongoing innovations in miniaturization have allowed for a 15% reduction in the physical footprint of power distribution modules, freeing up valuable space in increasingly crowded vehicle architectures.
  • These advancements directly influence OEM sourcing strategy and design engineering priorities.

We can help! Our analysts can customize this automotive junction box market research report to meet your requirements.

Get in touch

1. Executive Summary

1.1 Market overview

Executive Summary - Chart on Market Overview
Executive Summary - Data Table on Market Overview
Executive Summary - Chart on Global Market Characteristics
Executive Summary - Chart on Market by Geography
Executive Summary - Chart on Market Segmentation by Vehicle Type
Executive Summary - Chart on Market Segmentation by Technology
Executive Summary - Chart on Market Segmentation by Channel
Executive Summary - Chart on Incremental Growth
Executive Summary - Data Table on Incremental Growth
Executive Summary - Chart on Company Market Positioning

2. Technavio Analysis

2.1 Analysis of price sensitivity, lifecycle, customer purchase basket, adoption rates, and purchase criteria

2.2 Criticality of inputs and Factors of differentiation

Chart on Overview on criticality of inputs and factors of differentiation

2.3 Factors of disruption

Chart on Overview on factors of disruption

2.4 Impact of drivers and challenges

Chart on Impact of drivers and challenges in 2024 and 2029

3. Market Landscape

3.1 Market ecosystem

Chart on Parent Market
Data Table on - Parent Market

3.2 Market characteristics

Chart on Market characteristics analysis

3.3 Value chain analysis

Chart on Value chain analysis

4. Market Sizing

4.1 Market definition

Data Table on Offerings of companies included in the market definition

4.2 Market segment analysis

Market segments

4.3 Market size 2024

4.4 Market outlook: Forecast for 2024-2029

Chart on Global - Market size and forecast 2024-2029 ($ million)
Data Table on Global - Market size and forecast 2024-2029 ($ million)
Chart on Global Market: Year-over-year growth 2024-2029 (%)
Data Table on Global Market: Year-over-year growth 2024-2029 (%)

5. Historic Market Size

5.1 Global Automotive Junction Box Market 2019 - 2023

Historic Market Size - Data Table on Global Automotive Junction Box Market 2019 - 2023 ($ million)

5.2 Vehicle Type segment analysis 2019 - 2023

Historic Market Size - Vehicle Type Segment 2019 - 2023 ($ million)

5.3 Technology segment analysis 2019 - 2023

Historic Market Size - Technology Segment 2019 - 2023 ($ million)

5.4 Channel segment analysis 2019 - 2023

Historic Market Size - Channel Segment 2019 - 2023 ($ million)

5.5 Geography segment analysis 2019 - 2023

Historic Market Size - Geography Segment 2019 - 2023 ($ million)

5.6 Country segment analysis 2019 - 2023

Historic Market Size - Country Segment 2019 - 2023 ($ million)

6. Qualitative Analysis

6.1 The AI impact on Global Automotive Junction Box Market

7. Five Forces Analysis

7.1 Five forces summary

Five forces analysis - Comparison between 2024 and 2029

7.2 Bargaining power of buyers

Bargaining power of buyers - Impact of key factors 2024 and 2029

7.3 Bargaining power of suppliers

Bargaining power of suppliers - Impact of key factors in 2024 and 2029

7.4 Threat of new entrants

Threat of new entrants - Impact of key factors in 2024 and 2029

7.5 Threat of substitutes

Threat of substitutes - Impact of key factors in 2024 and 2029

7.6 Threat of rivalry

Threat of rivalry - Impact of key factors in 2024 and 2029

7.7 Market condition

Chart on Market condition - Five forces 2024 and 2029

8. Market Segmentation by Vehicle Type

8.1 Market segments

Chart on Vehicle Type - Market share 2024-2029 (%)
Data Table on Vehicle Type - Market share 2024-2029 (%)

8.2 Comparison by Vehicle Type

Chart on Comparison by Vehicle Type
Data Table on Comparison by Vehicle Type

8.3 Passenger cars - Market size and forecast 2024-2029

Chart on Passenger cars - Market size and forecast 2024-2029 ($ million)
Data Table on Passenger cars - Market size and forecast 2024-2029 ($ million)
Chart on Passenger cars - Year-over-year growth 2024-2029 (%)
Data Table on Passenger cars - Year-over-year growth 2024-2029 (%)

8.4 Commercial vehicles - Market size and forecast 2024-2029

Chart on Commercial vehicles - Market size and forecast 2024-2029 ($ million)
Data Table on Commercial vehicles - Market size and forecast 2024-2029 ($ million)
Chart on Commercial vehicles - Year-over-year growth 2024-2029 (%)
Data Table on Commercial vehicles - Year-over-year growth 2024-2029 (%)

8.5 Market opportunity by Vehicle Type

Market opportunity by Vehicle Type ($ million)
Data Table on Market opportunity by Vehicle Type ($ million)

9. Market Segmentation by Technology

9.1 Market segments

Chart on Technology - Market share 2024-2029 (%)
Data Table on Technology - Market share 2024-2029 (%)

9.2 Comparison by Technology

Chart on Comparison by Technology
Data Table on Comparison by Technology

9.3 Smart junction box - Market size and forecast 2024-2029

Chart on Smart junction box - Market size and forecast 2024-2029 ($ million)
Data Table on Smart junction box - Market size and forecast 2024-2029 ($ million)
Chart on Smart junction box - Year-over-year growth 2024-2029 (%)
Data Table on Smart junction box - Year-over-year growth 2024-2029 (%)

9.4 Passive junction box - Market size and forecast 2024-2029

Chart on Passive junction box - Market size and forecast 2024-2029 ($ million)
Data Table on Passive junction box - Market size and forecast 2024-2029 ($ million)
Chart on Passive junction box - Year-over-year growth 2024-2029 (%)
Data Table on Passive junction box - Year-over-year growth 2024-2029 (%)

9.5 Market opportunity by Technology

Market opportunity by Technology ($ million)
Data Table on Market opportunity by Technology ($ million)

10. Market Segmentation by Channel

10.1 Market segments

Chart on Channel - Market share 2024-2029 (%)
Data Table on Channel - Market share 2024-2029 (%)

10.2 Comparison by Channel

Chart on Comparison by Channel
Data Table on Comparison by Channel

10.3 OEMs - Market size and forecast 2024-2029

Chart on OEMs - Market size and forecast 2024-2029 ($ million)
Data Table on OEMs - Market size and forecast 2024-2029 ($ million)
Chart on OEMs - Year-over-year growth 2024-2029 (%)
Data Table on OEMs - Year-over-year growth 2024-2029 (%)

10.4 Aftermarket - Market size and forecast 2024-2029

Chart on Aftermarket - Market size and forecast 2024-2029 ($ million)
Data Table on Aftermarket - Market size and forecast 2024-2029 ($ million)
Chart on Aftermarket - Year-over-year growth 2024-2029 (%)
Data Table on Aftermarket - Year-over-year growth 2024-2029 (%)

10.5 Market opportunity by Channel

Market opportunity by Channel ($ million)
Data Table on Market opportunity by Channel ($ million)

11. Customer Landscape

11.1 Customer landscape overview

Analysis of price sensitivity, lifecycle, customer purchase basket, adoption rates, and purchase criteria

12. Geographic Landscape

12.1 Geographic segmentation

Chart on Market share by geography 2024-2029 (%)
Data Table on Market share by geography 2024-2029 (%)

12.2 Geographic comparison

Chart on Geographic comparison
Data Table on Geographic comparison

12.3 APAC - Market size and forecast 2024-2029

Chart on APAC - Market size and forecast 2024-2029 ($ million)
Data Table on APAC - Market size and forecast 2024-2029 ($ million)
Chart on APAC - Year-over-year growth 2024-2029 (%)
Data Table on APAC - Year-over-year growth 2024-2029 (%)
Chart on Regional Comparison - APAC
Data Table on Regional Comparison - APAC

12.3.1 Japan - Market size and forecast 2024-2029

Chart on Japan - Market size and forecast 2024-2029 ($ million)
Data Table on Japan - Market size and forecast 2024-2029 ($ million)
Chart on Japan - Year-over-year growth 2024-2029 (%)
Data Table on Japan - Year-over-year growth 2024-2029 (%)

12.3.2 China - Market size and forecast 2024-2029

Chart on China - Market size and forecast 2024-2029 ($ million)
Data Table on China - Market size and forecast 2024-2029 ($ million)
Chart on China - Year-over-year growth 2024-2029 (%)
Data Table on China - Year-over-year growth 2024-2029 (%)

12.3.3 India - Market size and forecast 2024-2029

Chart on India - Market size and forecast 2024-2029 ($ million)
Data Table on India - Market size and forecast 2024-2029 ($ million)
Chart on India - Year-over-year growth 2024-2029 (%)
Data Table on India - Year-over-year growth 2024-2029 (%)

12.3.4 South Korea - Market size and forecast 2024-2029

Chart on South Korea - Market size and forecast 2024-2029 ($ million)
Data Table on South Korea - Market size and forecast 2024-2029 ($ million)
Chart on South Korea - Year-over-year growth 2024-2029 (%)
Data Table on South Korea - Year-over-year growth 2024-2029 (%)

12.3.5 Australia - Market size and forecast 2024-2029

Chart on Australia - Market size and forecast 2024-2029 ($ million)
Data Table on Australia - Market size and forecast 2024-2029 ($ million)
Chart on Australia - Year-over-year growth 2024-2029 (%)
Data Table on Australia - Year-over-year growth 2024-2029 (%)

12.3.6 Indonesia - Market size and forecast 2024-2029

Chart on Indonesia - Market size and forecast 2024-2029 ($ million)
Data Table on Indonesia - Market size and forecast 2024-2029 ($ million)
Chart on Indonesia - Year-over-year growth 2024-2029 (%)
Data Table on Indonesia - Year-over-year growth 2024-2029 (%)

12.4 North America - Market size and forecast 2024-2029

Chart on North America - Market size and forecast 2024-2029 ($ million)
Data Table on North America - Market size and forecast 2024-2029 ($ million)
Chart on North America - Year-over-year growth 2024-2029 (%)
Data Table on North America - Year-over-year growth 2024-2029 (%)
Chart on Regional Comparison - North America
Data Table on Regional Comparison - North America

12.4.1 US - Market size and forecast 2024-2029

Chart on US - Market size and forecast 2024-2029 ($ million)
Data Table on US - Market size and forecast 2024-2029 ($ million)
Chart on US - Year-over-year growth 2024-2029 (%)
Data Table on US - Year-over-year growth 2024-2029 (%)

12.4.2 Canada - Market size and forecast 2024-2029

Chart on Canada - Market size and forecast 2024-2029 ($ million)
Data Table on Canada - Market size and forecast 2024-2029 ($ million)
Chart on Canada - Year-over-year growth 2024-2029 (%)
Data Table on Canada - Year-over-year growth 2024-2029 (%)

12.4.3 Mexico - Market size and forecast 2024-2029

Chart on Mexico - Market size and forecast 2024-2029 ($ million)
Data Table on Mexico - Market size and forecast 2024-2029 ($ million)
Chart on Mexico - Year-over-year growth 2024-2029 (%)
Data Table on Mexico - Year-over-year growth 2024-2029 (%)

12.5 Europe - Market size and forecast 2024-2029

Chart on Europe - Market size and forecast 2024-2029 ($ million)
Data Table on Europe - Market size and forecast 2024-2029 ($ million)
Chart on Europe - Year-over-year growth 2024-2029 (%)
Data Table on Europe - Year-over-year growth 2024-2029 (%)
Chart on Regional Comparison - Europe
Data Table on Regional Comparison - Europe

12.5.1 Germany - Market size and forecast 2024-2029

Chart on Germany - Market size and forecast 2024-2029 ($ million)
Data Table on Germany - Market size and forecast 2024-2029 ($ million)
Chart on Germany - Year-over-year growth 2024-2029 (%)
Data Table on Germany - Year-over-year growth 2024-2029 (%)

12.5.2 UK - Market size and forecast 2024-2029

Chart on UK - Market size and forecast 2024-2029 ($ million)
Data Table on UK - Market size and forecast 2024-2029 ($ million)
Chart on UK - Year-over-year growth 2024-2029 (%)
Data Table on UK - Year-over-year growth 2024-2029 (%)

12.5.3 France - Market size and forecast 2024-2029

Chart on France - Market size and forecast 2024-2029 ($ million)
Data Table on France - Market size and forecast 2024-2029 ($ million)
Chart on France - Year-over-year growth 2024-2029 (%)
Data Table on France - Year-over-year growth 2024-2029 (%)

12.5.4 Italy - Market size and forecast 2024-2029

Chart on Italy - Market size and forecast 2024-2029 ($ million)
Data Table on Italy - Market size and forecast 2024-2029 ($ million)
Chart on Italy - Year-over-year growth 2024-2029 (%)
Data Table on Italy - Year-over-year growth 2024-2029 (%)

12.5.5 Spain - Market size and forecast 2024-2029

Chart on Spain - Market size and forecast 2024-2029 ($ million)
Data Table on Spain - Market size and forecast 2024-2029 ($ million)
Chart on Spain - Year-over-year growth 2024-2029 (%)
Data Table on Spain - Year-over-year growth 2024-2029 (%)

12.5.6 The Netherlands - Market size and forecast 2024-2029

Chart on The Netherlands - Market size and forecast 2024-2029 ($ million)
Data Table on The Netherlands - Market size and forecast 2024-2029 ($ million)
Chart on The Netherlands - Year-over-year growth 2024-2029 (%)
Data Table on The Netherlands - Year-over-year growth 2024-2029 (%)

12.6 South America - Market size and forecast 2024-2029

Chart on South America - Market size and forecast 2024-2029 ($ million)
Data Table on South America - Market size and forecast 2024-2029 ($ million)
Chart on South America - Year-over-year growth 2024-2029 (%)
Data Table on South America - Year-over-year growth 2024-2029 (%)
Chart on Regional Comparison - South America
Data Table on Regional Comparison - South America

12.6.1 Brazil - Market size and forecast 2024-2029

Chart on Brazil - Market size and forecast 2024-2029 ($ million)
Data Table on Brazil - Market size and forecast 2024-2029 ($ million)
Chart on Brazil - Year-over-year growth 2024-2029 (%)
Data Table on Brazil - Year-over-year growth 2024-2029 (%)

12.6.2 Argentina - Market size and forecast 2024-2029

Chart on Argentina - Market size and forecast 2024-2029 ($ million)
Data Table on Argentina - Market size and forecast 2024-2029 ($ million)
Chart on Argentina - Year-over-year growth 2024-2029 (%)
Data Table on Argentina - Year-over-year growth 2024-2029 (%)

12.6.3 Colombia - Market size and forecast 2024-2029

Chart on Colombia - Market size and forecast 2024-2029 ($ million)
Data Table on Colombia - Market size and forecast 2024-2029 ($ million)
Chart on Colombia - Year-over-year growth 2024-2029 (%)
Data Table on Colombia - Year-over-year growth 2024-2029 (%)

12.7 Middle East and Africa - Market size and forecast 2024-2029

Chart on Middle East and Africa - Market size and forecast 2024-2029 ($ million)
Data Table on Middle East and Africa - Market size and forecast 2024-2029 ($ million)
Chart on Middle East and Africa - Year-over-year growth 2024-2029 (%)
Data Table on Middle East and Africa - Year-over-year growth 2024-2029 (%)
Chart on Regional Comparison - Middle East and Africa
Data Table on Regional Comparison - Middle East and Africa

12.7.1 UAE - Market size and forecast 2024-2029

Chart on UAE - Market size and forecast 2024-2029 ($ million)
Data Table on UAE - Market size and forecast 2024-2029 ($ million)
Chart on UAE - Year-over-year growth 2024-2029 (%)
Data Table on UAE - Year-over-year growth 2024-2029 (%)

12.7.2 Saudi Arabia - Market size and forecast 2024-2029

Chart on Saudi Arabia - Market size and forecast 2024-2029 ($ million)
Data Table on Saudi Arabia - Market size and forecast 2024-2029 ($ million)
Chart on Saudi Arabia - Year-over-year growth 2024-2029 (%)
Data Table on Saudi Arabia - Year-over-year growth 2024-2029 (%)

12.7.3 South Africa - Market size and forecast 2024-2029

Chart on South Africa - Market size and forecast 2024-2029 ($ million)
Data Table on South Africa - Market size and forecast 2024-2029 ($ million)
Chart on South Africa - Year-over-year growth 2024-2029 (%)
Data Table on South Africa - Year-over-year growth 2024-2029 (%)

12.7.4 Egypt - Market size and forecast 2024-2029

Chart on Egypt - Market size and forecast 2024-2029 ($ million)
Data Table on Egypt - Market size and forecast 2024-2029 ($ million)
Chart on Egypt - Year-over-year growth 2024-2029 (%)
Data Table on Egypt - Year-over-year growth 2024-2029 (%)

12.7.5 Nigeria - Market size and forecast 2024-2029

Chart on Nigeria - Market size and forecast 2024-2029 ($ million)
Data Table on Nigeria - Market size and forecast 2024-2029 ($ million)
Chart on Nigeria - Year-over-year growth 2024-2029 (%)
Data Table on Nigeria - Year-over-year growth 2024-2029 (%)

12.8 Market opportunity by geography

Market opportunity by geography ($ million)
Data Tables on Market opportunity by geography ($ million)

13. Drivers, Challenges, and Opportunity

13.1 Market drivers

Penetration of hybrid and electric powertrains
Increasing electronic applications in vehicles
Resettable poly switch devices driving automotive junction box industry

13.2 Market challenges

Shortened product life cycle of electrical systems challenging market dynamics of automotive junction box
Increasing use of wireless technologies reducing need for junction boxes
ECU consolidation reducing electrical connections to challenge junction box market

13.3 Impact of drivers and challenges

Impact of drivers and challenges in 2024 and 2029

13.4 Market opportunities

Functional integration of junction box
Lightweight and heat-resistant composites for electrical components benefitting automotive junction box industry
Increasing popularity of autonomous vehicles

14. Competitive Landscape

14.1 Overview

14.2

Overview on criticality of inputs and factors of differentiation

14.3 Landscape disruption

Overview on factors of disruption

14.4 Industry risks

Impact of key risks on business

15. Competitive Analysis

15.1 Companies profiled

Companies covered

15.2 Company ranking index

15.3 Market positioning of companies

Matrix on companies position and classification

15.4 Amphenol Corp.

Amphenol Corp. - Overview
Amphenol Corp. - Business segments
Amphenol Corp. - Key news
Amphenol Corp. - Key offerings
Amphenol Corp. - Segment focus
SWOT

15.5 Aptiv Plc

Aptiv Plc - Overview
Aptiv Plc - Business segments
Aptiv Plc - Key news
Aptiv Plc - Key offerings
Aptiv Plc - Segment focus
SWOT

15.6 BorgWarner Inc.

BorgWarner Inc. - Overview
BorgWarner Inc. - Business segments
BorgWarner Inc. - Key news
BorgWarner Inc. - Key offerings
BorgWarner Inc. - Segment focus
SWOT

15.7 Continental AG

Continental AG - Overview
Continental AG - Business segments
Continental AG - Key news
Continental AG - Key offerings
Continental AG - Segment focus
SWOT

15.8 Eaton Corp. Plc

Eaton Corp. Plc - Overview
Eaton Corp. Plc - Business segments
Eaton Corp. Plc - Key news
Eaton Corp. Plc - Key offerings
Eaton Corp. Plc - Segment focus
SWOT

15.9 Fujikura Co. Ltd.

Fujikura Co. Ltd. - Overview
Fujikura Co. Ltd. - Business segments
Fujikura Co. Ltd. - Key news
Fujikura Co. Ltd. - Key offerings
Fujikura Co. Ltd. - Segment focus
SWOT

15.10 Lear Corp.

Lear Corp. - Overview
Lear Corp. - Business segments
Lear Corp. - Key offerings
Lear Corp. - Segment focus
SWOT

15.11 Leoni AG

Leoni AG - Overview
Leoni AG - Product / Service
Leoni AG - Key offerings
SWOT

15.12 Motherson Group

Motherson Group - Overview
Motherson Group - Business segments
Motherson Group - Key offerings
Motherson Group - Segment focus
SWOT

15.13 ON Semiconductor Corp.

ON Semiconductor Corp. - Overview
ON Semiconductor Corp. - Business segments
ON Semiconductor Corp. - Key news
ON Semiconductor Corp. - Key offerings
ON Semiconductor Corp. - Segment focus
SWOT

15.14 Sumitomo Electric Industries Ltd.

Sumitomo Electric Industries Ltd. - Overview
Sumitomo Electric Industries Ltd. - Business segments
Sumitomo Electric Industries Ltd. - Key news
Sumitomo Electric Industries Ltd. - Key offerings
Sumitomo Electric Industries Ltd. - Segment focus
SWOT

15.15 TE Connectivity Ltd.

TE Connectivity Ltd. - Overview
TE Connectivity Ltd. - Business segments
TE Connectivity Ltd. - Key news
TE Connectivity Ltd. - Key offerings
TE Connectivity Ltd. - Segment focus
SWOT

15.16 Valeo SA

Valeo SA - Overview
Valeo SA - Business segments
Valeo SA - Key news
Valeo SA - Key offerings
Valeo SA - Segment focus
SWOT

15.17 Vitesco Technologies Group AG

Vitesco Technologies Group AG - Overview
Vitesco Technologies Group AG - Product / Service
Vitesco Technologies Group AG - Key offerings
SWOT

15.18 Yazaki Corp.

Yazaki Corp. - Overview
Yazaki Corp. - Product / Service
Yazaki Corp. - Key offerings
SWOT

16. Appendix

16.1 Scope of the report

Market definition
Objectives
Notes and caveats

16.2 Inclusions and exclusions checklist

Inclusions checklist
Exclusions checklist

16.3 Currency conversion rates for US$

16.4 Research methodology

16.5 Data procurement

Information sources

16.6 Data validation

16.7 Validation techniques employed for market sizing

16.8 Data synthesis

16.9 360 degree market analysis

16.10 List of abbreviations

Research Methodology

Technavio presents a detailed picture of the market by way of study, synthesis, and summation of data from multiple sources. The analysts have presented the various facets of the market with a particular focus on identifying the key industry influencers. The data thus presented is comprehensive, reliable, and the result of extensive research, both primary and secondary.

INFORMATION SOURCES

Primary sources

  • Manufacturers and suppliers
  • Channel partners
  • Industry experts
  • Strategic decision makers

Secondary sources

  • Industry journals and periodicals
  • Government data
  • Financial reports of key industry players
  • Historical data
  • Press releases

DATA ANALYSIS

Data Synthesis

  • Collation of data
  • Estimation of key figures
  • Analysis of derived insights

Data Validation

  • Triangulation with data models
  • Reference against proprietary databases
  • Corroboration with industry experts

REPORT WRITING

Qualitative

  • Market drivers
  • Market challenges
  • Market trends
  • Five forces analysis

Quantitative

  • Market size and forecast
  • Market segmentation
  • Geographical insights
  • Competitive landscape

Interested in this report?

Get your sample now to see our research methodology and insights!

Download Now

Frequently Asked Questions

Automotive Junction Box market growth will increase by USD 4906.2 million during 2025-2029.

The Automotive Junction Box market is expected to grow at a CAGR of 10.5% during 2025-2029.

Automotive Junction Box market is segmented by Vehicle type (Passenger cars, Commercial vehicles) Technology (Smart junction box, Passive junction box) Channel (OEMs, Aftermarket)

Amphenol Corp., Apparatebau Kirchheim-Teck GmbH, Aptiv Plc, BorgWarner Inc., Continental AG, Dejini Systems, Eaton Corp. Plc, Fujikura Co. Ltd., Jenkin Electric Co., Lear Corp., Leoni AG, M M Sankhla Electricals, Motherson Group, ON Semiconductor Corp., Sumitomo Electric Industries Ltd., TE Connectivity Ltd., Valeo SA, Vitesco Technologies Group AG, Yazaki Corp. are a few of the key vendors in the Automotive Junction Box market.

APAC will register the highest growth rate of 56.5% among the other regions. Therefore, the Automotive Junction Box market in APAC is expected to garner significant business opportunities for the vendors during the forecast period.

Japan, China, India, South Korea, Australia, Indonesia, US, Canada, Mexico, Germany, UK, France, Italy, Spain, The Netherlands, Brazil, Argentina, Colombia, UAE, Saudi Arabia, South Africa, Egypt, Nigeria

  • Penetration of hybrid and electric powertrains is the driving factor this market.

The Automotive Junction Box market vendors should focus on grabbing business opportunities from the Vehicle type segment as it accounted for the largest market share in the base year.