North America Automotive On-board Diagnostics (OBD) Market Size 2025-2029
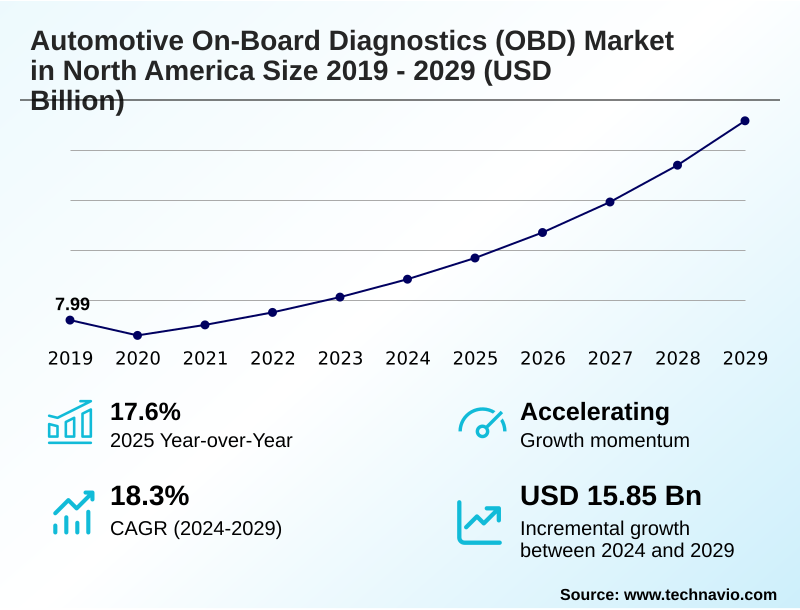
The north america automotive on-board diagnostics (obd) market size is valued to increase by USD 15.85 billion, at a CAGR of 18.3% from 2024 to 2029. Stringent regulatory mandates and right to repair movement will drive the north america automotive on-board diagnostics (obd) market.
Major Market Trends & Insights
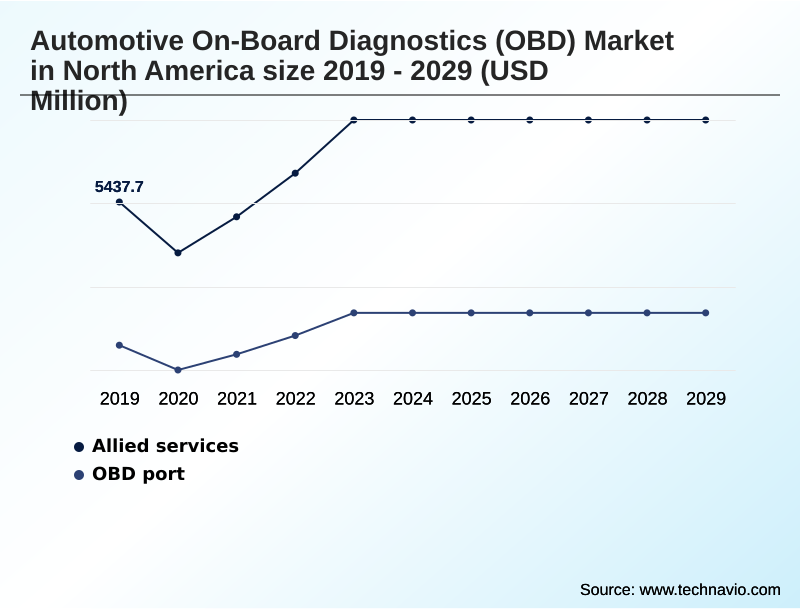
- By Product - Allied services segment was valued at USD 7.09 billion in 2023
- By Vehicle Type - IC engine segment accounted for the largest market revenue share in 2023
Market Size & Forecast
- Market Opportunities: USD 19.93 billion
- Market Future Opportunities: USD 15.85 billion
- CAGR from 2024 to 2029 : 18.3%
Market Summary
- The automotive on-board diagnostics (OBD) market in North America is undergoing a significant technological evolution, moving beyond its original mandate for emissions compliance. The integration of advanced technologies is reshaping the industry, driven by the increasing complexity of vehicle electronics and the expanding connected car ecosystem.
- Key drivers include the push for data monetization through services like usage-based insurance (UBI) and the growing demand for predictive maintenance alerts to minimize vehicle downtime. Trends are centered on the shift toward cloud-based diagnostics and remote troubleshooting, enabling real-time vehicle data analysis.
- For instance, a commercial fleet operator can leverage telematics data from the controller area network (CAN) bus to optimize routes and monitor driver behavior, leading to enhanced operational efficiency. However, the market faces challenges such as cybersecurity vulnerabilities associated with wireless OBD dongles and the lack of standardized diagnostic protocols for electric vehicles.
- The ongoing debate over data access rights and the implementation of secure vehicle gateways by OEMs further complicates the landscape for the independent aftermarket, which relies on tools that support multi-brand diagnostics and ECU reprogramming to remain competitive. This dynamic environment fosters innovation in specialized areas like ADAS calibration and battery management system (BMS) analysis.
What will be the Size of the North America Automotive On-board Diagnostics (OBD) Market during the forecast period?
Get Key Insights on Market Forecast (PDF) Get Free Sample
How is the North America Automotive On-board Diagnostics (OBD) Market Segmented?
The north america automotive on-board diagnostics (obd) industry research report provides comprehensive data (region-wise segment analysis), with forecasts and estimates in "USD million" for the period 2025-2029, as well as historical data from 2019-2023 for the following segments.
- Product
- Allied services
- OBD port
- Vehicle type
- IC engine
- Electric vehicle
- Connectivity
- Wireless
- Wired
- Geography
- North America
- US
- Mexico
- Canada
- North America
By Product Insights
The allied services segment is estimated to witness significant growth during the forecast period.
The allied services segment is driven by the transformation of the OBD port from a simple hardware interface to a strategic data source.
Services built on this data are central to commercial operations, where leveraging the J1962 connector as a telematics data gateway is standard practice. These solutions facilitate vehicle health monitoring and deliver predictive maintenance alerts, significantly improving fleet uptime.
The growth of usage-based insurance (UBI) models also relies on this continuous data stream. These services interpret diagnostic trouble codes (DTCs) from various electronic control units (ECUs) to create value.
The push for data access rights, influenced by right to repair legislation, supports this trend.
The connected car ecosystem thrives on this data for vehicle data monetization, with some platforms achieving a 20% improvement in diagnostic accuracy for emissions control compliance amid evolving powertrain electrification trends.
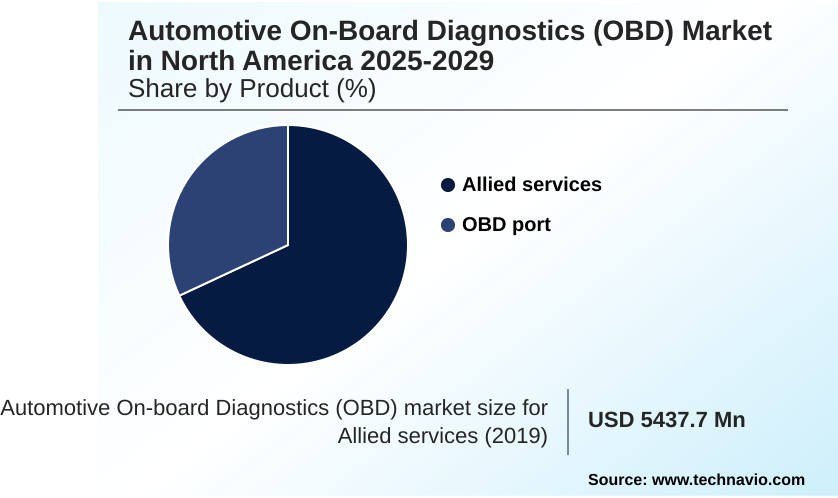
The Allied services segment was valued at USD 7.09 billion in 2023 and showed a gradual increase during the forecast period.
Market Dynamics
Our researchers analyzed the data with 2024 as the base year, along with the key drivers, trends, and challenges. A holistic analysis of drivers will help companies refine their marketing strategies to gain a competitive advantage.
- The evolution of the automotive on-board diagnostics (OBD) market in North America is creating distinct operational imperatives for service providers. Effective OBD diagnostics for electric vehicle battery health are no longer optional but a core competency, requiring advanced diagnostics for ADAS calibration to be integrated into standard service offerings.
- The rise of remote fleet management via OBD telematics has introduced both opportunities and cybersecurity risks of wireless OBD dongles, making security a primary concern. The legislative push for open access to wireless telematic data is reshaping the competitive landscape, compelling the industry to develop standardized diagnostics for zero-emission vehicles. This directly challenges the model of proprietary OEM diagnostic protocols.
- Consequently, there is a heightened demand for aftermarket tools for secure gateway access. This shift supports the expansion of telematics integration for usage-based insurance, which relies on predictive maintenance using OBD data analytics. Servicing complex ECU networks now requires cloud-based platforms for remote vehicle monitoring.
- Diagnostic tool requirements for EV powertrains are becoming highly specialized, underscoring the impact of right to repair on the OBD market. The ability to perform J2534 programming for aftermarket repairs using real-time fault code analysis software is critical, enabling functions like driver behavior monitoring for fuel efficiency.
- Technicians must also be proficient in high-voltage system diagnostics and safety and CAN bus data logging and analysis. Fleets adopting these integrated diagnostic approaches have seen a nearly twofold increase in predictive accuracy compared to those using older, disconnected systems.
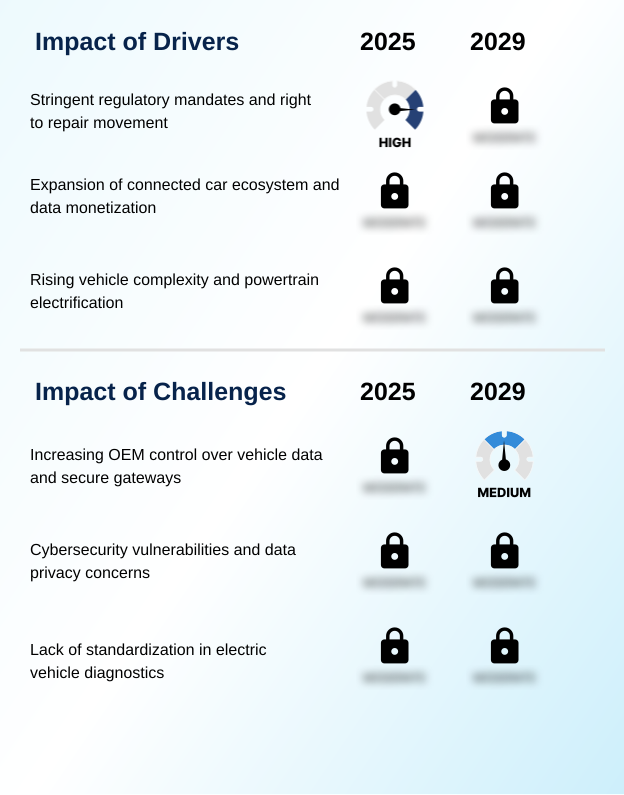
What are the key market drivers leading to the rise in the adoption of North America Automotive On-board Diagnostics (OBD) Industry?
- The market is primarily driven by a robust framework of stringent regulatory mandates, including emissions control, amplified by the growing right-to-repair movement advocating for open data access.
- The escalating complexity of modern vehicles, featuring advanced driver assistance systems (ADAS) and intricate battery management system (BMS) technologies, is a major driver. This complexity necessitates advanced solutions for ECU reprogramming and comprehensive engine health diagnostics.
- In the commercial sector, fleet management telematics relies on this data for driver behavior monitoring, with some fleets achieving a 15% reduction in fuel costs. The implementation of a secure vehicle gateway by OEMs creates demand for authorized tools.
- This is driving innovation in specialized diagnostic equipment for functions like high-voltage system topology mapping.
- Service providers are focusing on component failure prediction and more accurate driver risk profiling, requiring specialized tools and sensor recalibration services to avoid issues like cybersecurity vulnerabilities.
What are the market trends shaping the North America Automotive On-board Diagnostics (OBD) Industry?
- A definitive shift from traditional, reactive diagnostics to proactive, remote, and cloud-based solutions is reshaping the market. This leverages connectivity for continuous real-time vehicle health monitoring.
- A dominant trend is the shift toward proactive, cloud-based solutions utilizing a wireless OBD dongle to stream real-time vehicle data from the controller area network (CAN) bus. This facilitates remote diagnostics and enables predictive analytics platforms, with some users reporting a 25% reduction in diagnostic time. This model supports condition-based maintenance, moving away from fixed schedules.
- The growth of software as a service (SaaS) and other software subscription models is creating integrated ecosystems where insights are delivered directly to technicians. This trend opens opportunities for independent aftermarket (IAM) solutions within open diagnostic ecosystems, which rely on real-time data streaming.
- Furthermore, advanced platforms perform detailed state of charge analysis for EVs and assist with complex ADAS calibration, enhancing service capabilities.
What challenges does the North America Automotive On-board Diagnostics (OBD) Industry face during its growth?
- A significant challenge is the increasing control by original equipment manufacturers (OEMs) over vehicle data through the implementation of secure gateways, which restricts aftermarket access.
- The rise of proprietary OEM protocols and the lack of standardized diagnostic protocols for zero-emission vehicle diagnostics pose significant challenges. This fragmentation creates aftermarket tool limitations, forcing reliance on reverse-engineered solutions which may not support advanced bidirectional controls or pass-thru programming. This complexity within the vehicle network architecture requires sophisticated diagnostic scan tools and modular diagnostic systems.
- The integration of high-voltage measurement tools and advanced calibration tools becomes critical, especially with video telematics integration becoming more common. Addressing these issues is vital for ensuring vehicle data privacy. For instance, fleets using non-standardized tools have reported a 10% higher rate of incorrect diagnoses, highlighting the need for industry-wide standards.
Exclusive Technavio Analysis on Customer Landscape
The north america automotive on-board diagnostics (obd) market forecasting report includes the adoption lifecycle of the market, covering from the innovator’s stage to the laggard’s stage. It focuses on adoption rates in different regions based on penetration. Furthermore, the north america automotive on-board diagnostics (obd) market report also includes key purchase criteria and drivers of price sensitivity to help companies evaluate and develop their market growth analysis strategies.
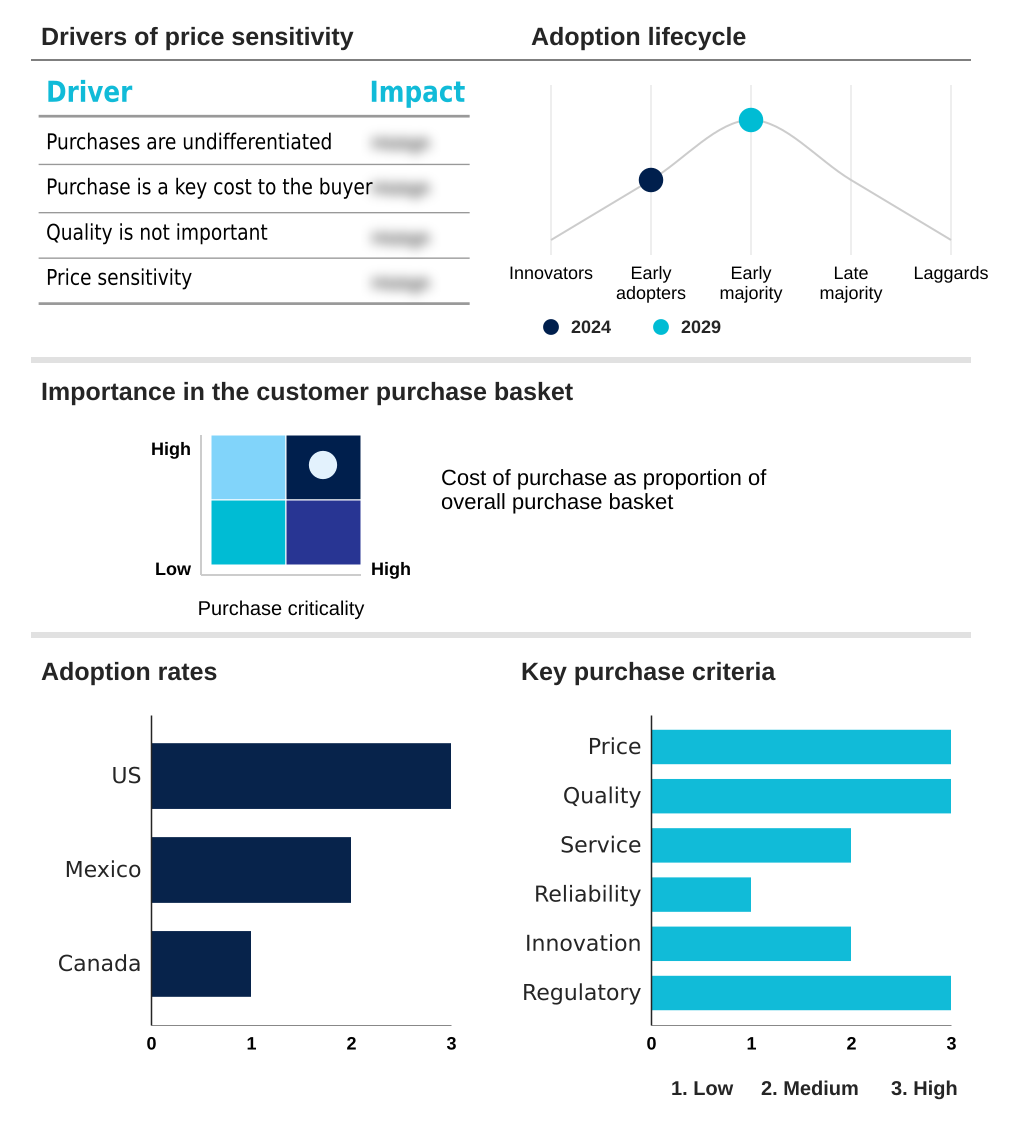
Customer Landscape of North America Automotive On-board Diagnostics (OBD) Industry
Competitive Landscape
Companies are implementing various strategies, such as strategic alliances, north america automotive on-board diagnostics (obd) market forecast, partnerships, mergers and acquisitions, geographical expansion, and product/service launches, to enhance their presence in the industry.
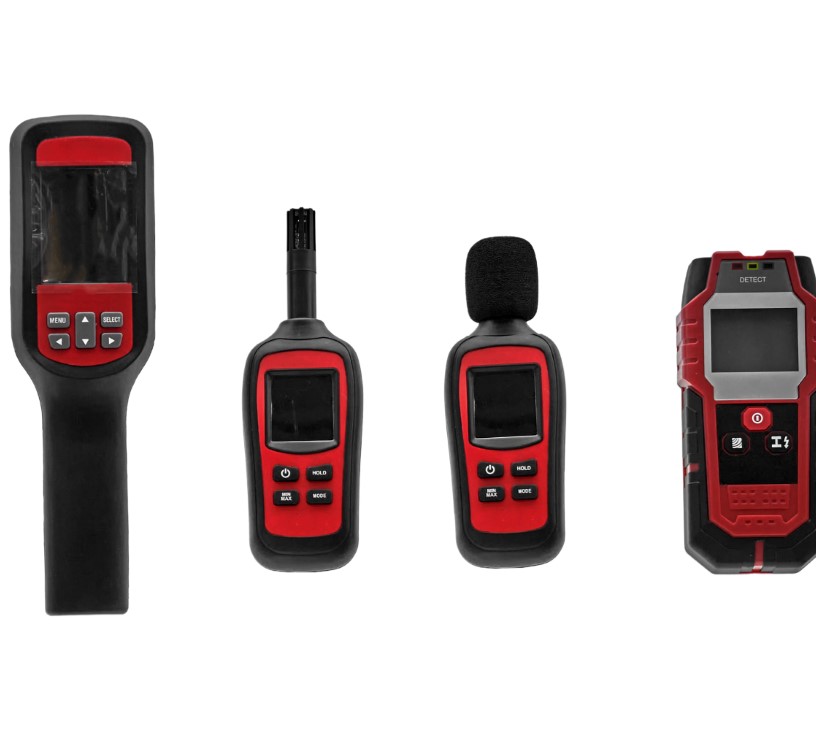
Autel Intelligent Technology Corp. Ltd. - Offers advanced automotive on-board diagnostics including comprehensive diagnostic scan tools, OBD scanners, and specialized solutions for tire pressure monitoring systems and ADAS calibration.
The industry research and growth report includes detailed analyses of the competitive landscape of the market and information about key companies, including:
- Autel Intelligent Technology Corp. Ltd.
- AVL DiTEST GmbH
- Bridgestone Corp.
- Continental AG
- Dashboard Labs Corps.
- DENSO Corp.
- General Motors Co.
- Hearst Communications Inc.
- HELLA GmbH and Co. KGaA
- Innova Electronics Corp.
- iWave Systems Technologies Pvt. Ltd.
- Marelli Holdings Co. Ltd.
- Mercedes Benz Group AG
- Moj.io Inc.
- OBD Solutions LLC
- Opus IVS
- Snap On Inc.
- Vector Informatik GmbH
- Verizon Communications Inc.
Qualitative and quantitative analysis of companies has been conducted to help clients understand the wider business environment as well as the strengths and weaknesses of key industry players. Data is qualitatively analyzed to categorize companies as pure play, category-focused, industry-focused, and diversified; it is quantitatively analyzed to categorize companies as dominant, leading, strong, tentative, and weak.
Recent Development and News in North america automotive on-board diagnostics (obd) market
- In September 2024, Verizon Connect announced the integration of advanced artificial intelligence into its platform, leveraging OBD-derived data for more sophisticated analysis of driver safety and vehicle performance.
- In October 2024, Autel Intelligent Technology Co. launched the MaxiSYS MS909EV 2.0 diagnostic tablet, a product specifically designed to provide comprehensive diagnostic coverage for electric vehicles, including detailed battery pack analysis.
- In November 2024, Verizon Connect enhanced its platform with new AI-powered features that analyze video telematics and OBD data in concert, providing fleets deeper insights into driver safety and generating more context-aware predictive maintenance alerts.
- In February 2025, a United States federal court ruling largely upheld a Massachusetts ballot initiative compelling automakers to provide open access to wireless telematic data through a standardized platform, strengthening the right-to-repair movement.
Dive into Technavio’s robust research methodology, blending expert interviews, extensive data synthesis, and validated models for unparalleled North America Automotive On-board Diagnostics (OBD) Market insights. See full methodology.
| Market Scope | |
|---|---|
| Page number | 191 |
| Base year | 2024 |
| Historic period | 2019-2023 |
| Forecast period | 2025-2029 |
| Growth momentum & CAGR | Accelerate at a CAGR of 18.3% |
| Market growth 2025-2029 | USD 15846.3 million |
| Market structure | Fragmented |
| YoY growth 2024-2025(%) | 17.6% |
| Key countries | US, Mexico and Canada |
| Competitive landscape | Leading Companies, Market Positioning of Companies, Competitive Strategies, and Industry Risks |
Research Analyst Overview
- The automotive on-board diagnostics (OBD) market in North America is driven by the increasing complexity of vehicle network architecture and the shift toward data-centric services. The ecosystem relies on advanced diagnostic scan tools and modular diagnostic systems to interface with electronic control units (ECUs) and the controller area network (CAN) bus.
- Boardroom decisions are now influenced by the need to support a vast array of technologies, from battery management system (BMS) analysis to ADAS calibration. The expansion of fleet management telematics and usage-based insurance (UBI) is creating new revenue streams built on vehicle health monitoring and engine health diagnostics. This requires robust platforms for pass-thru programming, bidirectional controls, and ECU reprogramming.
- The market's evolution necessitates specialized equipment like high-voltage measurement tools and advanced diagnostic system testers. A key strategic consideration is navigating access through a secure vehicle gateway, which often requires OE diagnostic tools or J2534 pass-thru devices.
- The integration of software as a service (SaaS) models for cloud-based diagnostics and video telematics integration is becoming standard, delivering predictive maintenance alerts that have proven to reduce unexpected vehicle downtime by over 25%.
- This technological pivot demands investment in tools that support multi-brand diagnostics, powertrain control systems, and both wireless OBD dongles and remote diagnostics for high-voltage powertrains, ensuring real-time vehicle data can be leveraged for state of charge analysis and driver behavior monitoring.
What are the Key Data Covered in this North America Automotive On-board Diagnostics (OBD) Market Research and Growth Report?
-
What is the expected growth of the North America Automotive On-board Diagnostics (OBD) Market between 2025 and 2029?
-
USD 15.85 billion, at a CAGR of 18.3%
-
-
What segmentation does the market report cover?
-
The report is segmented by Product (Allied services, OBD port), Vehicle Type (IC engine, Electric vehicle), Connectivity (Wireless, Wired) and Geography (North America)
-
-
Which regions are analyzed in the report?
-
North America
-
-
What are the key growth drivers and market challenges?
-
Stringent regulatory mandates and right to repair movement, Increasing OEM control over vehicle data and secure gateways
-
-
Who are the major players in the North America Automotive On-board Diagnostics (OBD) Market?
-
Autel Intelligent Technology Corp. Ltd., AVL DiTEST GmbH, Bridgestone Corp., Continental AG, Dashboard Labs Corps., DENSO Corp., General Motors Co., Hearst Communications Inc., HELLA GmbH and Co. KGaA, Innova Electronics Corp., iWave Systems Technologies Pvt. Ltd., Marelli Holdings Co. Ltd., Mercedes Benz Group AG, Moj.io Inc., OBD Solutions LLC, Opus IVS, Snap On Inc., Vector Informatik GmbH and Verizon Communications Inc.
-
Market Research Insights
- The market's dynamism is fueled by the expansion of the connected car ecosystem and an increasing focus on vehicle data monetization, where platforms have demonstrated an ability to improve diagnostic accuracy by up to 20%. The convergence of powertrain electrification trends and stringent data access rights legislation is creating new opportunities for independent aftermarket (IAM) solutions.
- Predictive analytics platforms are enabling a transition to condition-based maintenance, with some users reporting a 15% reduction in unscheduled downtime. This evolution is supported by software subscription models that provide continuous updates for real-time data streaming and analysis. The need for open diagnostic ecosystems is paramount as vehicle complexity increases, pushing demand for more sophisticated and interoperable systems.
We can help! Our analysts can customize this north america automotive on-board diagnostics (obd) market research report to meet your requirements.
 RIA -
RIA - 
