Automotive Retreaded Tires Market Analysis, Size, and Forecast 2026-2030: North America (US, Canada, and Mexico), APAC (China, Japan, and India), Europe (Germany, UK, and France), South America (Brazil and Argentina), Middle East and Africa (Saudi Arabia, UAE, and South Africa), and Rest of World (ROW)

Automotive Retreaded Tires Market Analysis, Size, and Forecast 2026-2030:
North America (US, Canada, and Mexico), APAC (China, Japan, and India), Europe (Germany, UK, and France), South America (Brazil and Argentina), Middle East and Africa (Saudi Arabia, UAE, and South Africa), and Rest of World (ROW)

Published: Apr 2026 291 Pages SKU: IRTNTR73241

Market Overview at a Glance

$5.80 B
Market Opportunity
7.8%
CAGR 2025 - 2030
40.9%
North America Growth
$8.95 B
Precure segment 2024

Automotive Retreaded Tires Market Size 2026-2030

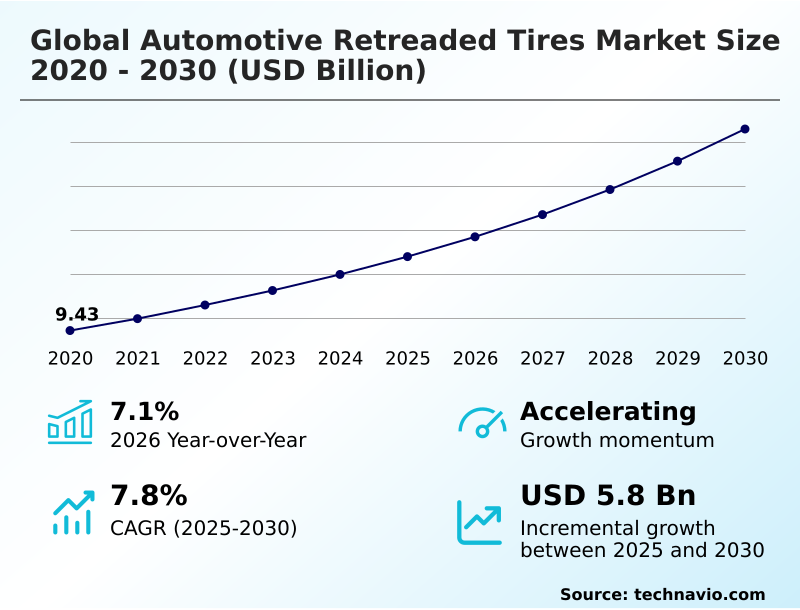
The automotive retreaded tires market size is valued to increase by USD 5.80 billion, at a CAGR of 7.8% from 2025 to 2030. Expansion of global commercial vehicle fleet and rising freight activity will drive the automotive retreaded tires market.

Major Market Trends & Insights

  • North America dominated the market and accounted for a 40.9% growth during the forecast period.
  • By Product - Precure segment was valued at USD 8.95 billion in 2024
  • By Vehicle Type - Commercial vehicle segment accounted for the largest market revenue share in 2024

Market Size & Forecast

  • Market Opportunities: USD 9.16 billion
  • Market Future Opportunities: USD 5.80 billion
  • CAGR from 2025 to 2030 : 7.8%

Market Summary

  • The automotive retreaded tires market is fundamentally shaped by economic and environmental imperatives, offering a compelling value proposition through a lower total cost of ownership metric and alignment with a circular economy in transportation. This sector is defined by sophisticated industrial processes like precure retreading process and mold cure vulcanization, which restore used tire casings to operational service.
  • A primary driver is the continuous growth of commercial logistics, which increases demand for cost-effective solutions like long-haul fleet solutions. As a key business scenario, a large logistics firm integrates comprehensive tire lifecycle management solutions, using predictive tire maintenance based on real-time tire pressure monitoring data to schedule servicing.
  • This practice not only reduces the cost per mile but also enhances safety and ensures a steady supply of high-quality casings for future retreading. However, the industry contends with challenges, including intense price competition from budget new tires and the logistical complexities of casing collection and sorting, which can impact the availability of suitable casings for retreading.

What will be the Size of the Automotive Retreaded Tires Market during the forecast period?

Get Key Insights on Market Forecast (PDF) Request Free Sample

How is the Automotive Retreaded Tires Market Segmented?

The automotive retreaded tires industry research report provides comprehensive data (region-wise segment analysis), with forecasts and estimates in "USD million" for the period 2026-2030, as well as historical data from 2020-2024 for the following segments.
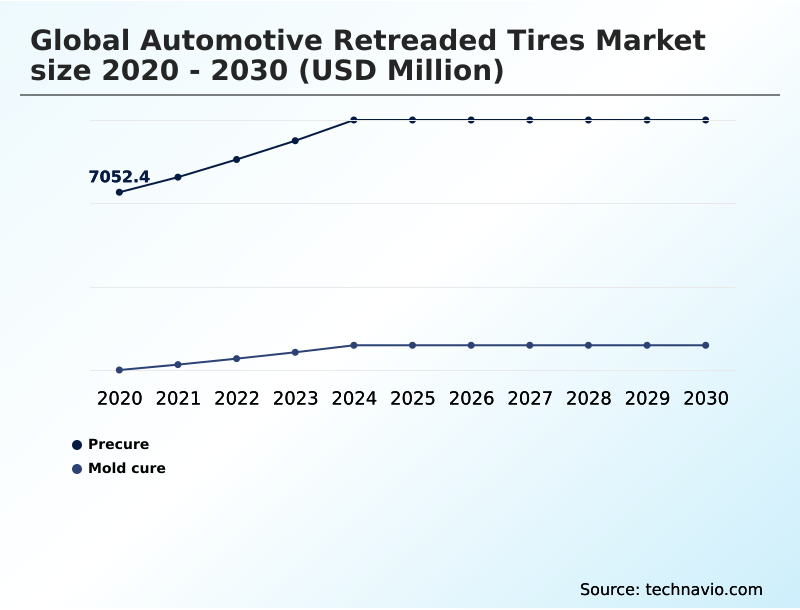
  • Product
    • Precure
    • Mold cure
  • Vehicle type
    • Commercial vehicle
    • Passenger vehicle
  • End-user
    • Aftermarket
    • OEM
  • Geography
    • North America
      • US
      • Canada
      • Mexico
    • APAC
      • China
      • Japan
      • India
    • Europe
      • Germany
      • UK
      • France
    • South America
      • Brazil
      • Argentina
    • Middle East and Africa
      • Saudi Arabia
      • UAE
      • South Africa
    • Rest of World (ROW)

By Product Insights

The precure segment is estimated to witness significant growth during the forecast period.

The precure segment leads the market, defined by its efficient cold cure bonding process. This method involves the application of a pre-molded tread strip onto a casing prepared by computerized tire buffing, using cushion gum adhesion for a secure bond.

The lower temperature requirements of the precure retreading process enhance retread reliability metrics by preserving casing strength. This approach allows for the use of advanced tread compounds and low rolling resistance compounds, optimized for applications like regional haul tire treads.

Superior retread manufacturing technology and vulcanization process control contribute to high retread performance validation.

As a result, this method improves retread plant operational efficiency and is key to maximizing tire asset value for commercial fleets, achieving retread success rates over 98% for premium casings.

Request Free Sample

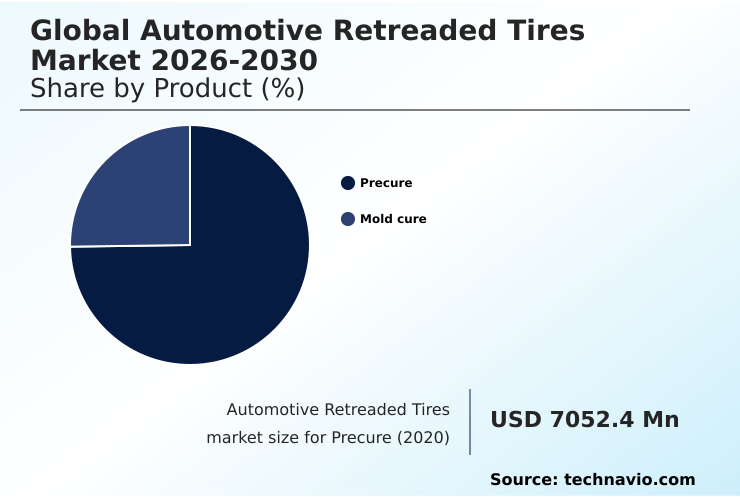
The Precure segment was valued at USD 8.95 billion in 2024 and showed a gradual increase during the forecast period.

Request Free Sample

Regional Analysis

North America is estimated to contribute 40.9% to the growth of the global market during the forecast period.Technavio’s analysts have elaborately explained the regional trends and drivers that shape the market during the forecast period.

See How Automotive Retreaded Tires Market Demand is Rising in North America Request Free Sample

The market's geographic landscape is diverse, with North America representing a mature region where large fleets prioritize lifecycle cost management.

In contrast, the European market is heavily influenced by a regulatory push for sustainability, while APAC is characterized by rapid growth and high fragmentation.

Technological adoption varies, with leading regions widely employing shearography casing inspection and ultrasonic non-destructive testing for thorough tire casing integrity assessment. These advanced methods are crucial for ensuring retread process quality assurance and managing retread warranty and liability.

Applications such as OTR tire retreading and solutions for construction vehicle retreads are prominent in resource-driven economies. In North America, fleets using advanced tire performance analytics have cut tire-related downtime by over 30%, showcasing the efficiency gains possible.

The development of specialized tread rubber compound formulation remains a key competitive factor across all regions.

Market Dynamics

Our researchers analyzed the data with 2025 as the base year, along with the key drivers, trends, and challenges. A holistic analysis of drivers will help companies refine their marketing strategies to gain a competitive advantage.

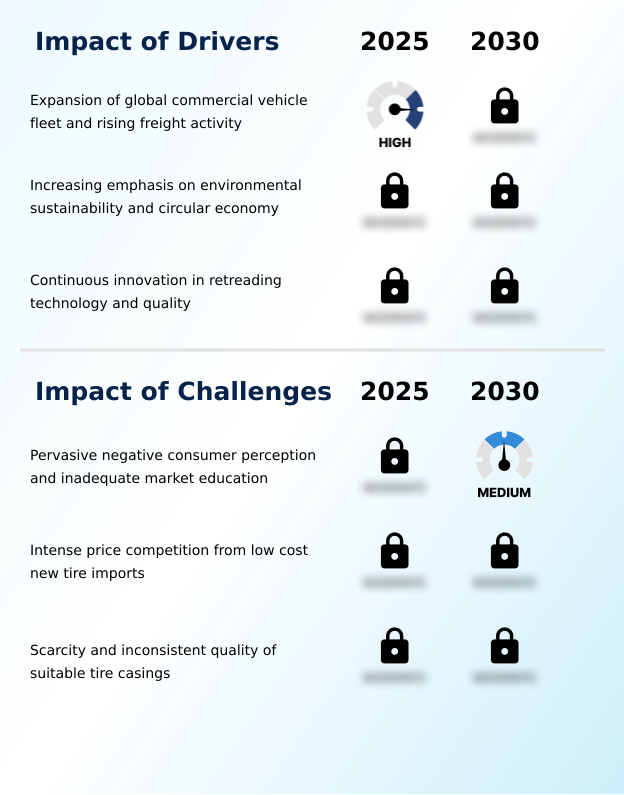
  • The global automotive retreaded tires market is navigating a complex environment defined by the persistent impact of low-cost new tires on retreading, which challenges the industry's traditional cost advantages. In response, the sector is leveraging technological advancements in tire casing inspection to enhance product quality and safety.
  • This focus is critical for improving retreaded tire performance and safety and is a core part of overcoming negative perceptions of retreaded tires. A significant growth avenue lies in developing retreaded tire solutions for electric commercial vehicles, which require unique performance characteristics.
  • This aligns with the broader role of retreading in circular economy for transport, emphasizing the sustainability benefits of automotive tire retreading. Key to this is the market expansion for light commercial vehicle retreads, driven by the e-commerce boom. The industry also focuses on application-specific retreads for waste management fleets and other severe-use segments.
  • However, significant challenges in sourcing high-quality tire casings persist, complicating the supply chain for automotive retreaded tires. The industry is also addressing challenges for retreaded tires in passenger vehicles, although this segment remains small. Comparing precure and mold cure retreading methods continues to be a key technical discussion.
  • Moreover, the integration of digital fleet management for tire retreading helps in optimizing total cost of ownership with retreads, as fleets that track tire assets see a 10-15% improvement in utilization over those that do not.
  • Adherence to retreaded tire standards and certifications remains a powerful driver for retreaded tires in logistics, especially for automotive retreaded tires for heavy-duty trucks and bus fleets, which also look to improve their retreaded tire impact on fuel efficiency.

What are the key market drivers leading to the rise in the adoption of Automotive Retreaded Tires Industry?

  • The key market driver is the expansion of the global commercial vehicle fleet, fueled by rising freight and logistics activity worldwide.

  • Market growth is strongly driven by economic and environmental factors, with the focus on a lower total cost of ownership metric being paramount for commercial vehicle retreading.
  • The economic benefits of tire retreading are substantial, with fleets saving up to 50% compared to purchasing new premium tires.
  • Simultaneously, the industry's role in promoting a circular economy in transportation is a powerful catalyst, as the environmental impact of retreading is significantly lower.
  • This process supports end-of-life tire management, reduces waste, and conserves resources, aligning with green logistics strategies and sustainable transport initiatives.
  • Adherence to retread quality certification ECE 109 and other retreaded tire safety standards builds confidence, reinforcing the value proposition for long-haul fleet solutions and supporting broader retread industry regulations.

What are the market trends shaping the Automotive Retreaded Tires Industry?

  • The integration of digitalization and advanced fleet management solutions represents a significant upcoming trend. This is reshaping tire lifecycle management through data-driven, predictive maintenance and service-oriented models.

  • A significant trend is the deep integration of digital technologies, with advanced tire lifecycle management solutions transforming fleet operations. The use of tire pressure monitoring data enables predictive tire maintenance, with early adopters reporting a 30% reduction in tire-related roadside breakdowns.
  • This digital shift, part of broader smart tire retreading concepts, includes fleet management software integration and tire asset tracking with RFID for superior asset control. The market is also expanding into new segments with specialized electric vehicle tire retreads and light commercial vehicle retreads, addressing the needs of last-mile delivery fleet tires.
  • These commercial fleet tire programs and enhanced retread service provider networks focus on reducing fleet operational costs and improving tire retreadability scoring for better lifecycle value.

What challenges does the Automotive Retreaded Tires Industry face during its growth?

  • A key challenge affecting industry growth is the pervasive negative consumer perception, compounded by inadequate market education on the safety and reliability of modern retreaded tires.

  • A primary market challenge is the intense price pressure from low-cost imports, making the decision between retreading versus budget new tires increasingly difficult for operators. This is compounded by casing supply chain logistics, where the impact of road infrastructure and poor maintenance practices create a scarcity of high-quality casings.
  • A detailed casing suitability evaluation using advanced casing analysis tools reveals that up to 40% of collected casings may be rejected. The industry employs sophisticated methods like the hot cure retreading method and advanced sidewall repair techniques, but the inconsistent quality of available casings remains a hurdle.
  • This issue is particularly acute in the passenger vehicle retread market, where casing quality is highly variable and consumer trust is low, hindering market penetration.

Exclusive Technavio Analysis on Customer Landscape

The automotive retreaded tires market forecasting report includes the adoption lifecycle of the market, covering from the innovator’s stage to the laggard’s stage. It focuses on adoption rates in different regions based on penetration. Furthermore, the automotive retreaded tires market report also includes key purchase criteria and drivers of price sensitivity to help companies evaluate and develop their market growth analysis strategies.

Customer Landscape of Automotive Retreaded Tires Industry

Competitive Landscape

Companies are implementing various strategies, such as strategic alliances, automotive retreaded tires market forecast, partnerships, mergers and acquisitions, geographical expansion, and product/service launches, to enhance their presence in the industry.

Bridgestone Corp. - Offers specialized automotive retreaded tires and radial retreads for commercial truck and bus applications, designed to optimize fleet performance and asset value.

The industry research and growth report includes detailed analyses of the competitive landscape of the market and information about key companies, including:

  • Bridgestone Corp.
  • CIO Tyres Pvt. Ltd
  • Continental AG
  • Eastern Treads Ltd.
  • Goodyear Tire and Rubber Co.
  • JK Tyre and Industries Ltd.
  • Kal Tire
  • KRAIBURG AUSTRIA GmbH
  • MARANGONI Group.
  • Michelin
  • MRF Ltd.
  • Nokian Tyres Plc
  • Oliver Rubber Co.
  • Parrish Tire Co.
  • RDH Tire and Retread Co.
  • REIFEN HINGHAUS GmbH
  • ROSLER TYRE INNOVATORS
  • Tyresoles
  • West End Tire
  • Yokohama Rubber Co. Ltd.

Qualitative and quantitative analysis of companies has been conducted to help clients understand the wider business environment as well as the strengths and weaknesses of key industry players. Data is qualitatively analyzed to categorize companies as pure play, category-focused, industry-focused, and diversified; it is quantitatively analyzed to categorize companies as dominant, leading, strong, tentative, and weak.

Recent Development and News in Automotive retreaded tires market

  • In February, 2025, Bridgestone Americas completed its USD 60 million investment to expand its Bandag retread tire manufacturing plant in Abilene, Texas, to meet surging demand from commercial fleets.
  • In April, 2025, Goodyear launched Fleet Central, an interactive digital portal providing fleet managers with comprehensive oversight of their tire programs, including monitoring of retread and casing performance.
  • In April, 2025, Marangoni S.p.A. and CEAT Limited announced a strategic partnership to improve the quality and availability of premium truck and bus retreads across India using Marangoni's advanced systems.
  • In February, 2025, Michelin expanded its REMIX 2 range by adding a second premium hot retread option for its X MULTI line, reinforcing the value of extending casing life.

Dive into Technavio’s robust research methodology, blending expert interviews, extensive data synthesis, and validated models for unparalleled Automotive Retreaded Tires Market insights. See full methodology.

Market Scope
Page number 291
Base year 2025
Historic period 2020-2024
Forecast period 2026-2030
Growth momentum & CAGR Accelerate at a CAGR of 7.8%
Market growth 2026-2030 USD 5802.4 million
Market structure Fragmented
YoY growth 2025-2026(%) 7.1%
Key countries US, Canada, Mexico, China, Japan, India, South Korea, Australia, Indonesia, Germany, UK, France, Italy, Spain, The Netherlands, Brazil, Argentina, Chile, Saudi Arabia, UAE, South Africa, Israel and Turkey
Competitive landscape Leading Companies, Market Positioning of Companies, Competitive Strategies, and Industry Risks

Request Free Sample

Research Analyst Overview

  • The automotive retreaded tires market is an ecosystem of advanced industrial processes, including the precure retreading process and mold cure vulcanization, designed to maximize asset life and promote a circular economy in transportation. The industry's credibility hinges on sophisticated quality control measures, from initial shearography casing inspection and ultrasonic non-destructive testing to final retread bond strength testing.
  • Continuous innovation in advanced tread compounds and low rolling resistance compounds is enabling the development of application-specific tread design for diverse uses, including OTR tire retreading, light commercial vehicle retreads, and specialized waste haul vehicle tires. In a critical boardroom-level context, the adoption of tire lifecycle management solutions is now a key component of corporate ESG strategy.
  • This is driven by the fact that advanced tire failure analysis methods have linked poor casing quality to 80% of premature retread failures, reinforcing the strategic importance of robust casing collection and sorting programs.
  • For fleets, the focus remains on the total cost of ownership metric, achieved through predictive tire maintenance and the use of technologies like tire asset tracking with RFID, which are vital for long-haul fleet solutions and ensuring retread quality certification ECE 109.

What are the Key Data Covered in this Automotive Retreaded Tires Market Research and Growth Report?

  • What is the expected growth of the Automotive Retreaded Tires Market between 2026 and 2030?

    • USD 5.80 billion, at a CAGR of 7.8%

  • What segmentation does the market report cover?

    • The report is segmented by Product (Precure, and Mold cure), Vehicle Type (Commercial vehicle, and Passenger vehicle), End-user (Aftermarket, and OEM) and Geography (North America, APAC, Europe, South America, Middle East and Africa)

  • Which regions are analyzed in the report?

    • North America, APAC, Europe, South America and Middle East and Africa

  • What are the key growth drivers and market challenges?

    • Expansion of global commercial vehicle fleet and rising freight activity, Pervasive negative consumer perception and inadequate market education

  • Who are the major players in the Automotive Retreaded Tires Market?

    • Bridgestone Corp., CIO Tyres Pvt. Ltd, Continental AG, Eastern Treads Ltd., Goodyear Tire and Rubber Co., JK Tyre and Industries Ltd., Kal Tire, KRAIBURG AUSTRIA GmbH, MARANGONI Group., Michelin, MRF Ltd., Nokian Tyres Plc, Oliver Rubber Co., Parrish Tire Co., RDH Tire and Retread Co., REIFEN HINGHAUS GmbH, ROSLER TYRE INNOVATORS, Tyresoles, West End Tire and Yokohama Rubber Co. Ltd.

Market Research Insights

  • Market dynamics are shaped by the significant economic benefits of tire retreading, with professional commercial fleet tire programs demonstrating a potential 25% reduction in tire-related operational costs. As fleets seek to maximize tire asset value, the focus sharpens on retread reliability metrics and adherence to stringent retreaded tire safety standards.
  • This push for quality and performance helps counter retread market challenges, such as the influx of budget new tires. The industry is further defined by a drive toward sustainability, leveraging green logistics strategies and sustainable transport initiatives.
  • Integrating advanced technologies like RFID tire tracking systems can improve casing suitability evaluation, increasing retreading acceptance rates by over 15% and directly supporting efforts in reducing fleet operational costs.

We can help! Our analysts can customize this automotive retreaded tires market research report to meet your requirements.

Get in touch

1. Executive Summary

1.1 Market overview

Executive Summary - Chart on Market Overview
Executive Summary - Data Table on Market Overview
Executive Summary - Chart on Global Market Characteristics
Executive Summary - Chart on Market by Geography
Executive Summary - Chart on Market Segmentation by Product
Executive Summary - Chart on Market Segmentation by Vehicle Type
Executive Summary - Chart on Market Segmentation by End-user
Executive Summary - Chart on Incremental Growth
Executive Summary - Data Table on Incremental Growth
Executive Summary - Chart on Company Market Positioning

2. Technavio Analysis

2.1 Analysis of price sensitivity, lifecycle, customer purchase basket, adoption rates, and purchase criteria

2.2 Criticality of inputs and Factors of differentiation

Chart on Overview on criticality of inputs and factors of differentiation

2.3 Factors of disruption

Chart on Overview on factors of disruption

2.4 Impact of drivers and challenges

Chart on Impact of drivers and challenges in 2025 and 2030

3. Market Landscape

3.1 Market ecosystem

Chart on Parent Market
Data Table on - Parent Market

3.2 Market characteristics

Chart on Market characteristics analysis

3.3 Value chain analysis

Chart on Value chain analysis

4. Market Sizing

4.1 Market definition

Data Table on Offerings of companies included in the market definition

4.2 Market segment analysis

Market segments

4.3 Market size 2025

4.4 Market outlook: Forecast for 2025-2030

Chart on Global - Market size and forecast 2025-2030 ($ million)
Data Table on Global - Market size and forecast 2025-2030 ($ million)
Chart on Global Market: Year-over-year growth 2025-2030 (%)
Data Table on Global Market: Year-over-year growth 2025-2030 (%)

5. Historic Market Size

5.1 Global Automotive Retreaded Tires Market 2020 - 2024

Historic Market Size - Data Table on Global Automotive Retreaded Tires Market 2020 - 2024 ($ million)

5.2 Product segment analysis 2020 - 2024

Historic Market Size - Product Segment 2020 - 2024 ($ million)

5.3 Vehicle Type segment analysis 2020 - 2024

Historic Market Size - Vehicle Type Segment 2020 - 2024 ($ million)

5.4 End-user segment analysis 2020 - 2024

Historic Market Size - End-user Segment 2020 - 2024 ($ million)

5.5 Geography segment analysis 2020 - 2024

Historic Market Size - Geography Segment 2020 - 2024 ($ million)

5.6 Country segment analysis 2020 - 2024

Historic Market Size - Country Segment 2020 - 2024 ($ million)

6. Qualitative Analysis

6.1 Impact of AI on global automotive retreaded tires market

6.2 Impact of geopolitical conflicts on global automotive retreaded tires market

7. Five Forces Analysis

7.1 Five forces summary

Five forces analysis - Comparison between 2025 and 2030

7.2 Bargaining power of buyers

Bargaining power of buyers - Impact of key factors 2025 and 2030

7.3 Bargaining power of suppliers

Bargaining power of suppliers - Impact of key factors in 2025 and 2030

7.4 Threat of new entrants

Threat of new entrants - Impact of key factors in 2025 and 2030

7.5 Threat of substitutes

Threat of substitutes - Impact of key factors in 2025 and 2030

7.6 Threat of rivalry

Threat of rivalry - Impact of key factors in 2025 and 2030

7.7 Market condition

Chart on Market condition - Five forces 2025 and 2030

8. Market Segmentation by Product

8.1 Market segments

Chart on Product - Market share 2025-2030 (%)
Data Table on Product - Market share 2025-2030 (%)

8.2 Comparison by Product

Chart on Comparison by Product
Data Table on Comparison by Product

8.3 Precure - Market size and forecast 2025-2030

Chart on Precure - Market size and forecast 2025-2030 ($ million)
Data Table on Precure - Market size and forecast 2025-2030 ($ million)
Chart on Precure - Year-over-year growth 2025-2030 (%)
Data Table on Precure - Year-over-year growth 2025-2030 (%)

8.4 Mold cure - Market size and forecast 2025-2030

Chart on Mold cure - Market size and forecast 2025-2030 ($ million)
Data Table on Mold cure - Market size and forecast 2025-2030 ($ million)
Chart on Mold cure - Year-over-year growth 2025-2030 (%)
Data Table on Mold cure - Year-over-year growth 2025-2030 (%)

8.5 Market opportunity by Product

Market opportunity by Product ($ million)
Data Table on Market opportunity by Product ($ million)

9. Market Segmentation by Vehicle Type

9.1 Market segments

Chart on Vehicle Type - Market share 2025-2030 (%)
Data Table on Vehicle Type - Market share 2025-2030 (%)

9.2 Comparison by Vehicle Type

Chart on Comparison by Vehicle Type
Data Table on Comparison by Vehicle Type

9.3 Commercial vehicle - Market size and forecast 2025-2030

Chart on Commercial vehicle - Market size and forecast 2025-2030 ($ million)
Data Table on Commercial vehicle - Market size and forecast 2025-2030 ($ million)
Chart on Commercial vehicle - Year-over-year growth 2025-2030 (%)
Data Table on Commercial vehicle - Year-over-year growth 2025-2030 (%)

9.4 Passenger vehicle - Market size and forecast 2025-2030

Chart on Passenger vehicle - Market size and forecast 2025-2030 ($ million)
Data Table on Passenger vehicle - Market size and forecast 2025-2030 ($ million)
Chart on Passenger vehicle - Year-over-year growth 2025-2030 (%)
Data Table on Passenger vehicle - Year-over-year growth 2025-2030 (%)

9.5 Market opportunity by Vehicle Type

Market opportunity by Vehicle Type ($ million)
Data Table on Market opportunity by Vehicle Type ($ million)

10. Market Segmentation by End-user

10.1 Market segments

Chart on End-user - Market share 2025-2030 (%)
Data Table on End-user - Market share 2025-2030 (%)

10.2 Comparison by End-user

Chart on Comparison by End-user
Data Table on Comparison by End-user

10.3 Aftermarket - Market size and forecast 2025-2030

Chart on Aftermarket - Market size and forecast 2025-2030 ($ million)
Data Table on Aftermarket - Market size and forecast 2025-2030 ($ million)
Chart on Aftermarket - Year-over-year growth 2025-2030 (%)
Data Table on Aftermarket - Year-over-year growth 2025-2030 (%)

10.4 OEM - Market size and forecast 2025-2030

Chart on OEM - Market size and forecast 2025-2030 ($ million)
Data Table on OEM - Market size and forecast 2025-2030 ($ million)
Chart on OEM - Year-over-year growth 2025-2030 (%)
Data Table on OEM - Year-over-year growth 2025-2030 (%)

10.5 Market opportunity by End-user

Market opportunity by End-user ($ million)
Data Table on Market opportunity by End-user ($ million)

11. Customer Landscape

11.1 Customer landscape overview

Analysis of price sensitivity, lifecycle, customer purchase basket, adoption rates, and purchase criteria

12. Geographic Landscape

12.1 Geographic segmentation

Chart on Market share by geography 2025-2030 (%)
Data Table on Market share by geography 2025-2030 (%)

12.2 Geographic comparison

Chart on Geographic comparison
Data Table on Geographic comparison

12.3 North America - Market size and forecast 2025-2030

Chart on North America - Market size and forecast 2025-2030 ($ million)
Data Table on North America - Market size and forecast 2025-2030 ($ million)
Chart on North America - Year-over-year growth 2025-2030 (%)
Data Table on North America - Year-over-year growth 2025-2030 (%)
Chart on Regional Comparison - North America
Data Table on Regional Comparison - North America

12.3.1 US - Market size and forecast 2025-2030

Chart on US - Market size and forecast 2025-2030 ($ million)
Data Table on US - Market size and forecast 2025-2030 ($ million)
Chart on US - Year-over-year growth 2025-2030 (%)
Data Table on US - Year-over-year growth 2025-2030 (%)

12.3.2 Canada - Market size and forecast 2025-2030

Chart on Canada - Market size and forecast 2025-2030 ($ million)
Data Table on Canada - Market size and forecast 2025-2030 ($ million)
Chart on Canada - Year-over-year growth 2025-2030 (%)
Data Table on Canada - Year-over-year growth 2025-2030 (%)

12.3.3 Mexico - Market size and forecast 2025-2030

Chart on Mexico - Market size and forecast 2025-2030 ($ million)
Data Table on Mexico - Market size and forecast 2025-2030 ($ million)
Chart on Mexico - Year-over-year growth 2025-2030 (%)
Data Table on Mexico - Year-over-year growth 2025-2030 (%)

12.4 APAC - Market size and forecast 2025-2030

Chart on APAC - Market size and forecast 2025-2030 ($ million)
Data Table on APAC - Market size and forecast 2025-2030 ($ million)
Chart on APAC - Year-over-year growth 2025-2030 (%)
Data Table on APAC - Year-over-year growth 2025-2030 (%)
Chart on Regional Comparison - APAC
Data Table on Regional Comparison - APAC

12.4.1 China - Market size and forecast 2025-2030

Chart on China - Market size and forecast 2025-2030 ($ million)
Data Table on China - Market size and forecast 2025-2030 ($ million)
Chart on China - Year-over-year growth 2025-2030 (%)
Data Table on China - Year-over-year growth 2025-2030 (%)

12.4.2 Japan - Market size and forecast 2025-2030

Chart on Japan - Market size and forecast 2025-2030 ($ million)
Data Table on Japan - Market size and forecast 2025-2030 ($ million)
Chart on Japan - Year-over-year growth 2025-2030 (%)
Data Table on Japan - Year-over-year growth 2025-2030 (%)

12.4.3 India - Market size and forecast 2025-2030

Chart on India - Market size and forecast 2025-2030 ($ million)
Data Table on India - Market size and forecast 2025-2030 ($ million)
Chart on India - Year-over-year growth 2025-2030 (%)
Data Table on India - Year-over-year growth 2025-2030 (%)

12.4.4 South Korea - Market size and forecast 2025-2030

Chart on South Korea - Market size and forecast 2025-2030 ($ million)
Data Table on South Korea - Market size and forecast 2025-2030 ($ million)
Chart on South Korea - Year-over-year growth 2025-2030 (%)
Data Table on South Korea - Year-over-year growth 2025-2030 (%)

12.4.5 Australia - Market size and forecast 2025-2030

Chart on Australia - Market size and forecast 2025-2030 ($ million)
Data Table on Australia - Market size and forecast 2025-2030 ($ million)
Chart on Australia - Year-over-year growth 2025-2030 (%)
Data Table on Australia - Year-over-year growth 2025-2030 (%)

12.4.6 Indonesia - Market size and forecast 2025-2030

Chart on Indonesia - Market size and forecast 2025-2030 ($ million)
Data Table on Indonesia - Market size and forecast 2025-2030 ($ million)
Chart on Indonesia - Year-over-year growth 2025-2030 (%)
Data Table on Indonesia - Year-over-year growth 2025-2030 (%)

12.5 Europe - Market size and forecast 2025-2030

Chart on Europe - Market size and forecast 2025-2030 ($ million)
Data Table on Europe - Market size and forecast 2025-2030 ($ million)
Chart on Europe - Year-over-year growth 2025-2030 (%)
Data Table on Europe - Year-over-year growth 2025-2030 (%)
Chart on Regional Comparison - Europe
Data Table on Regional Comparison - Europe

12.5.1 Germany - Market size and forecast 2025-2030

Chart on Germany - Market size and forecast 2025-2030 ($ million)
Data Table on Germany - Market size and forecast 2025-2030 ($ million)
Chart on Germany - Year-over-year growth 2025-2030 (%)
Data Table on Germany - Year-over-year growth 2025-2030 (%)

12.5.2 UK - Market size and forecast 2025-2030

Chart on UK - Market size and forecast 2025-2030 ($ million)
Data Table on UK - Market size and forecast 2025-2030 ($ million)
Chart on UK - Year-over-year growth 2025-2030 (%)
Data Table on UK - Year-over-year growth 2025-2030 (%)

12.5.3 France - Market size and forecast 2025-2030

Chart on France - Market size and forecast 2025-2030 ($ million)
Data Table on France - Market size and forecast 2025-2030 ($ million)
Chart on France - Year-over-year growth 2025-2030 (%)
Data Table on France - Year-over-year growth 2025-2030 (%)

12.5.4 Italy - Market size and forecast 2025-2030

Chart on Italy - Market size and forecast 2025-2030 ($ million)
Data Table on Italy - Market size and forecast 2025-2030 ($ million)
Chart on Italy - Year-over-year growth 2025-2030 (%)
Data Table on Italy - Year-over-year growth 2025-2030 (%)

12.5.5 Spain - Market size and forecast 2025-2030

Chart on Spain - Market size and forecast 2025-2030 ($ million)
Data Table on Spain - Market size and forecast 2025-2030 ($ million)
Chart on Spain - Year-over-year growth 2025-2030 (%)
Data Table on Spain - Year-over-year growth 2025-2030 (%)

12.5.6 The Netherlands - Market size and forecast 2025-2030

Chart on The Netherlands - Market size and forecast 2025-2030 ($ million)
Data Table on The Netherlands - Market size and forecast 2025-2030 ($ million)
Chart on The Netherlands - Year-over-year growth 2025-2030 (%)
Data Table on The Netherlands - Year-over-year growth 2025-2030 (%)

12.6 South America - Market size and forecast 2025-2030

Chart on South America - Market size and forecast 2025-2030 ($ million)
Data Table on South America - Market size and forecast 2025-2030 ($ million)
Chart on South America - Year-over-year growth 2025-2030 (%)
Data Table on South America - Year-over-year growth 2025-2030 (%)
Chart on Regional Comparison - South America
Data Table on Regional Comparison - South America

12.6.1 Brazil - Market size and forecast 2025-2030

Chart on Brazil - Market size and forecast 2025-2030 ($ million)
Data Table on Brazil - Market size and forecast 2025-2030 ($ million)
Chart on Brazil - Year-over-year growth 2025-2030 (%)
Data Table on Brazil - Year-over-year growth 2025-2030 (%)

12.6.2 Argentina - Market size and forecast 2025-2030

Chart on Argentina - Market size and forecast 2025-2030 ($ million)
Data Table on Argentina - Market size and forecast 2025-2030 ($ million)
Chart on Argentina - Year-over-year growth 2025-2030 (%)
Data Table on Argentina - Year-over-year growth 2025-2030 (%)

12.6.3 Chile - Market size and forecast 2025-2030

Chart on Chile - Market size and forecast 2025-2030 ($ million)
Data Table on Chile - Market size and forecast 2025-2030 ($ million)
Chart on Chile - Year-over-year growth 2025-2030 (%)
Data Table on Chile - Year-over-year growth 2025-2030 (%)

12.7 Middle East and Africa - Market size and forecast 2025-2030

Chart on Middle East and Africa - Market size and forecast 2025-2030 ($ million)
Data Table on Middle East and Africa - Market size and forecast 2025-2030 ($ million)
Chart on Middle East and Africa - Year-over-year growth 2025-2030 (%)
Data Table on Middle East and Africa - Year-over-year growth 2025-2030 (%)
Chart on Regional Comparison - Middle East and Africa
Data Table on Regional Comparison - Middle East and Africa

12.7.1 Saudi Arabia - Market size and forecast 2025-2030

Chart on Saudi Arabia - Market size and forecast 2025-2030 ($ million)
Data Table on Saudi Arabia - Market size and forecast 2025-2030 ($ million)
Chart on Saudi Arabia - Year-over-year growth 2025-2030 (%)
Data Table on Saudi Arabia - Year-over-year growth 2025-2030 (%)

12.7.2 UAE - Market size and forecast 2025-2030

Chart on UAE - Market size and forecast 2025-2030 ($ million)
Data Table on UAE - Market size and forecast 2025-2030 ($ million)
Chart on UAE - Year-over-year growth 2025-2030 (%)
Data Table on UAE - Year-over-year growth 2025-2030 (%)

12.7.3 South Africa - Market size and forecast 2025-2030

Chart on South Africa - Market size and forecast 2025-2030 ($ million)
Data Table on South Africa - Market size and forecast 2025-2030 ($ million)
Chart on South Africa - Year-over-year growth 2025-2030 (%)
Data Table on South Africa - Year-over-year growth 2025-2030 (%)

12.7.4 Israel - Market size and forecast 2025-2030

Chart on Israel - Market size and forecast 2025-2030 ($ million)
Data Table on Israel - Market size and forecast 2025-2030 ($ million)
Chart on Israel - Year-over-year growth 2025-2030 (%)
Data Table on Israel - Year-over-year growth 2025-2030 (%)

12.7.5 Turkey - Market size and forecast 2025-2030

Chart on Turkey - Market size and forecast 2025-2030 ($ million)
Data Table on Turkey - Market size and forecast 2025-2030 ($ million)
Chart on Turkey - Year-over-year growth 2025-2030 (%)
Data Table on Turkey - Year-over-year growth 2025-2030 (%)

12.8 Market opportunity by geography

Market opportunity by geography ($ million)
Data Tables on Market opportunity by geography ($ million)

13. Drivers, Challenges, and Opportunity

13.1 Market drivers

Expansion of global commercial vehicle fleet and rising freight activity
Increasing emphasis on environmental sustainability and circular economy
Continuous innovation in retreading technology and quality

13.2 Market challenges

Pervasive negative consumer perception and inadequate market education
Intense price competition from low cost new tire imports
Scarcity and inconsistent quality of suitable tire casings

13.3 Impact of drivers and challenges

Impact of drivers and challenges in 2025 and 2030

13.4 Market opportunities

Integration of digitalization and fleet management solutions
Proliferation of application specific retreaded tires
Expansion into light commercial and electric vehicle segments

14. Competitive Landscape

14.1 Overview

14.2

Overview on criticality of inputs and factors of differentiation

14.3 Landscape disruption

Overview on factors of disruption

14.4 Industry risks

Impact of key risks on business

15. Competitive Analysis

15.1 Companies profiled

Companies covered

15.2 Company ranking index

15.3 Market positioning of companies

Matrix on companies position and classification

15.4 Bridgestone Corp.

Bridgestone Corp. - Overview
Bridgestone Corp. - Business segments
Bridgestone Corp. - Key offerings
Bridgestone Corp. - Segment focus
SWOT

15.5 CIO Tyres Pvt. Ltd

CIO Tyres Pvt. Ltd - Overview
CIO Tyres Pvt. Ltd - Product / Service
CIO Tyres Pvt. Ltd - Key offerings
SWOT

15.6 Continental AG

Continental AG - Overview
Continental AG - Business segments
Continental AG - Key offerings
Continental AG - Segment focus
SWOT

15.7 Eastern Treads Ltd.

Eastern Treads Ltd. - Overview
Eastern Treads Ltd. - Product / Service
Eastern Treads Ltd. - Key offerings
SWOT

15.8 Goodyear Tire and Rubber Co.

Goodyear Tire and Rubber Co. - Overview
Goodyear Tire and Rubber Co. - Business segments
Goodyear Tire and Rubber Co. - Key offerings
Goodyear Tire and Rubber Co. - Segment focus
SWOT

15.9 JK Tyre and Industries Ltd.

JK Tyre and Industries Ltd. - Overview
JK Tyre and Industries Ltd. - Business segments
JK Tyre and Industries Ltd. - Key offerings
JK Tyre and Industries Ltd. - Segment focus
SWOT

15.10 Kal Tire

Kal Tire - Overview
Kal Tire - Product / Service
Kal Tire - Key offerings
SWOT

15.11 KRAIBURG AUSTRIA GmbH

KRAIBURG AUSTRIA GmbH - Overview
KRAIBURG AUSTRIA GmbH - Product / Service
KRAIBURG AUSTRIA GmbH - Key offerings
SWOT

15.12 MARANGONI Group.

MARANGONI Group. - Overview
MARANGONI Group. - Product / Service
MARANGONI Group. - Key offerings
SWOT

15.13 Michelin

Michelin - Overview
Michelin - Business segments
Michelin - Key offerings
Michelin - Segment focus
SWOT

15.14 MRF Ltd.

MRF Ltd. - Overview
MRF Ltd. - Product / Service
MRF Ltd. - Key offerings
SWOT

15.15 Nokian Tyres Plc

Nokian Tyres Plc - Overview
Nokian Tyres Plc - Business segments
Nokian Tyres Plc - Key offerings
Nokian Tyres Plc - Segment focus
SWOT

15.16 Oliver Rubber Co.

Oliver Rubber Co. - Overview
Oliver Rubber Co. - Product / Service
Oliver Rubber Co. - Key offerings
SWOT

15.17 REIFEN HINGHAUS GmbH

REIFEN HINGHAUS GmbH - Overview
REIFEN HINGHAUS GmbH - Product / Service
REIFEN HINGHAUS GmbH - Key offerings
SWOT

15.18 Yokohama Rubber Co. Ltd.

Yokohama Rubber Co. Ltd. - Overview
Yokohama Rubber Co. Ltd. - Business segments
Yokohama Rubber Co. Ltd. - Key offerings
Yokohama Rubber Co. Ltd. - Segment focus
SWOT

16. Appendix

16.1 Scope of the report

Market definition
Objectives
Notes and caveats

16.2 Inclusions and exclusions checklist

Inclusions checklist
Exclusions checklist

16.3 Currency conversion rates for US$

16.4 Research methodology

16.5 Data procurement

Information sources

16.6 Data validation

16.7 Validation techniques employed for market sizing

16.8 Data synthesis

16.9 360 degree market analysis

16.10 List of abbreviations

Research Methodology

Technavio presents a detailed picture of the market by way of study, synthesis, and summation of data from multiple sources. The analysts have presented the various facets of the market with a particular focus on identifying the key industry influencers. The data thus presented is comprehensive, reliable, and the result of extensive research, both primary and secondary.

INFORMATION SOURCES

Primary sources

  • Manufacturers and suppliers
  • Channel partners
  • Industry experts
  • Strategic decision makers

Secondary sources

  • Industry journals and periodicals
  • Government data
  • Financial reports of key industry players
  • Historical data
  • Press releases

DATA ANALYSIS

Data Synthesis

  • Collation of data
  • Estimation of key figures
  • Analysis of derived insights

Data Validation

  • Triangulation with data models
  • Reference against proprietary databases
  • Corroboration with industry experts

REPORT WRITING

Qualitative

  • Market drivers
  • Market challenges
  • Market trends
  • Five forces analysis

Quantitative

  • Market size and forecast
  • Market segmentation
  • Geographical insights
  • Competitive landscape

Interested in this report?

Get your sample now to see our research methodology and insights!

Download Now

Frequently Asked Questions

Automotive Retreaded Tires market growth will increase by USD 5802.4 million during 2026-2030.

The Automotive Retreaded Tires market is expected to grow at a CAGR of 7.8% during 2026-2030.

Automotive Retreaded Tires market is segmented by Product (Precure, Mold cure) Vehicle type (Commercial vehicle, Passenger vehicle) End-user (Aftermarket, OEM)

Bridgestone Corp., CIO Tyres Pvt. Ltd, Continental AG, Eastern Treads Ltd., Goodyear Tire and Rubber Co., JK Tyre and Industries Ltd., Kal Tire, KRAIBURG AUSTRIA GmbH, MARANGONI Group., Michelin, MRF Ltd., Nokian Tyres Plc, Oliver Rubber Co., Parrish Tire Co., RDH Tire and Retread Co., REIFEN HINGHAUS GmbH, ROSLER TYRE INNOVATORS, Tyresoles, West End Tire, Yokohama Rubber Co. Ltd. are a few of the key vendors in the Automotive Retreaded Tires market.

North America will register the highest growth rate of 40.9% among the other regions. Therefore, the Automotive Retreaded Tires market in North America is expected to garner significant business opportunities for the vendors during the forecast period.

US, Canada, Mexico, China, Japan, India, South Korea, Australia, Indonesia, Germany, UK, France, Italy, Spain, The Netherlands, Brazil, Argentina, Chile, Saudi Arabia, UAE, South Africa, Israel, Turkey

  • Expansion of global commercial vehicle fleet and rising freight activity is the driving factor this market.

The Automotive Retreaded Tires market vendors should focus on grabbing business opportunities from the Product segment as it accounted for the largest market share in the base year.
RIA - Research AI Assistant
Ask RIA