Axial Flow Pump Market Analysis APAC, Europe, North America, South America, Middle East and Africa - US, China, Japan, Germany, UK - Size and Forecast 2024-2028

Axial Flow Pump Market Analysis APAC, Europe, North America, South America, Middle East and Africa - US, China, Japan, Germany, UK - Size and Forecast 2024-2028

Published: Dec 2023 161 Pages SKU: IRTNTR76988

Market Overview at a Glance

$6.69 B
Market Opportunity
4.23%
CAGR
3.69
YoY growth 2023-2024(%)

Axial Flow Pump Market Size 2024-2028 

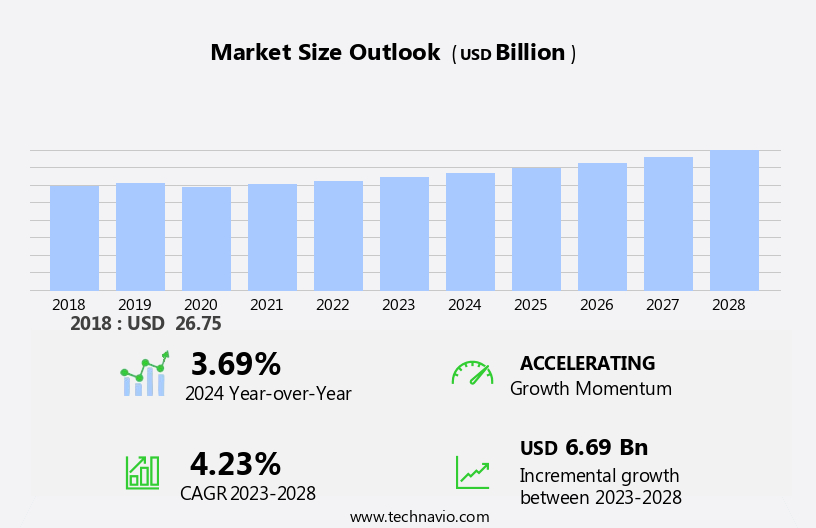
The axial flow pump market size is forecast to increase by USD 6.69 billion at a CAGR of 4.23% between 2023 and 2028.

  • The market is experiencing significant growth due to various key trends and factors. One of the primary drivers is the increasing investments in water infrastructure projects worldwide. These projects require advanced and efficient water management solutions, leading to a rise in demand for axial flow pumps. Another trend influencing the market is the digitalization and integration of IoT technology in water management systems. This enables real-time monitoring and predictive maintenance, enhancing the overall performance and efficiency of axial flow pumps. The material used in manufacturing axial flow pumps varies, including cast iron, plastic, aluminum, brass, bronze, and ceramics. However, one challenge that the market faces is the high energy consumption associated with axial flow pumps. To mitigate this, manufacturers are focusing on developing energy-efficient designs and technologies to cater to the evolving market demands.

What will be the Size of the Market During the Forecast Period?

Axial Flow Pump Market Size

 Request Free Sample

  • Axial flow pumps, also known as propeller pumps, play a pivotal role in industrial pumps due to their unique design and functionality. These pumps utilize a propeller-type impeller that creates a flow by imparting centrifugal force on the fluid. The fluid enters the pump impeller along the axis of rotation, and the propeller blades push the fluid outward, creating a flow. The market is driven by several factors. The increasing demand for energy efficiency in industrial applications is one of the primary drivers. These pumps offer high energy efficiency due to their ability to handle large volumes of fluid at low-pressure heads.

    Moreover, they are suitable for handling large discharge rates and controlled vertical heads, making them an ideal choice for various industries. Natural calamities, such as floods and waterlogged areas, have also fueled the demand for axial flow pumps. The spillage from the horizontal shaft, along with the suction and discharge lines, has caused significant waterlogging in the area, requiring the installation of positive displacement pumps to manage the high volume flow rates, while concrete inlet and outlet canals are being reinforced to direct water efficiently. These pumps are effective in moving large volumes of water quickly and efficiently, making them indispensable during emergencies. The versatility of axial flow pumps in handling various fluids, including water, makes them a popular choice for various industries. Each material offers unique advantages, such as durability, lightweight, and corrosion resistance, making them suitable for different applications.

How is this market segmented and which is the largest segment?

The market research report provides comprehensive data (region-wise segment analysis), with forecasts and estimates in "USD billion" for 2024-2028, as well as historical data from 2018-2022 for the following segments.
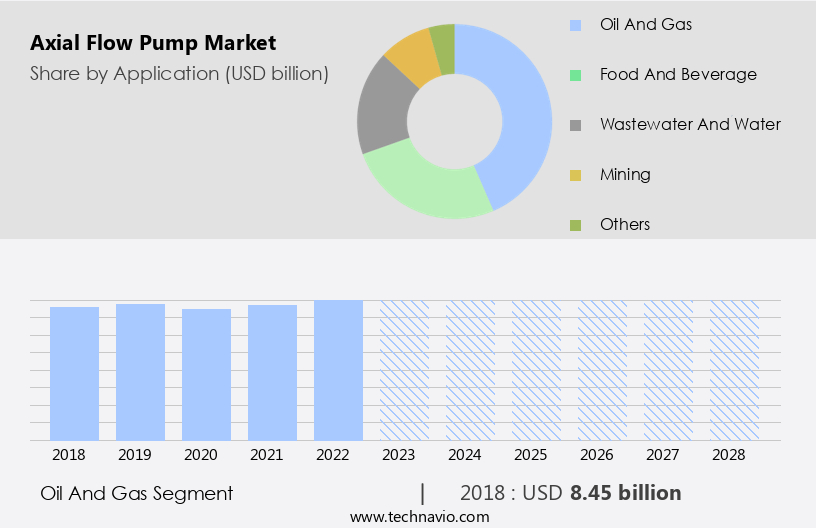
  • Application
    • Oil and gas
    • Food and beverage
    • Wastewater and water
    • Mining
    • Others
  • Type
    • Horizontal
    • Vertical
  • Geography
    • APAC
      • China
      • Japan
    • Europe
      • Germany
      • UK
    • North America
      • US
    • South America
    • Middle East and Africa

By Application Insights

  • The oil and gas segment is estimated to witness significant growth during the forecast period.

The market has witnessed significant growth, particularly in the sectors of drainage, municipal authorities, and the petroleum industry. In the oil and gas sector, the increase in exploration and production activities in 2021-2022, fueled by rising energy demands, has led to heightened requirements for pumping solutions. Notable projects are driving the demand for axial flow pumps due to their ability to efficiently transport fluids. Additionally, the power generation sector and water management plants are adopting axial flow pumps for their multi-stage capabilities in handling chemicals and sewage systems.

Furthermore, the trend towards sustainable energy solutions, including carbon capture and storage (CCS) projects, presents further opportunities for manufacturers to contribute to eco-friendly initiatives.

Axial Flow Pump Market Size

Get a glance at the market report of share of various segments Request Free Sample

The oil and gas segment was valued at USD 8.45 billion in 2018 and showed a gradual increase during the forecast period.

Regional Analysis

  • APAC is estimated to contribute 42% to the growth of the global market during the forecast period.

Technavio's analysts have elaborately explained the regional trends and drivers that shape the market during the forecast period.

Axial Flow Pump Market Share by Geography

For more insights on the market share of various regions Request Free Sample

The market in the Asia Pacific (APAC) region is experiencing significant expansion due to the increasing demand for efficient water management systems. The region's rapid urbanization and industrialization have led to an increased need for large-scale water transportation in industries such as agriculture, wastewater treatment, and aquaculture. In agricultural regions like India and China, axial flow pumps are essential for irrigation systems. Moreover, the APAC region is susceptible to natural calamities like floods, which necessitates the use of axial flow pumps for flood control and drainage systems. These pumps operate by utilizing centrifugal force generated by a propeller-type impeller to move fluids.

Furthermore, the pump shaft rotates, transferring the fluid from the inlet to the outlet. Axial flow pumps are particularly suitable for low-pressure heads and are widely used in power plants for cooling purposes. The market is poised for continued growth due to the region's development needs and the essential role these pumps play in water management and industrial processes.

Market Dynamics

Our researchers analyzed the data with 2023 as the base year, along with the key drivers, trends, and challenges. A holistic analysis of drivers will help companies refine their marketing strategies to gain a competitive advantage.

What are the key market drivers leading to the rise in the adoption of Axial Flow Pump Market?

Growing investments in water infrastructure projects is the key driver of the market.

  • The market is experiencing significant growth due to increased investment in water infrastructure projects worldwide. These projects encompass various applications, including irrigation, flood control, and wastewater treatment, which necessitate efficient water management and movement. In India, for instance, the Pradhan Mantri Krishi Sinchayee Yojana (PMKSY) aims to enhance irrigation efficiency by implementing axial flow pumps for optimal water distribution in agricultural fields. Additionally, these pumps are utilized in flood-prone areas to manage excess water, shielding communities and valuable farmland. Furthermore, the heightened focus on wastewater treatment to tackle environmental issues and water scarcity is driving the adoption of axial flow pumps in sewage and effluent treatment plants.
  • Power plants, oil and gas, petrochemical, chemical, pharmaceutical, food and beverages, mining, and energy demand sectors also rely on axial flow pumps for diverse applications, such as cooling water circulation, fluid transfer, and controlled vertical heads. The market is further fueled by energy efficiency, high discharge rate, and ability to handle a wide range of fluids, including viscous ones, in various industries. Infrastructural development and rapid industrialization are also key factors contributing to the market's expansion. Axial flow pumps are available in various materials, such as cast iron, plastic, aluminum, brass, bronze, and ceramics, catering to diverse applications and industries.

The market is segmented into single-stage and multi-stage pumps, with different blade lengths, dimensions, and stage efficiencies to meet the specific requirements of various end-use segments, including wastewater, drainage, and municipal authorities. Axial flow pumps play a crucial role in pumping solutions for the petroleum industry, power generation sector, water management plants, and other applications, making them an essential component in addressing energy demands and managing water and wastewater.

What are the market trends shaping the Axial Flow Pump Market?

Digitalization and IoT Integration is the upcoming trend in the market.

  • The market is witnessing significant growth due to the increasing demand for efficient and cost-effective pumping solutions in various end-use segments. Axial flow pumps, also known as propeller-type pumps, operate based on Centrifugal force, which moves the fluid by pushing it against the direction of rotation of the pump shaft. These pumps are commonly used in low-pressure head applications, including flood dewatering, water and wastewater treatment, and drainage systems. Natural calamities such as floods and waterlogged areas require immediate pumping solutions, making axial flow pumps a popular choice due to their high discharge rate and controlled vertical heads. In power plants, these pumps are used for cooling water and in evaporators, sewage digesters, and irrigation systems in agriculture.
  • Additionally, they are utilized in fisheries, oil and gas, petrochemical, chemical, pharmaceutical, food and beverages, mining, and energy demand sectors. Axial flow pumps are available in various materials such as cast iron, plastic, aluminum, brass, bronze, and ceramics, catering to different application requirements. The market is driven by the need for energy efficiency, increased energy demand, and infrastructure development. The integration of IoT sensors and smart controls in axial flow pumps is a transformational trend, enabling real-time data monitoring and predictive maintenance, thereby improving operational efficiency and saving maintenance costs. In industrial settings, predictive maintenance algorithms use sensor data to identify possible pump failures, allowing for preventive maintenance and minimizing downtime.

What challenges does Axial Flow Pump Market face during the growth?

High energy consumption associated with axial flow pumps is a key challenge affecting the market growth.

  • The market faces challenges due to the energy-intensive nature of these pumps, particularly in applications requiring high flow rates. While axial flow pumps are effective in transporting large quantities of fluid, their energy consumption can be substantial. This raises concerns for businesses, especially those in agriculture, where irrigation demands are significant. The increased energy usage leads to higher utility costs, impacting profitability. Additionally, there is growing environmental concern as energy consumption contributes to greenhouse gas emissions. In industries such as oil and gas, petrochemical, chemical, pharmaceutical, food and beverages, mining, and energy demand-driven sectors, axial flow pumps are widely used in various applications, including water management plants, power plants, and wastewater treatment.
  • Infrastructural development and rapid industrialization have increased the demand for pumping solutions, particularly in wastewater treatment, cooling water pumps, and operating drainage systems. However, the high energy consumption of axial flow pumps can hinder market growth. Factors such as natural calamities like floods and waterlogged areas require immediate pumping solutions, leading to increased demand for these pumps. Despite these challenges, market drivers like oil field activities, exploration activities, and energy efficiency improvements are expected to fuel market growth. The market caters to various end-use segments, including wastewater, oil and gas, petrochemical, chemical, pharmaceutical, food and beverages, mining, and energy demand-driven sectors.

Exclusive Customer Landscape

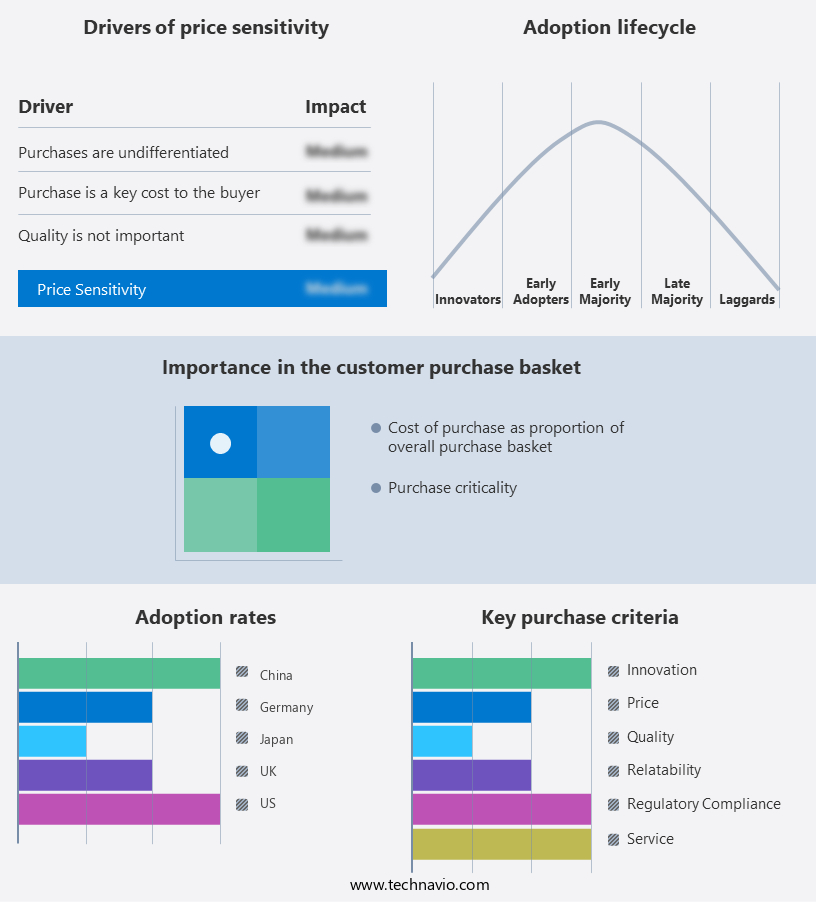
The market forecasting report includes the adoption lifecycle of the market, covering from the innovator's stage to the laggard's stage. It focuses on adoption rates in different regions based on penetration. Furthermore, the market report also includes key purchase criteria and drivers of price sensitivity to help companies evaluate and develop their market growth analysis strategies.

Axial Flow Pump Market Share by Geography

 Customer Landscape

Key Companies & Market Insights

Companies are implementing various strategies, such as strategic alliances, market forecast , partnerships, mergers and acquisitions, geographical expansion, and product/service launches, to enhance their presence in the market.

The market research and growth report includes detailed analyses of the competitive landscape of the market and information about key companies, including:

  • Ebara Corp.
  • Emile Egger and Cie SA 
  • Flowmore Ltd.
  • Flowserve Corp.
  • Fluid Engineering
  • Grundfos Holding AS
  • Holland Pump
  • ITT Inc.
  • KSB SE and Co. KGaA
  • MWI Pumps
  • Pentair Plc
  • Pioneer Group
  • Propeller Pumps
  • Ruhrpumpen Group
  • Sintech Precision Products Ltd.
  • Sulzer Management Ltd.
  • The Gorman Rupp Co.
  • The Weir Group Plc
  • Tsurumi Manufacturing Co. Ltd.
  • Xylem Inc.

Qualitative and quantitative analysis of companies has been conducted to help clients understand the wider business environment as well as the strengths and weaknesses of key market players. Data is qualitatively analyzed to categorize companies as pure play, category-focused, industry-focused, and diversified; it is quantitatively analyzed to categorize companies as dominant, leading, strong, tentative, and weak.

Research Analyst Overview

Axial flow pumps, a type of fluid transporting machinery, have gained significant traction in various industries due to their unique design and operational efficiency. These pumps utilize a propeller-type impeller that functions based on centrifugal force to move fluids. The market is driven by several factors, including the increasing demand for water and wastewater treatment, oil field activities, and energy demand in power plants and industries. Natural calamities such as floods and waterlogged areas further necessitate the use of pumping solutions for flood dewatering and drainage systems. The market for axial flow pumps is segmented into various end-use industries.

Furthermore, in the water and wastewater sector, these pumps are used for wastewater treatment, controlled vertical heads, and flood dewatering. In the oil and gas industry, they are employed for oil field activities and the petrochemical sector for handling viscous fluids. The chemical industry, pharmaceutical sector, food and beverages, mining, and energy efficiency are other significant end-users. The design and construction of axial flow pumps vary based on their application. Single-stage and multi-stage pumps are commonly used, with dimensions and blade lengths tailored to meet specific requirements. Materials like cast iron, plastic, aluminum, brass, bronze, and ceramics are used for manufacturing axial flow pumps, depending on the fluid properties and operating conditions.

Market Scope

Report Coverage

Details

Page number

161

Base year

2023

Historic period

2018-2022

Forecast period

2024-2028

Growth momentum & CAGR

Accelerate at a CAGR of 4.23%

Market Growth 2024-2028

USD 6.69 billion

Market structure

Fragmented

YoY growth 2023-2024(%)

3.69

Key countries

US, China, Japan, Germany, and UK

Competitive landscape

Leading Companies, Market Positioning of Companies, Competitive Strategies, and Industry Risks

Request Free Sample

What are the Key Data Covered in this Market Research and Growth Report?

  • CAGR of the market during the forecast period
  • Detailed information on factors that will drive the market growth and forecasting between 2024 and 2028
  • Precise estimation of the size of the market  and its contribution of the market in focus to the parent market
  • Accurate predictions about upcoming market growth and trends and changes in consumer behaviour
  • Growth of the market across APAC, Europe, North America, South America, and Middle East and Africa
  • Thorough analysis of the market's competitive landscape and detailed information about companies
  • Comprehensive analysis of factors that will challenge the growth of market companies

We can help! Our analysts can customize this market research report to meet your requirements. Get in touch

1 Executive Summary

  • 1.1 Market overview
    • Exhibit 01: Executive Summary – Chart on Market Overview
    • Exhibit 02: Executive Summary – Data Table on Market Overview
    • Exhibit 03: Executive Summary – Chart on Global Market Characteristics
    • Exhibit 04: Executive Summary – Chart on Market by Geography
    • Exhibit 05: Executive Summary – Chart on Market Segmentation by Application
    • Exhibit 06: Executive Summary – Chart on Market Segmentation by Type
    • Exhibit 07: Executive Summary – Chart on Incremental Growth
    • Exhibit 08: Executive Summary – Data Table on Incremental Growth
    • Exhibit 09: Executive Summary – Chart on Vendor Market Positioning

2 Market Landscape

  • 2.1 Market ecosystem
    • Exhibit 10: Parent market
    • Exhibit 11: Market Characteristics

3 Market Sizing

  • 3.1 Market definition
    • Exhibit 12: Offerings of vendors included in the market definition
  • 3.2 Market segment analysis
    • Exhibit 13: Market segments
  • 3.3 Market size 2023
    • 3.4 Market outlook: Forecast for 2023-2028
      • Exhibit 14: Chart on Global - Market size and forecast 2023-2028 ($ billion)
      • Exhibit 15: Data Table on Global - Market size and forecast 2023-2028 ($ billion)
      • Exhibit 16: Chart on Global Market: Year-over-year growth 2023-2028 (%)
      • Exhibit 17: Data Table on Global Market: Year-over-year growth 2023-2028 (%)

    4 Historic Market Size

    • 4.1 Global axial flow pump market 2018 - 2022
      • Exhibit 18: Historic Market Size – Data Table on global axial flow pump market 2018 - 2022 ($ billion)
    • 4.2 Application Segment Analysis 2018 - 2022
      • Exhibit 19: Historic Market Size – Application Segment 2018 - 2022 ($ billion)
    • 4.3 Type Segment Analysis 2018 - 2022
      • Exhibit 20: Historic Market Size – Type Segment 2018 - 2022 ($ billion)
    • 4.4 Geography Segment Analysis 2018 - 2022
      • Exhibit 21: Historic Market Size – Geography Segment 2018 - 2022 ($ billion)
    • 4.5 Country Segment Analysis 2018 - 2022
      • Exhibit 22: Historic Market Size – Country Segment 2018 - 2022 ($ billion)

    5 Five Forces Analysis

    • 5.1 Five forces summary
      • Exhibit 23: Five forces analysis - Comparison between 2023 and 2028
    • 5.2 Bargaining power of buyers
      • Exhibit 24: Chart on Bargaining power of buyers – Impact of key factors 2023 and 2028
    • 5.3 Bargaining power of suppliers
      • Exhibit 25: Bargaining power of suppliers – Impact of key factors in 2023 and 2028
    • 5.4 Threat of new entrants
      • Exhibit 26: Threat of new entrants – Impact of key factors in 2023 and 2028
    • 5.5 Threat of substitutes
      • Exhibit 27: Threat of substitutes – Impact of key factors in 2023 and 2028
    • 5.6 Threat of rivalry
      • Exhibit 28: Threat of rivalry – Impact of key factors in 2023 and 2028
    • 5.7 Market condition
      • Exhibit 29: Chart on Market condition - Five forces 2023 and 2028

    6 Market Segmentation by Application

    • 6.1 Market segments
      • Exhibit 30: Chart on Application - Market share 2023-2028 (%)
      • Exhibit 31: Data Table on Application - Market share 2023-2028 (%)
    • 6.2 Comparison by Application
      • Exhibit 32: Chart on Comparison by Application
      • Exhibit 33: Data Table on Comparison by Application
    • 6.3 Oil and gas - Market size and forecast 2023-2028
      • Exhibit 34: Chart on Oil and gas - Market size and forecast 2023-2028 ($ billion)
      • Exhibit 35: Data Table on Oil and gas - Market size and forecast 2023-2028 ($ billion)
      • Exhibit 36: Chart on Oil and gas - Year-over-year growth 2023-2028 (%)
      • Exhibit 37: Data Table on Oil and gas - Year-over-year growth 2023-2028 (%)
    • 6.4 Food and beverage - Market size and forecast 2023-2028
      • Exhibit 38: Chart on Food and beverage - Market size and forecast 2023-2028 ($ billion)
      • Exhibit 39: Data Table on Food and beverage - Market size and forecast 2023-2028 ($ billion)
      • Exhibit 40: Chart on Food and beverage - Year-over-year growth 2023-2028 (%)
      • Exhibit 41: Data Table on Food and beverage - Year-over-year growth 2023-2028 (%)
    • 6.5 Wastewater and water - Market size and forecast 2023-2028
      • Exhibit 42: Chart on Wastewater and water - Market size and forecast 2023-2028 ($ billion)
      • Exhibit 43: Data Table on Wastewater and water - Market size and forecast 2023-2028 ($ billion)
      • Exhibit 44: Chart on Wastewater and water - Year-over-year growth 2023-2028 (%)
      • Exhibit 45: Data Table on Wastewater and water - Year-over-year growth 2023-2028 (%)
    • 6.6 Mining - Market size and forecast 2023-2028
      • Exhibit 46: Chart on Mining - Market size and forecast 2023-2028 ($ billion)
      • Exhibit 47: Data Table on Mining - Market size and forecast 2023-2028 ($ billion)
      • Exhibit 48: Chart on Mining - Year-over-year growth 2023-2028 (%)
      • Exhibit 49: Data Table on Mining - Year-over-year growth 2023-2028 (%)
    • 6.7 Others - Market size and forecast 2023-2028
      • Exhibit 50: Chart on Others - Market size and forecast 2023-2028 ($ billion)
      • Exhibit 51: Data Table on Others - Market size and forecast 2023-2028 ($ billion)
      • Exhibit 52: Chart on Others - Year-over-year growth 2023-2028 (%)
      • Exhibit 53: Data Table on Others - Year-over-year growth 2023-2028 (%)
    • 6.8 Market opportunity by Application
      • Exhibit 54: Market opportunity by Application ($ billion)
      • Exhibit 55: Data Table on Market opportunity by Application ($ billion)

    7 Market Segmentation by Type

    • 7.1 Market segments
      • Exhibit 56: Chart on Type - Market share 2023-2028 (%)
      • Exhibit 57: Data Table on Type - Market share 2023-2028 (%)
    • 7.2 Comparison by Type
      • Exhibit 58: Chart on Comparison by Type
      • Exhibit 59: Data Table on Comparison by Type
    • 7.3 Horizontal - Market size and forecast 2023-2028
      • Exhibit 60: Chart on Horizontal - Market size and forecast 2023-2028 ($ billion)
      • Exhibit 61: Data Table on Horizontal - Market size and forecast 2023-2028 ($ billion)
      • Exhibit 62: Chart on Horizontal - Year-over-year growth 2023-2028 (%)
      • Exhibit 63: Data Table on Horizontal - Year-over-year growth 2023-2028 (%)
    • 7.4 Vertical - Market size and forecast 2023-2028
      • Exhibit 64: Chart on Vertical - Market size and forecast 2023-2028 ($ billion)
      • Exhibit 65: Data Table on Vertical - Market size and forecast 2023-2028 ($ billion)
      • Exhibit 66: Chart on Vertical - Year-over-year growth 2023-2028 (%)
      • Exhibit 67: Data Table on Vertical - Year-over-year growth 2023-2028 (%)
    • 7.5 Market opportunity by Type
      • Exhibit 68: Market opportunity by Type ($ billion)
      • Exhibit 69: Data Table on Market opportunity by Type ($ billion)

    8 Customer Landscape

    • 8.1 Customer landscape overview
      • Exhibit 70: Analysis of price sensitivity, lifecycle, customer purchase basket, adoption rates, and purchase criteria

    9 Geographic Landscape

    • 9.1 Geographic segmentation
      • Exhibit 71: Chart on Market share by geography 2023-2028 (%)
      • Exhibit 72: Data Table on Market share by geography 2023-2028 (%)
    • 9.2 Geographic comparison
      • Exhibit 73: Chart on Geographic comparison
      • Exhibit 74: Data Table on Geographic comparison
    • 9.3 APAC - Market size and forecast 2023-2028
      • Exhibit 75: Chart on APAC - Market size and forecast 2023-2028 ($ billion)
      • Exhibit 76: Data Table on APAC - Market size and forecast 2023-2028 ($ billion)
      • Exhibit 77: Chart on APAC - Year-over-year growth 2023-2028 (%)
      • Exhibit 78: Data Table on APAC - Year-over-year growth 2023-2028 (%)
    • 9.4 Europe - Market size and forecast 2023-2028
      • Exhibit 79: Chart on Europe - Market size and forecast 2023-2028 ($ billion)
      • Exhibit 80: Data Table on Europe - Market size and forecast 2023-2028 ($ billion)
      • Exhibit 81: Chart on Europe - Year-over-year growth 2023-2028 (%)
      • Exhibit 82: Data Table on Europe - Year-over-year growth 2023-2028 (%)
    • 9.5 North America - Market size and forecast 2023-2028
      • Exhibit 83: Chart on North America - Market size and forecast 2023-2028 ($ billion)
      • Exhibit 84: Data Table on North America - Market size and forecast 2023-2028 ($ billion)
      • Exhibit 85: Chart on North America - Year-over-year growth 2023-2028 (%)
      • Exhibit 86: Data Table on North America - Year-over-year growth 2023-2028 (%)
    • 9.6 South America - Market size and forecast 2023-2028
      • Exhibit 87: Chart on South America - Market size and forecast 2023-2028 ($ billion)
      • Exhibit 88: Data Table on South America - Market size and forecast 2023-2028 ($ billion)
      • Exhibit 89: Chart on South America - Year-over-year growth 2023-2028 (%)
      • Exhibit 90: Data Table on South America - Year-over-year growth 2023-2028 (%)
    • 9.7 Middle East and Africa - Market size and forecast 2023-2028
      • Exhibit 91: Chart on Middle East and Africa - Market size and forecast 2023-2028 ($ billion)
      • Exhibit 92: Data Table on Middle East and Africa - Market size and forecast 2023-2028 ($ billion)
      • Exhibit 93: Chart on Middle East and Africa - Year-over-year growth 2023-2028 (%)
      • Exhibit 94: Data Table on Middle East and Africa - Year-over-year growth 2023-2028 (%)
    • 9.8 China - Market size and forecast 2023-2028
      • Exhibit 95: Chart on China - Market size and forecast 2023-2028 ($ billion)
      • Exhibit 96: Data Table on China - Market size and forecast 2023-2028 ($ billion)
      • Exhibit 97: Chart on China - Year-over-year growth 2023-2028 (%)
      • Exhibit 98: Data Table on China - Year-over-year growth 2023-2028 (%)
    • 9.9 US - Market size and forecast 2023-2028
      • Exhibit 99: Chart on US - Market size and forecast 2023-2028 ($ billion)
      • Exhibit 100: Data Table on US - Market size and forecast 2023-2028 ($ billion)
      • Exhibit 101: Chart on US - Year-over-year growth 2023-2028 (%)
      • Exhibit 102: Data Table on US - Year-over-year growth 2023-2028 (%)
    • 9.10 Japan - Market size and forecast 2023-2028
      • Exhibit 103: Chart on Japan - Market size and forecast 2023-2028 ($ billion)
      • Exhibit 104: Data Table on Japan - Market size and forecast 2023-2028 ($ billion)
      • Exhibit 105: Chart on Japan - Year-over-year growth 2023-2028 (%)
      • Exhibit 106: Data Table on Japan - Year-over-year growth 2023-2028 (%)
    • 9.11 Germany - Market size and forecast 2023-2028
      • Exhibit 107: Chart on Germany - Market size and forecast 2023-2028 ($ billion)
      • Exhibit 108: Data Table on Germany - Market size and forecast 2023-2028 ($ billion)
      • Exhibit 109: Chart on Germany - Year-over-year growth 2023-2028 (%)
      • Exhibit 110: Data Table on Germany - Year-over-year growth 2023-2028 (%)
    • 9.12 UK - Market size and forecast 2023-2028
      • Exhibit 111: Chart on UK - Market size and forecast 2023-2028 ($ billion)
      • Exhibit 112: Data Table on UK - Market size and forecast 2023-2028 ($ billion)
      • Exhibit 113: Chart on UK - Year-over-year growth 2023-2028 (%)
      • Exhibit 114: Data Table on UK - Year-over-year growth 2023-2028 (%)
    • 9.13 Market opportunity by geography
      • Exhibit 115: Market opportunity by geography ($ billion)
      • Exhibit 116: Data Tables on Market opportunity by geography ($ billion)

    10 Drivers, Challenges, and Trends

    • 10.1 Market drivers
      • 10.2 Market challenges
        • 10.3 Impact of drivers and challenges
          • Exhibit 117: Impact of drivers and challenges in 2023 and 2028
        • 10.4 Market trends

          11 Vendor Landscape

          • 11.1 Overview
            • 11.2 Vendor landscape
              • Exhibit 118: Overview on Criticality of inputs and Factors of differentiation
            • 11.3 Landscape disruption
              • Exhibit 119: Overview on factors of disruption
            • 11.4 Industry risks
              • Exhibit 120: Impact of key risks on business

            12 Vendor Analysis

            • 12.1 Vendors covered
              • Exhibit 121: Vendors covered
            • 12.2 Market positioning of vendors
              • Exhibit 122: Matrix on vendor position and classification
            • 12.3 Ebara Corp.
              • Exhibit 123: Ebara Corp. - Overview
              • Exhibit 124: Ebara Corp. - Business segments
              • Exhibit 125: Ebara Corp. - Key offerings
              • Exhibit 126: Ebara Corp. - Segment focus
            • 12.4 Emile Egger and Cie SA
              • Exhibit 127: Emile Egger and Cie SA  - Overview
              • Exhibit 128: Emile Egger and Cie SA  - Product / Service
              • Exhibit 129: Emile Egger and Cie SA  - Key offerings
            • 12.5 Flowmore Ltd.
              • Exhibit 130: Flowmore Ltd. - Overview
              • Exhibit 131: Flowmore Ltd. - Product / Service
              • Exhibit 132: Flowmore Ltd. - Key offerings
            • 12.6 Flowserve Corp.
              • Exhibit 133: Flowserve Corp. - Overview
              • Exhibit 134: Flowserve Corp. - Business segments
              • Exhibit 135: Flowserve Corp. - Key news
              • Exhibit 136: Flowserve Corp. - Key offerings
              • Exhibit 137: Flowserve Corp. - Segment focus
            • 12.7 Fluid Engineering
              • Exhibit 138: Fluid Engineering - Overview
              • Exhibit 139: Fluid Engineering - Product / Service
              • Exhibit 140: Fluid Engineering - Key offerings
            • 12.8 Grundfos Holding AS
              • Exhibit 141: Grundfos Holding AS - Overview
              • Exhibit 142: Grundfos Holding AS - Product / Service
              • Exhibit 143: Grundfos Holding AS - Key news
              • Exhibit 144: Grundfos Holding AS - Key offerings
            • 12.9 Holland Pump
              • Exhibit 145: Holland Pump - Overview
              • Exhibit 146: Holland Pump - Product / Service
              • Exhibit 147: Holland Pump - Key news
              • Exhibit 148: Holland Pump - Key offerings
            • 12.10 KSB SE and Co. KGaA
              • Exhibit 149: KSB SE and Co. KGaA - Overview
              • Exhibit 150: KSB SE and Co. KGaA - Business segments
              • Exhibit 151: KSB SE and Co. KGaA - Key offerings
              • Exhibit 152: KSB SE and Co. KGaA - Segment focus
            • 12.11 MWI Pumps
              • Exhibit 153: MWI Pumps - Overview
              • Exhibit 154: MWI Pumps - Product / Service
              • Exhibit 155: MWI Pumps - Key news
              • Exhibit 156: MWI Pumps - Key offerings
            • 12.12 Pentair Plc
              • Exhibit 157: Pentair Plc - Overview
              • Exhibit 158: Pentair Plc - Business segments
              • Exhibit 159: Pentair Plc - Key news
              • Exhibit 160: Pentair Plc - Key offerings
              • Exhibit 161: Pentair Plc - Segment focus
            • 12.13 Ruhrpumpen Group
              • Exhibit 162: Ruhrpumpen Group - Overview
              • Exhibit 163: Ruhrpumpen Group - Product / Service
              • Exhibit 164: Ruhrpumpen Group - Key offerings
            • 12.14 Sintech Precision Products Ltd.
              • Exhibit 165: Sintech Precision Products Ltd. - Overview
              • Exhibit 166: Sintech Precision Products Ltd. - Product / Service
              • Exhibit 167: Sintech Precision Products Ltd. - Key offerings
            • 12.15 Sulzer Management Ltd.
              • Exhibit 168: Sulzer Management Ltd. - Overview
              • Exhibit 169: Sulzer Management Ltd. - Business segments
              • Exhibit 170: Sulzer Management Ltd. - Key news
              • Exhibit 171: Sulzer Management Ltd. - Key offerings
              • Exhibit 172: Sulzer Management Ltd. - Segment focus
            • 12.16 The Gorman Rupp Co.
              • Exhibit 173: The Gorman Rupp Co. - Overview
              • Exhibit 174: The Gorman Rupp Co. - Product / Service
              • Exhibit 175: The Gorman Rupp Co. - Key offerings
            • 12.17 Xylem Inc.
              • Exhibit 176: Xylem Inc. - Overview
              • Exhibit 177: Xylem Inc. - Business segments
              • Exhibit 178: Xylem Inc. - Key offerings
              • Exhibit 179: Xylem Inc. - Segment focus

            13 Appendix

            • 13.1 Scope of the report
              • 13.2 Inclusions and exclusions checklist
                • Exhibit 180: Inclusions checklist
                • Exhibit 181: Exclusions checklist
              • 13.3 Currency conversion rates for US$
                • Exhibit 182: Currency conversion rates for US$
              • 13.4 Research methodology
                • Exhibit 183: Research methodology
                • Exhibit 184: Validation techniques employed for market sizing
                • Exhibit 185: Information sources
              • 13.5 List of abbreviations
                • Exhibit 186: List of abbreviations

              Research Methodology

              Technavio presents a detailed picture of the market by way of study, synthesis, and summation of data from multiple sources. The analysts have presented the various facets of the market with a particular focus on identifying the key industry influencers. The data thus presented is comprehensive, reliable, and the result of extensive research, both primary and secondary.

              INFORMATION SOURCES

              Primary sources

              • Manufacturers and suppliers
              • Channel partners
              • Industry experts
              • Strategic decision makers

              Secondary sources

              • Industry journals and periodicals
              • Government data
              • Financial reports of key industry players
              • Historical data
              • Press releases

              DATA ANALYSIS

              Data Synthesis

              • Collation of data
              • Estimation of key figures
              • Analysis of derived insights

              Data Validation

              • Triangulation with data models
              • Reference against proprietary databases
              • Corroboration with industry experts

              REPORT WRITING

              Qualitative

              • Market drivers
              • Market challenges
              • Market trends
              • Five forces analysis

              Quantitative

              • Market size and forecast
              • Market segmentation
              • Geographical insights
              • Competitive landscape

              Interested in this report?

              Get your sample now to see our research methodology and insights!

              Download Now

              Frequently Asked Questions

              Axial Flow Pump market growth will increase by $ 6.69 bn during 2024-2028.

              The Axial Flow Pump market is expected to grow at a CAGR of 4.23% during 2024-2028.

              Axial Flow Pump market is segmented by Application( Oil and gas, Food and beverage, Wastewater and water, Mining, Others) Type( Horizontal, Vertical)

              Ebara Corp., Emile Egger and Cie SA , Flowmore Ltd., Flowserve Corp., Fluid Engineering, Grundfos Holding AS, Holland Pump, ITT Inc., KSB SE and Co. KGaA, MWI Pumps, Pentair Plc, Pioneer Group, Propeller Pumps, Ruhrpumpen Group, Sintech Precision Products Ltd., Sulzer Management Ltd., The Gorman Rupp Co., The Weir Group Plc, Tsurumi Manufacturing Co. Ltd., Xylem Inc. are a few of the key vendors in the Axial Flow Pump market.

              APAC will register the highest growth rate of 42% among the other regions. Therefore, the Axial Flow Pump market in APAC is expected to garner significant business opportunities for the vendors during the forecast period.

              US, China, Japan, Germany, UK

              • Growing investments in water infrastructure projectsIncreased investment in water infrastructure projects around the world is a major driver in the global axial flow pump market. These projects cover a wide range of uses is the driving factor this market.
              • such as irrigation is the driving factor this market.
              • flood control is the driving factor this market.
              • and wastewater treatment is the driving factor this market.
              • which all require effective water movement and management. For example is the driving factor this market.
              • in India is the driving factor this market.
              • the Pradhan Mantri Krishi Sinchayee Yojana (PMKSY) attempts to increase irrigation efficiency by deploying axial flow pumps to ensure optimal water distribution to agricultural fields. Axial flow pumps are used in flood-prone locations to control and manage surplus water is the driving factor this market.
              • protecting communities and valuable agricultural land. Furthermore is the driving factor this market.
              • the growing emphasis on wastewater treatment to address environmental concerns and water constraints pushes the use of axial flow pumps in sewage and effluent treatment plants. As governments and organizations around the world continue to engage in important water infrastructure projects is the driving factor this market.
              • demand for axial flow pumps is likely to rise is the driving factor this market.
              • supporting expansion in the global market during the forecast period. is the driving factor this market.

              The Axial Flow Pump market vendors should focus on grabbing business opportunities from the Oil and gas segment as it accounted for the largest market share in the base year.
              RIA - Research AI Assistant
              Ask RIA