Plastic Market Analysis, Size, and Forecast 2026-2030: APAC (China, Japan, and India), North America (US, Canada, and Mexico), Europe (Germany, UK, and France), Middle East and Africa (Saudi Arabia, UAE, and South Africa), South America (Brazil and Argentina), and Rest of World (ROW)

Plastic Market Analysis, Size, and Forecast 2026-2030:
APAC (China, Japan, and India), North America (US, Canada, and Mexico), Europe (Germany, UK, and France), Middle East and Africa (Saudi Arabia, UAE, and South Africa), South America (Brazil and Argentina), and Rest of World (ROW)

Published: Mar 2026 333 Pages SKU: IRTNTR71180

Market Overview at a Glance

$194.06 B
Market Opportunity
5.3%
CAGR 2025 - 2030
61.6%
APAC Growth
$291.34 B
Injection molding segment 2024

Plastic Market Size 2026-2030

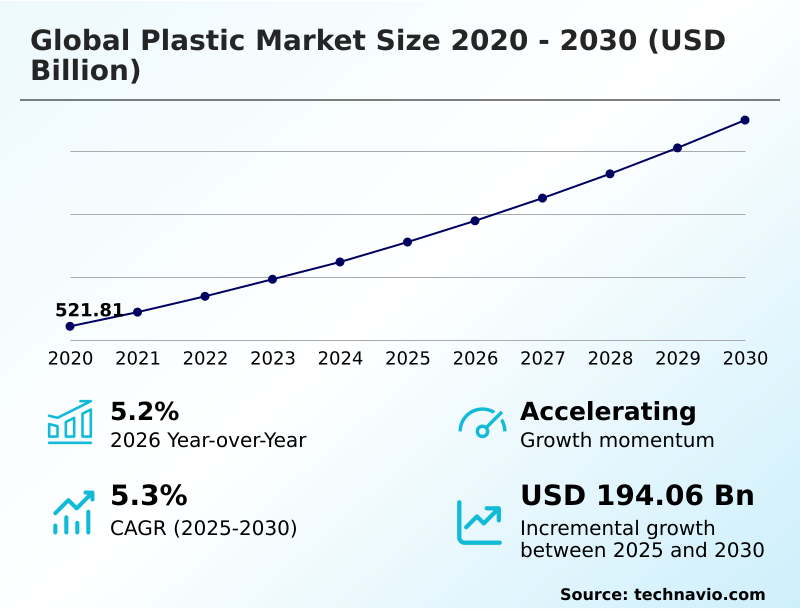
The plastic market size is valued to increase by USD 194.06 billion, at a CAGR of 5.3% from 2025 to 2030. Expansion of flexible and protective packaging demand will drive the plastic market.

Major Market Trends & Insights

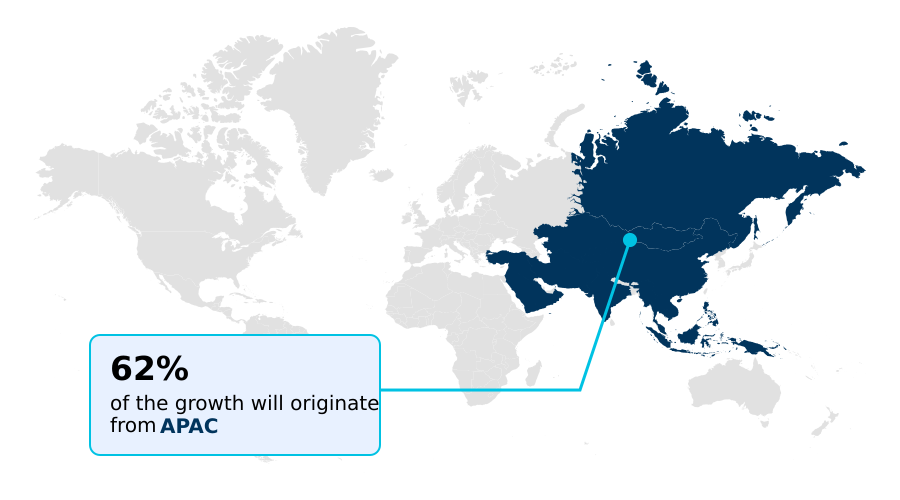
  • APAC dominated the market and accounted for a 61.6% growth during the forecast period.
  • By Technique - Injection molding segment was valued at USD 291.34 billion in 2024
  • By End-user - Packaging segment accounted for the largest market revenue share in 2024

Market Size & Forecast

  • Market Opportunities: USD 328.06 billion
  • Market Future Opportunities: USD 194.06 billion
  • CAGR from 2025 to 2030 : 5.3%

Market Summary

  • The plastic market is defined by its integral role across global manufacturing, with its growth propelled by relentless demand for durable, lightweight, and versatile materials like thermoplastic polymers. Key applications in packaging, automotive, and construction rely on the unique properties of different polymer resin types to achieve cost efficiency and high performance.
  • A significant driver is the expansion of protective packaging, where innovations in polymer processing are crucial for developing high-barrier multilayer films. Concurrently, the industry is navigating a transformative shift towards sustainability. This involves a transition to circular economy models, emphasizing chemical recycling and the adoption of bio-based polymers.
  • A key business scenario involves an automotive OEM integrating advanced polymer composites and engineering plastics for vehicle lightweighting; this strategy not only improves energy efficiency but also forces the OEM to re-evaluate its supply chain to comply with new mandates on post-consumer recycled (pcr) content, impacting both cost structures and material sourcing.
  • This balance between performance and sustainability is a central dynamic, compounded by challenges like petrochemical feedstock volatility and the technical complexities of mechanical recycling for materials such as thermosetting resins.

What will be the Size of the Plastic Market during the forecast period?

Get Key Insights on Market Forecast (PDF) Request Free Sample

How is the Plastic Market Segmented?

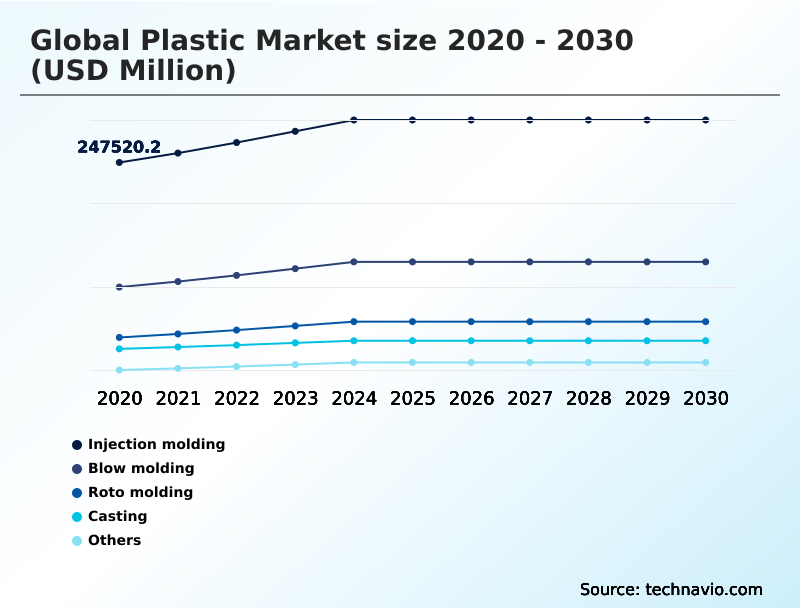
The plastic industry research report provides comprehensive data (region-wise segment analysis), with forecasts and estimates in "USD million" for the period 2026-2030, as well as historical data from 2020-2024 for the following segments.

  • Technique
    • Injection molding
    • Blow molding
    • Roto molding
    • Casting
    • Others
  • End-user
    • Packaging
    • Consumer goods
    • Automotive
    • Electrical and electronics
    • Others
  • Product type
    • Polyethylene
    • Polypropylene
    • Polyurethane
    • Polyvinyl chloride
    • Others
  • Geography
    • APAC
      • China
      • Japan
      • India
    • North America
      • US
      • Canada
      • Mexico
    • Europe
      • Germany
      • UK
      • France
    • Middle East and Africa
      • Saudi Arabia
      • UAE
      • South Africa
    • South America
      • Brazil
      • Argentina
    • Rest of World (ROW)

By Technique Insights

The injection molding segment is estimated to witness significant growth during the forecast period.

Injection molding remains a cornerstone of the global plastic market, valued for its efficiency and precision in high-volume production.

This polymer processing technique involves injecting molten thermoplastic polymers, often mixed with masterbatches to achieve specific colors or properties, into a mold cavity.

The process is ideal for creating complex components with tight tolerances, making it indispensable in automotive and electronics.

Smart production systems and digital manufacturing tools are enhancing this technique, with some operators reporting a 15% reduction in energy consumption through the adoption of energy-efficient manufacturing.

This evolution supports eco-design initiatives, enabling the use of high-performance thermoplastics like polycarbonate (PC) and high-density polyethylene (hdpe) while optimizing the polymer resin use.

Request Free Sample

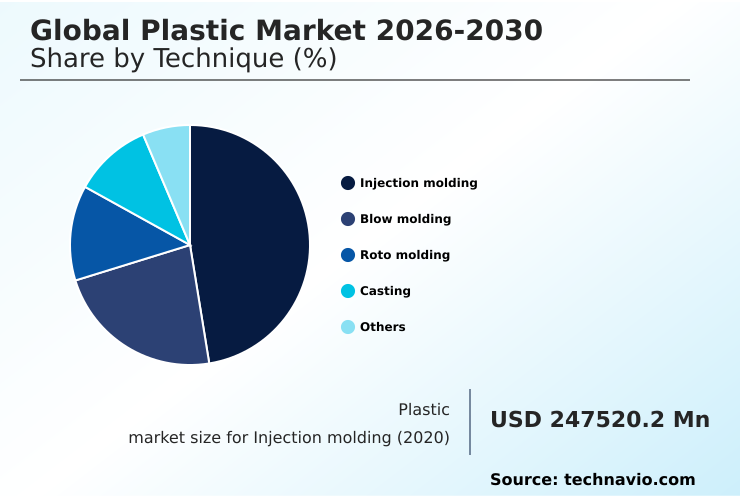
The Injection molding segment was valued at USD 291.34 billion in 2024 and showed a gradual increase during the forecast period.

Request Free Sample

Regional Analysis

APAC is estimated to contribute 61.6% to the growth of the global market during the forecast period.Technavio’s analysts have elaborately explained the regional trends and drivers that shape the market during the forecast period.

See How Plastic Market Demand is Rising in APAC Request Free Sample

The geographic landscape is dominated by the APAC region, which accounts for over 61% of the market's incremental growth, with North America contributing approximately 16%.

This growth is fueled by robust manufacturing sectors demanding materials like acrylonitrile butadiene styrene (abs) for electronics and polyurethane foams for construction. In these regions, the use of engineering plastics in high-value applications is expanding.

Innovations in polymer chemistry are enabling the production of fire-resistant polymers for infrastructure projects. Demand for thermoforming and rotational molding techniques is also rising. The expansion is also seen in specialized areas like medical-grade polymers, where material consistency is paramount.

For example, some advanced facilities have achieved a 5% reduction in material waste through optimized processes, highlighting the focus on efficiency across key geographies.

Market Dynamics

Our researchers analyzed the data with 2025 as the base year, along with the key drivers, trends, and challenges. A holistic analysis of drivers will help companies refine their marketing strategies to gain a competitive advantage.

  • A critical debate in the industry is the comparison of bio-based polymers vs petrochemical plastics, as companies weigh environmental benefits against production costs and performance metrics. This ties into the broader analysis of chemical vs mechanical plastic recycling, where the former offers a path to virgin-quality resin from mixed waste but at a higher energy cost.
  • The impact of feedstock volatility on polymers remains a primary concern for businesses heavily reliant on traditional supply chains, pushing for innovation. In contrast, companies diversifying their portfolios are seeing tangible benefits; for instance, those exploring biodegradable polymers for agricultural use have reported a supply chain risk profile that is nearly 20% more stable than peers dependent solely on petrochemicals.
  • The role of plastic in electric vehicle batteries is a high-growth area, demanding lightweight plastics in automotive applications and advanced polymer composites for aerospace-grade durability. Trends in smart plastic manufacturing are driven by the need for digital tools for polymer process optimization. This is evident in applications like polyethylene for flexible packaging solutions and advancements in rotational molding technology.
  • Key challenges include overcoming hurdles in multilayer plastic recycling and meeting new sustainable plastic packaging regulations.
  • Meanwhile, sectors are finding new value in established materials, such as PVC applications in the construction industry, ABS plastic in consumer electronics, and HDPE applications in industrial containers, while high-performance plastics for medical devices and polyurethane foam for building insulation continue to see specialized growth.

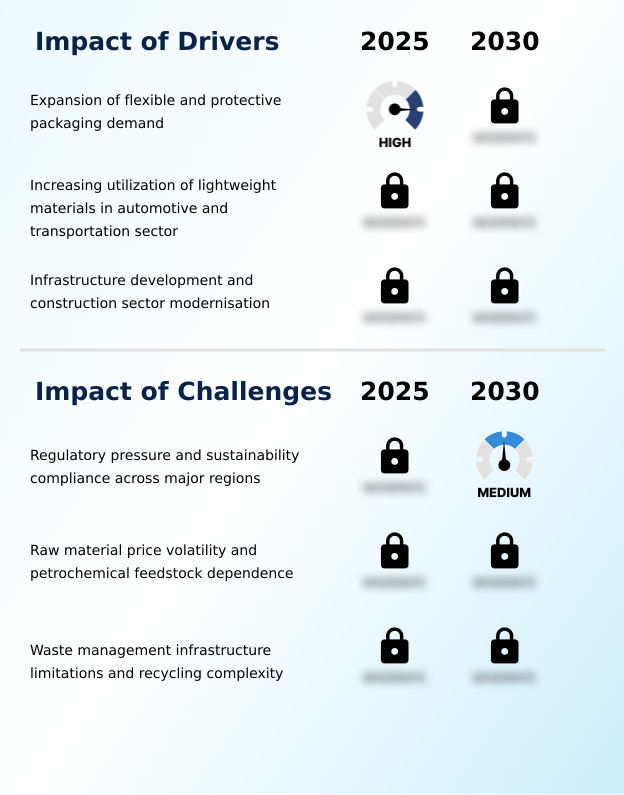
What are the key market drivers leading to the rise in the adoption of Plastic Industry?

  • The expanding demand for flexible and protective packaging solutions across various end-user industries serves as a primary driver for market growth.

  • Key market drivers are rooted in material innovation and expanding end-user applications. Lightweight material engineering is paramount, with vehicle lightweighting strategies leveraging fiber-reinforced polymers to enhance fuel efficiency by as much as 8%.
  • The packaging sector's demand for materials like polypropylene (pp) and polyethylene terephthalate (pet) in food-grade plastic packaging continues to grow.
  • Innovations in extrusion molding and blow molding have led to multilayer films with high barrier performance, extending product shelf life by over 20%. In construction, the use of corrosion-resistant piping and thermal insulation materials, often produced via pultrusion, is expanding.
  • These advancements underscore the material's versatility and its role in improving efficiency and performance across industries.

What are the market trends shaping the Plastic Industry?

  • The market is undergoing an accelerated transition toward a circular economy, driven by the increasing integration of advanced recycling systems to enhance material sustainability.

  • A dominant trend is the accelerated shift toward circular economy models, propelled by innovations in both chemical recycling and mechanical recycling. This transition focuses on developing sustainable polymer materials and advanced recycling technologies to manage waste. Companies integrating post-consumer recycled (pcr) content into their products have noted a 12% improvement in brand perception among environmentally conscious consumers.
  • The development of mono-material packaging, including new elastomers, is crucial for creating recyclable polymer structures. For example, pilot programs using modular recycling facilities have demonstrated the potential to increase the recovery rate of certain plastics by up to 25%. This move is supported by polymer compounding advancements that create high-quality bio-based polymers and biodegradable plastics, reshaping the industry's environmental footprint.

What challenges does the Plastic Industry face during its growth?

  • Intensifying regulatory pressure and the complexities of ensuring sustainability compliance across major global regions present a significant challenge to industry growth.

  • The market faces significant challenges, primarily from raw material price instability and complex regulatory frameworks. Dependence on volatile petrochemical feedstocks can cause production costs to fluctuate by up to 30% within a single quarter, impacting profitability. Stricter extended producer responsibility (epr) regulations and inadequate waste management infrastructure complicate the handling of materials like polyvinyl chloride (pvc) and expanded polystyrene (eps).
  • Even with advanced material recovery facilities, the presence of certain plastic additives in thermosetting resins makes recycling difficult. Establishing closed-loop production models requires enhanced raw material traceability and supply chain resilience, yet achieving this at scale remains a hurdle, with current systems capturing less than 15% of complex post-consumer plastics for high-value recycling.

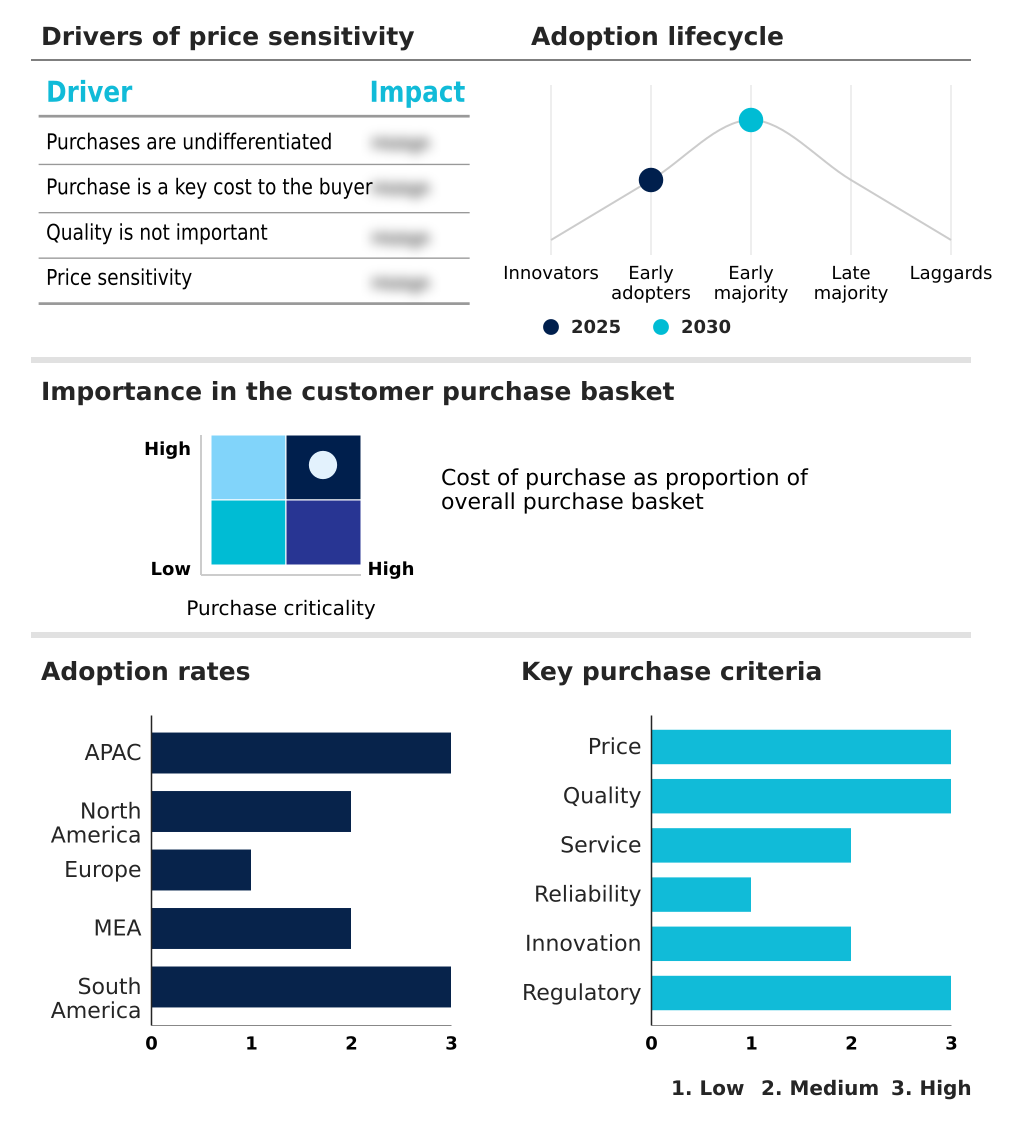
Exclusive Technavio Analysis on Customer Landscape

The plastic market forecasting report includes the adoption lifecycle of the market, covering from the innovator’s stage to the laggard’s stage. It focuses on adoption rates in different regions based on penetration. Furthermore, the plastic market report also includes key purchase criteria and drivers of price sensitivity to help companies evaluate and develop their market growth analysis strategies.

Customer Landscape of Plastic Industry

Competitive Landscape

Companies are implementing various strategies, such as strategic alliances, plastic market forecast, partnerships, mergers and acquisitions, geographical expansion, and product/service launches, to enhance their presence in the industry.

BASF SE - A focused portfolio of engineering plastics and polyurethane materials provides advanced polymer solutions for critical industrial applications.

The industry research and growth report includes detailed analyses of the competitive landscape of the market and information about key companies, including:

  • BASF SE
  • Borealis AG
  • Celanese Corp.
  • China Petrochemical Corp.
  • Covestro AG
  • Dow Chemical Co.
  • DuPont de Nemours Inc.
  • Eastman Chemical Co.
  • Envalior GmbH
  • ExxonMobil Chemical Co.
  • Formosa Plastics Corp.
  • INEOS Group Holdings S.A.
  • Lotte Chemical Corp.
  • LyondellBasell Industries NV
  • Saudi Basic Industries
  • Sumitomo Chemical Co. Ltd.
  • Toray Plastics Inc.
  • TotalEnergies SE
  • Trinseo PLC
  • Versalis S.p.A

Qualitative and quantitative analysis of companies has been conducted to help clients understand the wider business environment as well as the strengths and weaknesses of key industry players. Data is qualitatively analyzed to categorize companies as pure play, category-focused, industry-focused, and diversified; it is quantitatively analyzed to categorize companies as dominant, leading, strong, tentative, and weak.

Recent Development and News in Plastic market

  • In August 2025, LyondellBasell announced progress on commissioning its advanced chemical recycling facility in Wesseling, Germany, designed to process mixed plastic waste into new polymer feedstock.
  • In April 2025, Amcor introduced mono-material flexible pouches under its Liquiflex AmPrima product line in Europe, designed to be more compatible with polyethylene recycling streams.
  • In March 2025, Lotte Chemical announced the Lotte Chemical Indonesia New Ethylene (LINE) Project in Cilegon, a major petrochemical expansion to increase regional polymer production capacity.
  • In February 2025, Hyundai Motor Group announced a strategic materials partnership with Kolon Group to develop advanced polymer composite materials for next-generation electric vehicles.

Dive into Technavio’s robust research methodology, blending expert interviews, extensive data synthesis, and validated models for unparalleled Plastic Market insights. See full methodology.

Market Scope
Page number 333
Base year 2025
Historic period 2020-2024
Forecast period 2026-2030
Growth momentum & CAGR Accelerate at a CAGR of 5.3%
Market growth 2026-2030 USD 194057.3 million
Market structure Fragmented
YoY growth 2025-2026(%) 5.2%
Key countries China, Japan, India, South Korea, Australia, Indonesia, US, Canada, Mexico, Germany, UK, France, Italy, Spain, The Netherlands, Saudi Arabia, UAE, South Africa, Israel, Egypt, Brazil, Argentina and Chile
Competitive landscape Leading Companies, Market Positioning of Companies, Competitive Strategies, and Industry Risks

Request Free Sample

Research Analyst Overview

  • The plastic market's evolution is defined by a fundamental tension between performance and sustainability. While materials like polyethylene terephthalate (pet) and polypropylene (pp) remain ubiquitous, the focus is shifting to advanced polymer processing and polymer compounding. This is evident in the development of sophisticated multilayer films and fiber-reinforced polymers.
  • A major boardroom consideration is the transition to a circular model, driven by the dual pressures of regulation and consumer sentiment. This strategic pivot involves substantial investment in chemical recycling and mechanical recycling infrastructure to process materials from polyvinyl chloride (pvc) to expanded polystyrene (eps).
  • Companies are increasingly utilizing bio-based polymers and biodegradable plastics to mitigate dependence on volatile petrochemical feedstocks. For instance, firms integrating advanced polymer resin with high-recycled content have documented a 10% improvement in compliance with new sustainability mandates.
  • The industry is also seeing innovation in manufacturing techniques, including injection molding, blow molding, and extrusion molding, alongside specialized methods like pultrusion and thermoforming to create everything from elastomers to complex engineering plastics.

What are the Key Data Covered in this Plastic Market Research and Growth Report?

  • What is the expected growth of the Plastic Market between 2026 and 2030?

    • USD 194.06 billion, at a CAGR of 5.3%

  • What segmentation does the market report cover?

    • The report is segmented by Technique (Injection molding, Blow molding, Roto molding, Casting, and Others), End-user (Packaging, Consumer goods, Automotive, Electrical and electronics, and Others), Product Type (Polyethylene, Polypropylene, Polyurethane, Polyvinyl chloride, and Others) and Geography (APAC, North America, Europe, Middle East and Africa, South America)

  • Which regions are analyzed in the report?

    • APAC, North America, Europe, Middle East and Africa and South America

  • What are the key growth drivers and market challenges?

    • Expansion of flexible and protective packaging demand, Regulatory pressure and sustainability compliance across major regions

  • Who are the major players in the Plastic Market?

    • BASF SE, Borealis AG, Celanese Corp., China Petrochemical Corp., Covestro AG, Dow Chemical Co., DuPont de Nemours Inc., Eastman Chemical Co., Envalior GmbH, ExxonMobil Chemical Co., Formosa Plastics Corp., INEOS Group Holdings S.A., Lotte Chemical Corp., LyondellBasell Industries NV, Saudi Basic Industries, Sumitomo Chemical Co. Ltd., Toray Plastics Inc., TotalEnergies SE, Trinseo PLC and Versalis S.p.A

Market Research Insights

  • Market dynamics are increasingly shaped by the push for sustainable polymer materials and advanced recycling technologies. The adoption of circular economy models is not just a compliance measure; it's a strategic shift, with early adopters reporting up to a 15% reduction in raw material costs by integrating post-consumer recycled (pcr) content.
  • Furthermore, the use of digital manufacturing tools in smart production systems has enabled a 10% improvement in product consistency. These eco-design initiatives are critical as industries from food-grade plastic packaging to medical-grade polymers demand greater supply chain resilience and raw material traceability.
  • As closed-loop production models become more prevalent, the ability to innovate with recyclable polymer structures will define competitive advantage.

We can help! Our analysts can customize this plastic market research report to meet your requirements.

Get in touch

1. Executive Summary

1.1 Market overview

Executive Summary - Chart on Market Overview
Executive Summary - Data Table on Market Overview
Executive Summary - Chart on Global Market Characteristics
Executive Summary - Chart on Market by Geography
Executive Summary - Chart on Market Segmentation by Technique
Executive Summary - Chart on Market Segmentation by End-user
Executive Summary - Chart on Market Segmentation by Product Type
Executive Summary - Chart on Incremental Growth
Executive Summary - Data Table on Incremental Growth
Executive Summary - Chart on Company Market Positioning

2. Technavio Analysis

2.1 Analysis of price sensitivity, lifecycle, customer purchase basket, adoption rates, and purchase criteria

2.2 Criticality of inputs and Factors of differentiation

Chart on Overview on criticality of inputs and factors of differentiation

2.3 Factors of disruption

Chart on Overview on factors of disruption

2.4 Impact of drivers and challenges

Chart on Impact of drivers and challenges in 2025 and 2030

3. Market Landscape

3.1 Market ecosystem

Chart on Parent Market
Data Table on - Parent Market

3.2 Market characteristics

Chart on Market characteristics analysis

3.3 Value chain analysis

Chart on Value chain analysis

4. Market Sizing

4.1 Market definition

Data Table on Offerings of companies included in the market definition

4.2 Market segment analysis

Market segments

4.3 Market size 2025

4.4 Market outlook: Forecast for 2025-2030

Chart on Global - Market size and forecast 2025-2030 ($ million)
Data Table on Global - Market size and forecast 2025-2030 ($ million)
Chart on Global Market: Year-over-year growth 2025-2030 (%)
Data Table on Global Market: Year-over-year growth 2025-2030 (%)

5. Historic Market Size

5.1 Global Plastic Market 2020 - 2024

Historic Market Size - Data Table on Global Plastic Market 2020 - 2024 ($ million)

5.2 Technique segment analysis 2020 - 2024

Historic Market Size - Technique Segment 2020 - 2024 ($ million)

5.3 End-user segment analysis 2020 - 2024

Historic Market Size - End-user Segment 2020 - 2024 ($ million)

5.4 Product Type segment analysis 2020 - 2024

Historic Market Size - Product Type Segment 2020 - 2024 ($ million)

5.5 Geography segment analysis 2020 - 2024

Historic Market Size - Geography Segment 2020 - 2024 ($ million)

5.6 Country segment analysis 2020 - 2024

Historic Market Size - Country Segment 2020 - 2024 ($ million)

6. Qualitative Analysis

6.1 Impact of AI on Global Plastic Market

6.2 Impact of Geopolitical Conflict for Global Plastic Market

7. Five Forces Analysis

7.1 Five forces summary

Five forces analysis - Comparison between 2025 and 2030

7.2 Bargaining power of buyers

Bargaining power of buyers - Impact of key factors 2025 and 2030

7.3 Bargaining power of suppliers

Bargaining power of suppliers - Impact of key factors in 2025 and 2030

7.4 Threat of new entrants

Threat of new entrants - Impact of key factors in 2025 and 2030

7.5 Threat of substitutes

Threat of substitutes - Impact of key factors in 2025 and 2030

7.6 Threat of rivalry

Threat of rivalry - Impact of key factors in 2025 and 2030

7.7 Market condition

Chart on Market condition - Five forces 2025 and 2030

8. Market Segmentation by Technique

8.1 Market segments

Chart on Technique - Market share 2025-2030 (%)
Data Table on Technique - Market share 2025-2030 (%)

8.2 Comparison by Technique

Chart on Comparison by Technique
Data Table on Comparison by Technique

8.3 Injection molding - Market size and forecast 2025-2030

Chart on Injection molding - Market size and forecast 2025-2030 ($ million)
Data Table on Injection molding - Market size and forecast 2025-2030 ($ million)
Chart on Injection molding - Year-over-year growth 2025-2030 (%)
Data Table on Injection molding - Year-over-year growth 2025-2030 (%)

8.4 Blow molding - Market size and forecast 2025-2030

Chart on Blow molding - Market size and forecast 2025-2030 ($ million)
Data Table on Blow molding - Market size and forecast 2025-2030 ($ million)
Chart on Blow molding - Year-over-year growth 2025-2030 (%)
Data Table on Blow molding - Year-over-year growth 2025-2030 (%)

8.5 Roto molding - Market size and forecast 2025-2030

Chart on Roto molding - Market size and forecast 2025-2030 ($ million)
Data Table on Roto molding - Market size and forecast 2025-2030 ($ million)
Chart on Roto molding - Year-over-year growth 2025-2030 (%)
Data Table on Roto molding - Year-over-year growth 2025-2030 (%)

8.6 Casting - Market size and forecast 2025-2030

Chart on Casting - Market size and forecast 2025-2030 ($ million)
Data Table on Casting - Market size and forecast 2025-2030 ($ million)
Chart on Casting - Year-over-year growth 2025-2030 (%)
Data Table on Casting - Year-over-year growth 2025-2030 (%)

8.7 Others - Market size and forecast 2025-2030

Chart on Others - Market size and forecast 2025-2030 ($ million)
Data Table on Others - Market size and forecast 2025-2030 ($ million)
Chart on Others - Year-over-year growth 2025-2030 (%)
Data Table on Others - Year-over-year growth 2025-2030 (%)

8.8 Market opportunity by Technique

Market opportunity by Technique ($ million)
Data Table on Market opportunity by Technique ($ million)

9. Market Segmentation by End-user

9.1 Market segments

Chart on End-user - Market share 2025-2030 (%)
Data Table on End-user - Market share 2025-2030 (%)

9.2 Comparison by End-user

Chart on Comparison by End-user
Data Table on Comparison by End-user

9.3 Packaging - Market size and forecast 2025-2030

Chart on Packaging - Market size and forecast 2025-2030 ($ million)
Data Table on Packaging - Market size and forecast 2025-2030 ($ million)
Chart on Packaging - Year-over-year growth 2025-2030 (%)
Data Table on Packaging - Year-over-year growth 2025-2030 (%)

9.4 Consumer goods - Market size and forecast 2025-2030

Chart on Consumer goods - Market size and forecast 2025-2030 ($ million)
Data Table on Consumer goods - Market size and forecast 2025-2030 ($ million)
Chart on Consumer goods - Year-over-year growth 2025-2030 (%)
Data Table on Consumer goods - Year-over-year growth 2025-2030 (%)

9.5 Automotive - Market size and forecast 2025-2030

Chart on Automotive - Market size and forecast 2025-2030 ($ million)
Data Table on Automotive - Market size and forecast 2025-2030 ($ million)
Chart on Automotive - Year-over-year growth 2025-2030 (%)
Data Table on Automotive - Year-over-year growth 2025-2030 (%)

9.6 Electrical and electronics - Market size and forecast 2025-2030

Chart on Electrical and electronics - Market size and forecast 2025-2030 ($ million)
Data Table on Electrical and electronics - Market size and forecast 2025-2030 ($ million)
Chart on Electrical and electronics - Year-over-year growth 2025-2030 (%)
Data Table on Electrical and electronics - Year-over-year growth 2025-2030 (%)

9.7 Others - Market size and forecast 2025-2030

Chart on Others - Market size and forecast 2025-2030 ($ million)
Data Table on Others - Market size and forecast 2025-2030 ($ million)
Chart on Others - Year-over-year growth 2025-2030 (%)
Data Table on Others - Year-over-year growth 2025-2030 (%)

9.8 Market opportunity by End-user

Market opportunity by End-user ($ million)
Data Table on Market opportunity by End-user ($ million)

10. Market Segmentation by Product Type

10.1 Market segments

Chart on Product Type - Market share 2025-2030 (%)
Data Table on Product Type - Market share 2025-2030 (%)

10.2 Comparison by Product Type

Chart on Comparison by Product Type
Data Table on Comparison by Product Type

10.3 Polyethylene - Market size and forecast 2025-2030

Chart on Polyethylene - Market size and forecast 2025-2030 ($ million)
Data Table on Polyethylene - Market size and forecast 2025-2030 ($ million)
Chart on Polyethylene - Year-over-year growth 2025-2030 (%)
Data Table on Polyethylene - Year-over-year growth 2025-2030 (%)

10.4 Polypropylene - Market size and forecast 2025-2030

Chart on Polypropylene - Market size and forecast 2025-2030 ($ million)
Data Table on Polypropylene - Market size and forecast 2025-2030 ($ million)
Chart on Polypropylene - Year-over-year growth 2025-2030 (%)
Data Table on Polypropylene - Year-over-year growth 2025-2030 (%)

10.5 Polyurethane - Market size and forecast 2025-2030

Chart on Polyurethane - Market size and forecast 2025-2030 ($ million)
Data Table on Polyurethane - Market size and forecast 2025-2030 ($ million)
Chart on Polyurethane - Year-over-year growth 2025-2030 (%)
Data Table on Polyurethane - Year-over-year growth 2025-2030 (%)

10.6 Polyvinyl chloride - Market size and forecast 2025-2030

Chart on Polyvinyl chloride - Market size and forecast 2025-2030 ($ million)
Data Table on Polyvinyl chloride - Market size and forecast 2025-2030 ($ million)
Chart on Polyvinyl chloride - Year-over-year growth 2025-2030 (%)
Data Table on Polyvinyl chloride - Year-over-year growth 2025-2030 (%)

10.7 Others - Market size and forecast 2025-2030

Chart on Others - Market size and forecast 2025-2030 ($ million)
Data Table on Others - Market size and forecast 2025-2030 ($ million)
Chart on Others - Year-over-year growth 2025-2030 (%)
Data Table on Others - Year-over-year growth 2025-2030 (%)

10.8 Market opportunity by Product Type

Market opportunity by Product Type ($ million)
Data Table on Market opportunity by Product Type ($ million)

11. Customer Landscape

11.1 Customer landscape overview

Analysis of price sensitivity, lifecycle, customer purchase basket, adoption rates, and purchase criteria

12. Geographic Landscape

12.1 Geographic segmentation

Chart on Market share by geography 2025-2030 (%)
Data Table on Market share by geography 2025-2030 (%)

12.2 Geographic comparison

Chart on Geographic comparison
Data Table on Geographic comparison

12.3 APAC - Market size and forecast 2025-2030

Chart on APAC - Market size and forecast 2025-2030 ($ million)
Data Table on APAC - Market size and forecast 2025-2030 ($ million)
Chart on APAC - Year-over-year growth 2025-2030 (%)
Data Table on APAC - Year-over-year growth 2025-2030 (%)
Chart on Regional Comparison - APAC
Data Table on Regional Comparison - APAC

12.3.1 China - Market size and forecast 2025-2030

Chart on China - Market size and forecast 2025-2030 ($ million)
Data Table on China - Market size and forecast 2025-2030 ($ million)
Chart on China - Year-over-year growth 2025-2030 (%)
Data Table on China - Year-over-year growth 2025-2030 (%)

12.3.2 Japan - Market size and forecast 2025-2030

Chart on Japan - Market size and forecast 2025-2030 ($ million)
Data Table on Japan - Market size and forecast 2025-2030 ($ million)
Chart on Japan - Year-over-year growth 2025-2030 (%)
Data Table on Japan - Year-over-year growth 2025-2030 (%)

12.3.3 India - Market size and forecast 2025-2030

Chart on India - Market size and forecast 2025-2030 ($ million)
Data Table on India - Market size and forecast 2025-2030 ($ million)
Chart on India - Year-over-year growth 2025-2030 (%)
Data Table on India - Year-over-year growth 2025-2030 (%)

12.3.4 South Korea - Market size and forecast 2025-2030

Chart on South Korea - Market size and forecast 2025-2030 ($ million)
Data Table on South Korea - Market size and forecast 2025-2030 ($ million)
Chart on South Korea - Year-over-year growth 2025-2030 (%)
Data Table on South Korea - Year-over-year growth 2025-2030 (%)

12.3.5 Australia - Market size and forecast 2025-2030

Chart on Australia - Market size and forecast 2025-2030 ($ million)
Data Table on Australia - Market size and forecast 2025-2030 ($ million)
Chart on Australia - Year-over-year growth 2025-2030 (%)
Data Table on Australia - Year-over-year growth 2025-2030 (%)

12.3.6 Indonesia - Market size and forecast 2025-2030

Chart on Indonesia - Market size and forecast 2025-2030 ($ million)
Data Table on Indonesia - Market size and forecast 2025-2030 ($ million)
Chart on Indonesia - Year-over-year growth 2025-2030 (%)
Data Table on Indonesia - Year-over-year growth 2025-2030 (%)

12.4 North America - Market size and forecast 2025-2030

Chart on North America - Market size and forecast 2025-2030 ($ million)
Data Table on North America - Market size and forecast 2025-2030 ($ million)
Chart on North America - Year-over-year growth 2025-2030 (%)
Data Table on North America - Year-over-year growth 2025-2030 (%)
Chart on Regional Comparison - North America
Data Table on Regional Comparison - North America

12.4.1 US - Market size and forecast 2025-2030

Chart on US - Market size and forecast 2025-2030 ($ million)
Data Table on US - Market size and forecast 2025-2030 ($ million)
Chart on US - Year-over-year growth 2025-2030 (%)
Data Table on US - Year-over-year growth 2025-2030 (%)

12.4.2 Canada - Market size and forecast 2025-2030

Chart on Canada - Market size and forecast 2025-2030 ($ million)
Data Table on Canada - Market size and forecast 2025-2030 ($ million)
Chart on Canada - Year-over-year growth 2025-2030 (%)
Data Table on Canada - Year-over-year growth 2025-2030 (%)

12.4.3 Mexico - Market size and forecast 2025-2030

Chart on Mexico - Market size and forecast 2025-2030 ($ million)
Data Table on Mexico - Market size and forecast 2025-2030 ($ million)
Chart on Mexico - Year-over-year growth 2025-2030 (%)
Data Table on Mexico - Year-over-year growth 2025-2030 (%)

12.5 Europe - Market size and forecast 2025-2030

Chart on Europe - Market size and forecast 2025-2030 ($ million)
Data Table on Europe - Market size and forecast 2025-2030 ($ million)
Chart on Europe - Year-over-year growth 2025-2030 (%)
Data Table on Europe - Year-over-year growth 2025-2030 (%)
Chart on Regional Comparison - Europe
Data Table on Regional Comparison - Europe

12.5.1 Germany - Market size and forecast 2025-2030

Chart on Germany - Market size and forecast 2025-2030 ($ million)
Data Table on Germany - Market size and forecast 2025-2030 ($ million)
Chart on Germany - Year-over-year growth 2025-2030 (%)
Data Table on Germany - Year-over-year growth 2025-2030 (%)

12.5.2 UK - Market size and forecast 2025-2030

Chart on UK - Market size and forecast 2025-2030 ($ million)
Data Table on UK - Market size and forecast 2025-2030 ($ million)
Chart on UK - Year-over-year growth 2025-2030 (%)
Data Table on UK - Year-over-year growth 2025-2030 (%)

12.5.3 France - Market size and forecast 2025-2030

Chart on France - Market size and forecast 2025-2030 ($ million)
Data Table on France - Market size and forecast 2025-2030 ($ million)
Chart on France - Year-over-year growth 2025-2030 (%)
Data Table on France - Year-over-year growth 2025-2030 (%)

12.5.4 Italy - Market size and forecast 2025-2030

Chart on Italy - Market size and forecast 2025-2030 ($ million)
Data Table on Italy - Market size and forecast 2025-2030 ($ million)
Chart on Italy - Year-over-year growth 2025-2030 (%)
Data Table on Italy - Year-over-year growth 2025-2030 (%)

12.5.5 Spain - Market size and forecast 2025-2030

Chart on Spain - Market size and forecast 2025-2030 ($ million)
Data Table on Spain - Market size and forecast 2025-2030 ($ million)
Chart on Spain - Year-over-year growth 2025-2030 (%)
Data Table on Spain - Year-over-year growth 2025-2030 (%)

12.5.6 The Netherlands - Market size and forecast 2025-2030

Chart on The Netherlands - Market size and forecast 2025-2030 ($ million)
Data Table on The Netherlands - Market size and forecast 2025-2030 ($ million)
Chart on The Netherlands - Year-over-year growth 2025-2030 (%)
Data Table on The Netherlands - Year-over-year growth 2025-2030 (%)

12.6 Middle East and Africa - Market size and forecast 2025-2030

Chart on Middle East and Africa - Market size and forecast 2025-2030 ($ million)
Data Table on Middle East and Africa - Market size and forecast 2025-2030 ($ million)
Chart on Middle East and Africa - Year-over-year growth 2025-2030 (%)
Data Table on Middle East and Africa - Year-over-year growth 2025-2030 (%)
Chart on Regional Comparison - Middle East and Africa
Data Table on Regional Comparison - Middle East and Africa

12.6.1 Saudi Arabia - Market size and forecast 2025-2030

Chart on Saudi Arabia - Market size and forecast 2025-2030 ($ million)
Data Table on Saudi Arabia - Market size and forecast 2025-2030 ($ million)
Chart on Saudi Arabia - Year-over-year growth 2025-2030 (%)
Data Table on Saudi Arabia - Year-over-year growth 2025-2030 (%)

12.6.2 UAE - Market size and forecast 2025-2030

Chart on UAE - Market size and forecast 2025-2030 ($ million)
Data Table on UAE - Market size and forecast 2025-2030 ($ million)
Chart on UAE - Year-over-year growth 2025-2030 (%)
Data Table on UAE - Year-over-year growth 2025-2030 (%)

12.6.3 South Africa - Market size and forecast 2025-2030

Chart on South Africa - Market size and forecast 2025-2030 ($ million)
Data Table on South Africa - Market size and forecast 2025-2030 ($ million)
Chart on South Africa - Year-over-year growth 2025-2030 (%)
Data Table on South Africa - Year-over-year growth 2025-2030 (%)

12.6.4 Israel - Market size and forecast 2025-2030

Chart on Israel - Market size and forecast 2025-2030 ($ million)
Data Table on Israel - Market size and forecast 2025-2030 ($ million)
Chart on Israel - Year-over-year growth 2025-2030 (%)
Data Table on Israel - Year-over-year growth 2025-2030 (%)

12.6.5 Egypt - Market size and forecast 2025-2030

Chart on Egypt - Market size and forecast 2025-2030 ($ million)
Data Table on Egypt - Market size and forecast 2025-2030 ($ million)
Chart on Egypt - Year-over-year growth 2025-2030 (%)
Data Table on Egypt - Year-over-year growth 2025-2030 (%)

12.7 South America - Market size and forecast 2025-2030

Chart on South America - Market size and forecast 2025-2030 ($ million)
Data Table on South America - Market size and forecast 2025-2030 ($ million)
Chart on South America - Year-over-year growth 2025-2030 (%)
Data Table on South America - Year-over-year growth 2025-2030 (%)
Chart on Regional Comparison - South America
Data Table on Regional Comparison - South America

12.7.1 Brazil - Market size and forecast 2025-2030

Chart on Brazil - Market size and forecast 2025-2030 ($ million)
Data Table on Brazil - Market size and forecast 2025-2030 ($ million)
Chart on Brazil - Year-over-year growth 2025-2030 (%)
Data Table on Brazil - Year-over-year growth 2025-2030 (%)

12.7.2 Argentina - Market size and forecast 2025-2030

Chart on Argentina - Market size and forecast 2025-2030 ($ million)
Data Table on Argentina - Market size and forecast 2025-2030 ($ million)
Chart on Argentina - Year-over-year growth 2025-2030 (%)
Data Table on Argentina - Year-over-year growth 2025-2030 (%)

12.7.3 Chile - Market size and forecast 2025-2030

Chart on Chile - Market size and forecast 2025-2030 ($ million)
Data Table on Chile - Market size and forecast 2025-2030 ($ million)
Chart on Chile - Year-over-year growth 2025-2030 (%)
Data Table on Chile - Year-over-year growth 2025-2030 (%)

12.8 Market opportunity by geography

Market opportunity by geography ($ million)
Data Tables on Market opportunity by geography ($ million)

13. Drivers, Challenges, and Opportunity

13.1 Market drivers

Expansion of flexible and protective packaging demand
Increasing utilization of lightweight materials in automotive and transportation sector
Infrastructure development and construction sector modernisation

13.2 Market challenges

Regulatory pressure and sustainability compliance across major regions
Raw material price volatility and petrochemical feedstock dependence
Waste management infrastructure limitations and recycling complexity

13.3 Impact of drivers and challenges

Impact of drivers and challenges in 2025 and 2030

13.4 Market opportunities

Accelerated transition toward circular plastic economy and advanced recycling systems
Increasing adoption of bio based and sustainable polymer materials
Integration of digital manufacturing and smart production technologies

14. Competitive Landscape

14.1 Overview

14.2

Overview on criticality of inputs and factors of differentiation

14.3 Landscape disruption

Overview on factors of disruption

14.4 Industry risks

Impact of key risks on business

15. Competitive Analysis

15.1 Companies profiled

Companies covered

15.2 Company ranking index

15.3 Market positioning of companies

Matrix on companies position and classification

15.4 BASF SE

BASF SE - Overview
BASF SE - Business segments
BASF SE - Key offerings
BASF SE - Segment focus
SWOT

15.5 Borealis AG

Borealis AG - Overview
Borealis AG - Product / Service
Borealis AG - Key offerings
SWOT

15.6 China Petrochemical Corp.

China Petrochemical Corp. - Overview
China Petrochemical Corp. - Business segments
China Petrochemical Corp. - Key offerings
China Petrochemical Corp. - Segment focus
SWOT

15.7 Covestro AG

Covestro AG - Overview
Covestro AG - Business segments
Covestro AG - Key news
Covestro AG - Key offerings
Covestro AG - Segment focus
SWOT

15.8 Dow Chemical Co.

Dow Chemical Co. - Overview
Dow Chemical Co. - Business segments
Dow Chemical Co. - Key news
Dow Chemical Co. - Key offerings
Dow Chemical Co. - Segment focus
SWOT

15.9 DuPont de Nemours Inc.

DuPont de Nemours Inc. - Overview
DuPont de Nemours Inc. - Business segments
DuPont de Nemours Inc. - Key news
DuPont de Nemours Inc. - Key offerings
DuPont de Nemours Inc. - Segment focus
SWOT

15.10 Eastman Chemical Co.

Eastman Chemical Co. - Overview
Eastman Chemical Co. - Business segments
Eastman Chemical Co. - Key news
Eastman Chemical Co. - Key offerings
Eastman Chemical Co. - Segment focus
SWOT

15.11 Formosa Plastics Corp.

Formosa Plastics Corp. - Overview
Formosa Plastics Corp. - Product / Service
Formosa Plastics Corp. - Key offerings
SWOT

15.12 INEOS Group Holdings S.A.

INEOS Group Holdings S.A. - Overview
INEOS Group Holdings S.A. - Product / Service
INEOS Group Holdings S.A. - Key offerings
SWOT

15.13 LyondellBasell Industries NV

LyondellBasell Industries NV - Overview
LyondellBasell Industries NV - Business segments
LyondellBasell Industries NV - Key news
LyondellBasell Industries NV - Key offerings
LyondellBasell Industries NV - Segment focus
SWOT

15.14 Saudi Basic Industries

Saudi Basic Industries - Overview
Saudi Basic Industries - Business segments
Saudi Basic Industries - Key offerings
Saudi Basic Industries - Segment focus
SWOT

15.15 Sumitomo Chemical Co. Ltd.

Sumitomo Chemical Co. Ltd. - Overview
Sumitomo Chemical Co. Ltd. - Business segments
Sumitomo Chemical Co. Ltd. - Key offerings
Sumitomo Chemical Co. Ltd. - Segment focus
SWOT

15.16 TotalEnergies SE

TotalEnergies SE - Overview
TotalEnergies SE - Business segments
TotalEnergies SE - Key news
TotalEnergies SE - Key offerings
TotalEnergies SE - Segment focus
SWOT

15.17 Trinseo PLC

Trinseo PLC - Overview
Trinseo PLC - Business segments
Trinseo PLC - Key offerings
Trinseo PLC - Segment focus
SWOT

15.18 Versalis S.p.A

Versalis S.p.A - Overview
Versalis S.p.A - Product / Service
Versalis S.p.A - Key offerings
SWOT

16. Appendix

16.1 Scope of the report

Market definition
Objectives
Notes and caveats

16.2 Inclusions and exclusions checklist

Inclusions checklist
Exclusions checklist

16.3 Currency conversion rates for US$

16.4 Research methodology

16.5 Data procurement

Information sources

16.6 Data validation

16.7 Validation techniques employed for market sizing

16.8 Data synthesis

16.9 360 degree market analysis

16.10 List of abbreviations

Research Methodology

Technavio presents a detailed picture of the market by way of study, synthesis, and summation of data from multiple sources. The analysts have presented the various facets of the market with a particular focus on identifying the key industry influencers. The data thus presented is comprehensive, reliable, and the result of extensive research, both primary and secondary.

INFORMATION SOURCES

Primary sources

  • Manufacturers and suppliers
  • Channel partners
  • Industry experts
  • Strategic decision makers

Secondary sources

  • Industry journals and periodicals
  • Government data
  • Financial reports of key industry players
  • Historical data
  • Press releases

DATA ANALYSIS

Data Synthesis

  • Collation of data
  • Estimation of key figures
  • Analysis of derived insights

Data Validation

  • Triangulation with data models
  • Reference against proprietary databases
  • Corroboration with industry experts

REPORT WRITING

Qualitative

  • Market drivers
  • Market challenges
  • Market trends
  • Five forces analysis

Quantitative

  • Market size and forecast
  • Market segmentation
  • Geographical insights
  • Competitive landscape

Interested in this report?

Get your sample now to see our research methodology and insights!

Download Now

Frequently Asked Questions

Plastic market growth will increase by USD 194057.3 million during 2026-2030.

The Plastic market is expected to grow at a CAGR of 5.3% during 2026-2030.

Plastic market is segmented by Technique (Injection molding, Blow molding, Roto molding, Casting, Others) End-user (Packaging, Consumer goods, Automotive, Electrical and electronics, Others) Product type (Polyethylene, Polypropylene, Polyurethane, Polyvinyl chloride, Others)

BASF SE, Borealis AG, Celanese Corp., China Petrochemical Corp., Covestro AG, Dow Chemical Co., DuPont de Nemours Inc., Eastman Chemical Co., Envalior GmbH, ExxonMobil Chemical Co., Formosa Plastics Corp., INEOS Group Holdings S.A., Lotte Chemical Corp., LyondellBasell Industries NV, Saudi Basic Industries, Sumitomo Chemical Co. Ltd., Toray Plastics Inc., TotalEnergies SE, Trinseo PLC, Versalis S.p.A are a few of the key vendors in the Plastic market.

APAC will register the highest growth rate of 61.6% among the other regions. Therefore, the Plastic market in APAC is expected to garner significant business opportunities for the vendors during the forecast period.

China, Japan, India, South Korea, Australia, Indonesia, US, Canada, Mexico, Germany, UK, France, Italy, Spain, The Netherlands, Saudi Arabia, UAE, South Africa, Israel, Egypt, Brazil, Argentina, Chile

  • Expansion of flexible and protective packaging demand is the driving factor this market.

The Plastic market vendors should focus on grabbing business opportunities from the Technique segment as it accounted for the largest market share in the base year.
RIA - Research AI Assistant
Ask RIA