Baby Toiletries Market Size 2025-2029
The baby toiletries market size is forecast to increase by USD 8.59 billion at a CAGR of 6.3% between 2024 and 2029.
- The market is experiencing significant growth, driven by key trends such as product portfolio extension and innovation leading to product premiumization. Manufacturers are responding to consumer demand for high-quality, multipurpose baby toiletry products, which offer convenience and value. However, the market also faces challenges, including the prevalence of bathroom counterfeit products. These fake items not only undermine brand reputation but also pose a risk to consumer safety. As the market continues to evolve, companies must prioritize product innovation, quality, and consumer safety to stay competitive. By addressing these trends and challenges, the market is poised for continued growth in the coming years.
What will be the Size of the Market During the Forecast Period?

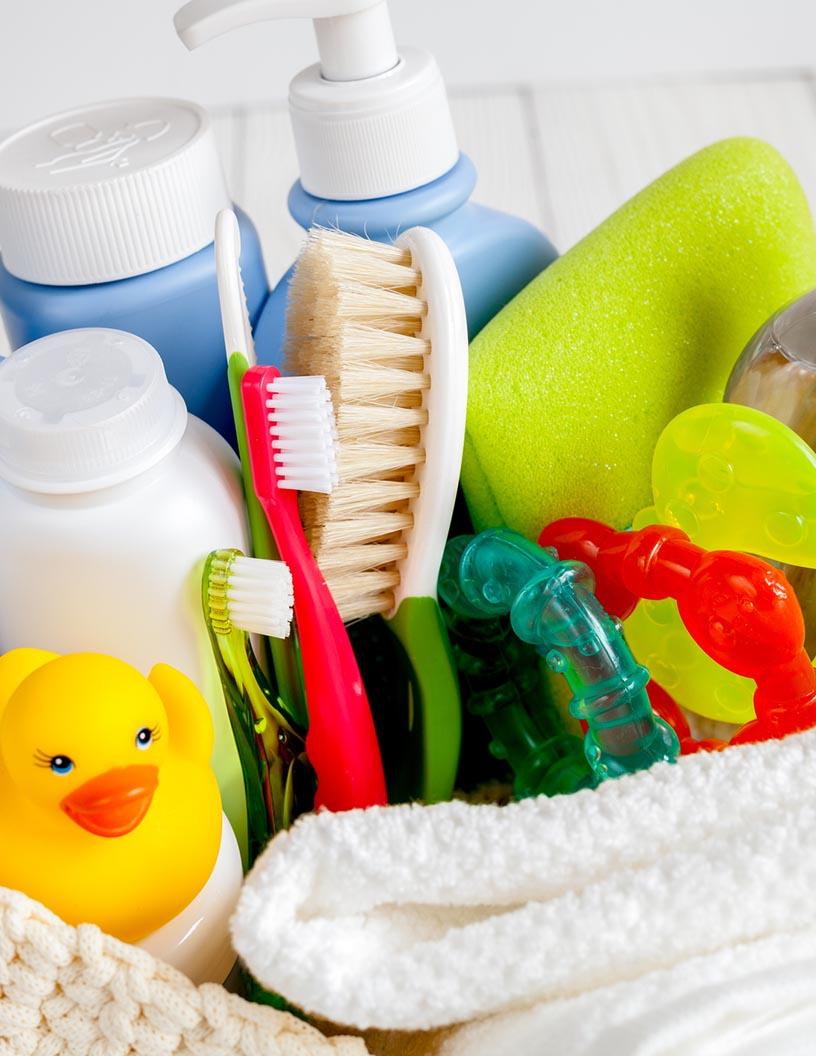
- The market encompasses a wide range of clean and natural products designed to maintain the hygiene and well-being of infants. These products include moisturizing body washes, baby hair oils, diaper rash creams, baby massage oils, and organic baby shampoos. Parents increasingly prefer natural and organic ingredients for their babies, eschewing harsh chemicals such as benzethonium chloride, phthalates, and formaldehyde, which have been linked to skin allergies and other health concerns. E-commerce and online websites have revolutionized the market, making it more accessible to consumers. Parents can now easily purchase these essential items from the comfort of their homes. The rise of vegan beauty brands in the market further caters to the growing demand for clean and ethical products.
- The baby hygiene sector is driven by several factors, including the birth rate, increasing awareness of health and well-being, and the growing preference for natural and organic products. Packaging solutions that prioritize sustainability and eco-friendliness are also gaining popularity. Herbal products, in particular, have gained traction due to their natural and gentle properties. Despite the growing demand for natural and organic baby toiletries, there are still concerns regarding the use of certain chemicals in these products. Parents must remain vigilant and read labels carefully to ensure they are purchasing products that align with their values and prioritize their baby's health.
How is this market segmented and which is the largest segment?
The market research report provides comprehensive data (region-wise segment analysis), with forecasts and estimates in "USD billion" for the period 2025-2029, as well as historical data from 2019-2023 for the following segments.
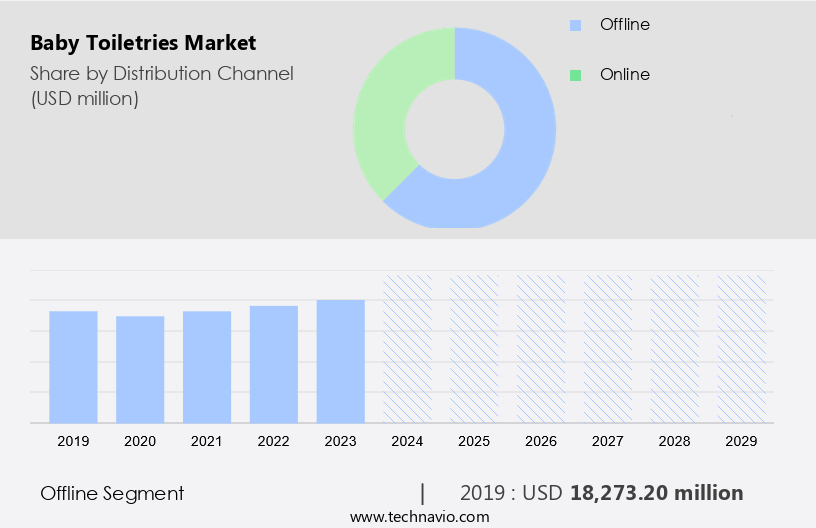
- Distribution Channel
- Offline
- Online
- Geography
- Europe
- Germany
- UK
- France
- Italy
- North America
- Canada
- US
- APAC
- China
- India
- Japan
- South Korea
- South America
- Middle East and Africa
- Europe
By Distribution Channel Insights
- The offline segment is estimated to witness significant growth during the forecast period.
The market encompasses the sale of diapers, skincare products, and wipes for infants and toddlers. Offline distribution channels, including specialty stores, hypermarkets, supermarkets, and drugstores, account for a significant portion of revenue. However, the shift towards online shopping has led to a gradual decline in offline sales. In response, companies are expanding their retail presence in local and regional markets. The market is competitive, with retailers introducing innovative strategies to sustain growth. Baby toiletries include diapers, water wipes, protective skincare products, baby oils, and lotions. Vegan beauty brands are gaining popularity, leading to an increase in demand for natural and synthetic chemical-free skincare products.
Get a glance at the market report of share of various segments Request Free Sample
The offline segment was valued at USD 18.27 billion in 2019 and showed a gradual increase during the forecast period.
Regional Analysis
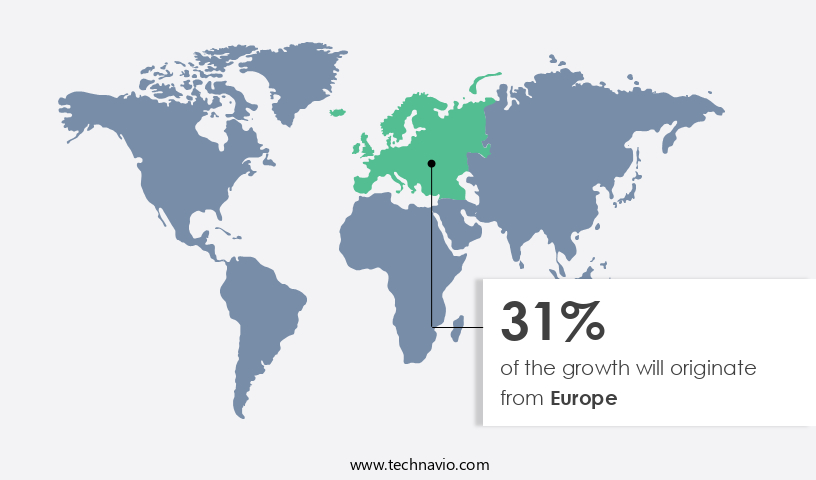
- Europe is estimated to contribute 31% to the growth of the global market during the forecast period.
Technavio's analysts have elaborately explained the regional trends and drivers that shape the market during the forecast period.
For more insights on the market share of various regions Request Free Sample
The market is projected to expand at a consistent pace over the forecast period. Major contributors to this market growth are the increasing standard of living, the introduction of innovative products, and the strong brand value of premium baby toiletries. Germany and the UK dominate the market in terms of value share. companies cater to diverse consumer preferences by offering a range of variants and price points. In Europe, the demand for natural and organic baby toiletries is on the rise due to health concerns and consumer awareness. Herbal products and packaging solutions that prioritize sustainability are also gaining popularity.
Market Dynamics
Our researchers analyzed the data with 2024 as the base year, along with the key drivers, trends, and challenges. A holistic analysis of drivers will help companies refine their marketing strategies to gain a competitive advantage.
What are the key market drivers leading to the rise in the adoption of the market?
Product portfolio extension and innovation leading to product premiumization is the key driver of the market.
- The market is witnessing significant growth due to increasing health consciousness among parents and the rising birth rate. Parents prioritize the use of clean and natural products for their infants, leading companies to focus on organic ingredients and herbal formulations. This trend is reflected in the increasing availability of moisturizing body washes, baby hair oils, diaper rash creams, massage oils, lotions, and moisturizers made from organic and natural ingredients. E-commerce platforms and online websites have made it convenient for parents to purchase these products from the comfort of their homes. Vegan beauty brands are also gaining popularity due to their commitment to using synthetic chemical-free formulations.
- However, there are concerns regarding the use of harmful chemicals such as Benzethonium chloride, Phthalates, and Formaldehyde in some baby skincare products. These chemicals have been linked to skin allergies, asthma, and chronic diseases. To address these concerns, companies are focusing on protective skincare products, such as WaterWipes, which are free from harmful chemicals. Baby oils and lotions are also essential for maintaining the delicate skin of infants. Baby hygiene products, including diapers, shampoo, and wipes, are in high demand.
- Retail outlets and e-commerce websites offer various packaging solutions to cater to the diverse needs of parents. As hygiene awareness continues to grow, diaper banks and other organizations are working to ensure that all infants have access to essential baby care products. Parents are increasingly seeking out natural and organic baby care products to promote their infants' health and well-being. companies are responding to these trends by innovating and expanding their product lines to meet the evolving needs of parents.
What are the market trends shaping the market?
Increased offering of multipurpose baby toiletry products is the upcoming trend in the market.
- The market is witnessing significant growth due to increasing hygiene awareness among parents and the rise in the birth rate. companies are responding to this trend by introducing clean and natural product offerings, including moisturizing body washes, baby hair oils, diaper rash creams, massage oils, lotions, and moisturizers. Organic ingredients, herbal products, and vegan beauty brands are gaining popularity as parents prioritize the health and well-being of their infants. E-commerce platforms and online websites have made it convenient for parents to access these products, leading to an increase in sales. However, concerns regarding synthetic chemicals, such as benzethonium chloride, phthalates, and formaldehyde, in baby skincare products have led to a demand for protective skincare products.
- Brands are addressing this concern by offering organic baby care lines and using packaging solutions that are eco-friendly and free from harmful chemicals. Diapers, baby shampoo, baby wipes, and bath products continue to be in high demand, with diaper banks providing essential supplies to newborns and infants in need. Parents with delicate skin infants or children with chronic diseases, such as skin allergies and asthma, are particularly interested in gentle and hypoallergenic options. Overall, the market is expected to continue growing as parents prioritize the health and well-being of their children.
What challenges does the market face during its growth?
The high availability of counterfeit products is a key challenge affecting the market growth.
- The market is experiencing significant growth due to increasing health and well-being consciousness among parents. This sector includes various products such as moisturizing body washes, baby hair oils, diaper rash creams, baby massage oils, and organic baby care items. The demand for clean and natural products, free from synthetic chemicals like benzethonium chloride, phthalates, and formaldehyde, is on the rise. Parents are increasingly seeking organic ingredients, herbal products, and vegan beauty brands for their infants' skincare needs. E-commerce platforms and online websites have made it easier for parents to access these products, even from the comfort of their homes.
- However, this convenience comes with challenges, as counterfeit products pose a significant threat to the market. These products, often made with harmful chemicals, can lead to skin allergies, asthma, and chronic diseases in infants. Distinguishing between genuine and counterfeit products can be difficult for consumers, leading to market fragmentation and a lack of price standardization. This, in turn, reduces the margins of branded players and erodes brand equity. The market is expected to continue growing, driven by the birth rate and increasing hygiene awareness. However, efforts are needed to ensure the safety and authenticity of these products.
Exclusive Customer Landscape
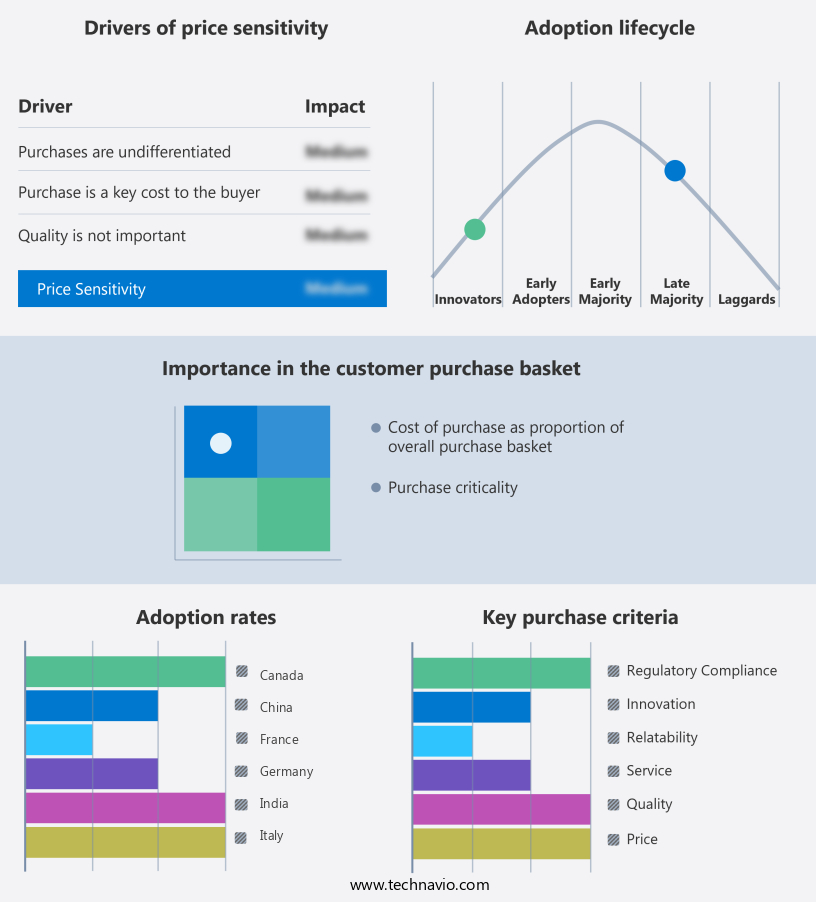
The market forecasting report includes the adoption lifecycle of the market, covering from the innovator's stage to the laggard's stage. It focuses on adoption rates in different regions based on penetration. Furthermore, the market report also includes key purchase criteria and drivers of price sensitivity to help companies evaluate and develop their market growth analysis strategies.
Customer Landscape
Key Companies & Market Insights
Companies are implementing various strategies, such as strategic alliances, market forecast, partnerships, mergers and acquisitions, geographical expansion, and product/service launches, to enhance their presence in the market.
The market research and growth report includes detailed analyses of the competitive landscape of the market and information about key companies, including:
- Artsana Spa
- Babisil Products Co. Ltd.
- California Baby
- Colgate Palmolive Co.
- Domtar Corp.
- Erbaviva LLC
- Farlin Corp.
- First Quality Enterprises Inc.
- Hengan International Group Co. Ltd.
- Himalaya Global Holdings Ltd.
- Johnson and Johnson Inc.
- Kao Corp.
- Kimberly Clark Corp.
- Mothercare Plc
- Naterra International Inc.
- Pigeon Corp.
- Sebapharma GmbH and Co. KG
- The Procter and Gamble Co.
- Unicharm Corp.
- Unilever PLC
Qualitative and quantitative analysis of companies has been conducted to help clients understand the wider business environment as well as the strengths and weaknesses of key market players. Data is qualitatively analyzed to categorize companies as pure play, category-focused, industry-focused, and diversified; it is quantitatively analyzed to categorize companies as dominant, leading, strong, tentative, and weak.
Research Analyst Overview
The market encompasses a wide range of products designed to maintain the hygiene and well-being of infants and newborns. This market includes cleansing items such as moisturizing body washes, baby hair oils, diaper rash creams, baby massage oils, and lotions, as well as skincare products like baby shampoo and baby wipes. Parents are increasingly conscious of their children's health and well-being, leading to a growing demand for clean, natural, and organic baby toiletries. Natural and organic ingredients, free from synthetic chemicals, are gaining popularity as parents seek to minimize their children's exposure to potentially harmful substances.
E-commerce platforms and online websites have made it easier for parents to access these products, with many offering a wide range of options from vegan beauty brands. The convenience of shopping from the comfort of their own homes has proven particularly appealing during the ongoing pandemic. The market for baby toiletries is driven by several factors, including the increasing birth rate, growing awareness of hygiene, and the rise in chronic diseases related to infant skin care. Parents are becoming more aware of the potential risks associated with harsh chemicals, such as benzethonium chloride, phthalates, and formaldehyde, which are commonly found in some baby wipes and other hygiene care products.
As a result, there is a growing demand for protective skincare products, such as baby oils and lotions, that help maintain the delicate skin of infants. Herbal products are also gaining popularity due to their natural and gentle properties. Packaging solutions are also a crucial aspect of the market. Parents prefer eco-friendly and recyclable packaging, which is not only better for the environment but also aligns with their values as conscious consumers. Despite the growth opportunities, the market faces challenges, including increasing competition and regulatory requirements. Diapers and waterwipes remain the dominant players in the market, making it challenging for new entrants to gain a foothold.
|
Market Scope |
|
|
Report Coverage |
Details |
|
Page number |
172 |
|
Base year |
2024 |
|
Historic period |
2019-2023 |
|
Forecast period |
2025-2029 |
|
Growth momentum & CAGR |
Accelerate at a CAGR of 6.3% |
|
Market Growth 2025-2029 |
USD 8.59 billion |
|
Market structure |
Fragmented |
|
YoY growth 2024-2025(%) |
5.8 |
|
Key countries |
US, Canada, China, Germany, Japan, UK, South Korea, France, Italy, and India |
|
Competitive landscape |
Leading Companies, Market Positioning of Companies, Competitive Strategies, and Industry Risks |
What are the Key Data Covered in this Market Research and Growth Report?
- CAGR of the market during the forecast period
- Detailed information on factors that will drive the market growth and forecasting between 2025 and 2029
- Precise estimation of the size of the market and its contribution of the market in focus to the parent market
- Accurate predictions about upcoming market growth and trends and changes in consumer behaviour
- Growth of the market across Europe, North America, APAC, South America, and Middle East and Africa
- Thorough analysis of the market's competitive landscape and detailed information about companies
- Comprehensive analysis of factors that will challenge the growth of market companies
We can help! Our analysts can customize this market research report to meet your requirements.
 RIA -
RIA - 
