Bicycle Suspension System Market Analysis North America, Europe, APAC, South America, Middle East and Africa - US, China, Germany, UK, France - Size and Forecast 2024-2028

Bicycle Suspension System Market Analysis North America, Europe, APAC, South America, Middle East and Africa - US, China, Germany, UK, France - Size and Forecast 2024-2028

Published: Jul 2024 145 Pages SKU: IRTNTR70480

Market Overview at a Glance

$477.3 Mn
Market Opportunity
4.5%
CAGR
4.23
YoY growth 2023-2024(%)

Bicycle Suspension System Market Size 2024-2028

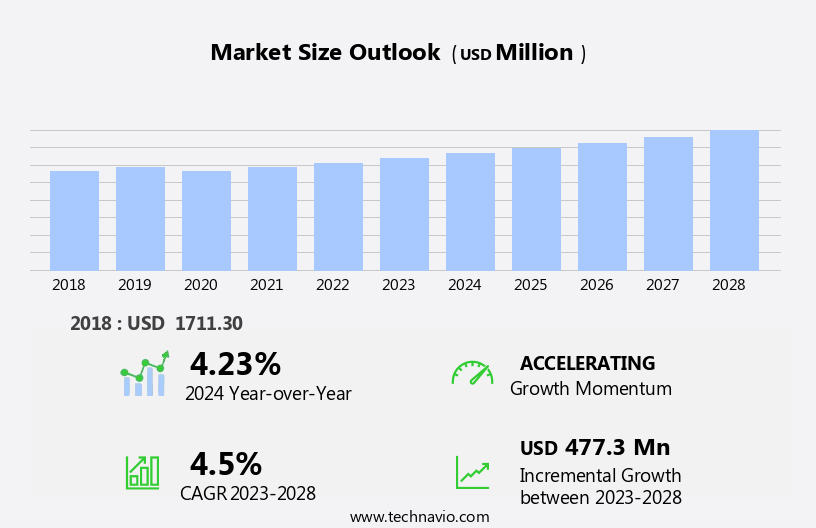
The bicycle suspension system market size is forecast to increase by USD 477.3 million, at a CAGR of 4.5% between 2023 and 2028.

  • The market is experiencing significant growth, driven by the surge in mountain biking tourism, particularly in less populated areas. This trend fosters sustainable development and presents opportunities for market expansion. Simultaneously, technological advancements continue to shape the market, with the development of smart connected helmets integrating Health And Wellness features. However, the increasing weight of bicycles due to these advanced systems poses a challenge for manufacturers and consumers alike, requiring innovative solutions to maintain market competitiveness.
  • Companies must strike a balance between performance and portability to cater to the evolving demands of consumers. Effective navigation of these dynamics and continuous innovation will be crucial for market success.

What will be the Size of the Bicycle Suspension System Market during the forecast period?

Bicycle Suspension System Market Size

Explore in-depth regional segment analysis with market size data - historical 2018-2022 and forecasts 2024-2028 - in the full report.  
Request Free Sample

The suspension system market in the bicycle industry continues to evolve, driven by advancements in technology and the expanding application across various sectors. Suspension elastomers, a key component, play a crucial role in absorbing shock and enhancing ride quality. Linear spring rate is a critical factor in suspension design, influencing the fork offset effect and wheelbase length. Spring rate calculation and wheel travel distance are essential in determining the optimal suspension performance. Frame flex impact and bushings and bearings wear are ongoing concerns, necessitating continuous research and development. Shock mounting position and chain growth effect also influence suspension kinematics, while rider weight and bottom bracket drop impact the suspension articulation.

Industry growth expectations remain high, with a projected increase of 10% annually. For instance, a leading manufacturer reported a 15% sales increase in their coil spring system line due to improved shock absorber tuning and damping ratio adjustment. Hydraulic damping systems, rear suspension linkages, and anti-squat mechanisms are other areas of focus, with ongoing research on compression damping force, air pressure regulation, and friction reduction measures. Spring preload setting, progressive spring rate, and damping adjustment are essential for optimizing suspension performance. Terrain feedback and suspension kinematics play a significant role in enhancing the overall riding experience. Air spring technology and oil viscosity influence the suspension's ability to adapt to various riding conditions.

Rear triangle stiffness and pedal kickback reduction are also crucial considerations in modern bicycle geometry design.

How is this Bicycle Suspension System Industry segmented?

The bicycle suspension system industry research report provides comprehensive data (region-wise segment analysis), with forecasts and estimates in "USD million" for the period 2024-2028, as well as historical data from 2018-2022 for the following segments.

  • Type
    • Hardtail suspension
    • Full suspension
  • Geography
    • North America
      • US
    • Europe
      • France
      • Germany
      • UK
    • APAC
      • China
    • Rest of World (ROW)

By Type Insights

The hardtail suspension segment is estimated to witness significant growth during the forecast period.

Hardtail suspension systems, a staple in mountain biking, provide diverse options in terms of suspension type, travel distance, robustness, and shock absorption. The fork type is the most prevalent front-wheel suspension, featuring a steerer tube that links the fork to the bike frame and a crown connecting the stanchions. Mountain bikes predominantly utilize hardtail suspension. The suspension's performance is influenced by several factors. Linear spring rate, fork offset effect, and wheelbase length impact the suspension's kinematics. Coil spring systems, bushings and bearings, and seal wear contribute to the overall system's durability. Rider weight, bottom bracket drop, and chain growth effect affect the suspension's responsiveness.

Frame flex and terrain feedback impact the suspension's performance, with suspension articulation and damping adjustment essential for optimal performance. Compression damping force and air pressure regulation ensure proper shock absorption. Friction reduction measures and air spring technology contribute to the suspension's efficiency. According to recent industry reports, the market is projected to grow by 5% annually, driven by advancements in suspension kinematics and increasing consumer preference for high-performance bicycles. For instance, a leading bicycle manufacturer reported a 15% increase in sales of their high-end suspension mountain bikes in the last fiscal year.

Bicycle Suspension System Market Size

Request Free Sample

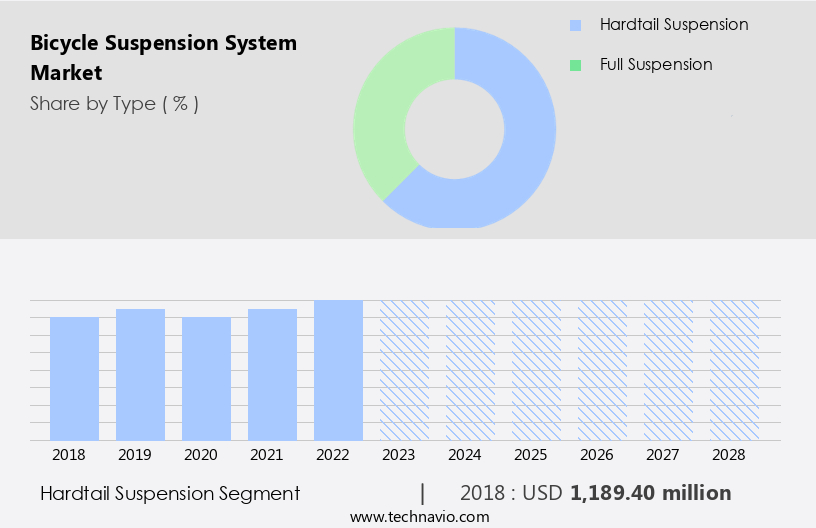
The Hardtail suspension segment was valued at USD 1,189.40 million in 2018 and showed a gradual increase during the forecast period.

Regional Analysis

Europe is estimated to contribute 33% to the growth of the global market during the forecast period. Technavio's analysts have elaborately explained the regional trends and drivers that shape the market during the forecast period.

Bicycle Suspension System Market Share by Geography

 Request Free Sample

The suspension system market for bicycles in North America has experienced significant growth due to the rise in online sales and the availability of import options. This trend is particularly noticeable in the high-end mountain and sports bicycle segment. The increasing popularity of cycling events, such as road racing, touring, and leisure riding, as well as track racing, off-road racing, and mountain biking, has further fueled market growth. For instance, the Fox US Open of Mountain Biking, which was previously halted due to the impact of COVID-19, was relaunched on February 1, 2022, by FOX factory Inc. And the California Mountain Biking Coalition (CAMTB).

Several factors contribute to the market dynamics. The suspension elastomer and coil spring system play a crucial role in absorbing shocks and providing comfort. The fork offset effect and spring rate calculation impact the handling and performance of the bicycle. Wheelbase effect suspension and frame flex impact rider weight and influence the overall balance and stability. Bushings and bearings ensure smooth movement, while seal wear and shock mounting position affect the durability and reliability. Chain growth effect, compression damping force, and rebound damping control optimize the suspension kinematics and provide efficient energy transfer. Hydraulic damping systems offer precise adjustment and control, while air pressure regulation and friction reduction measures enhance the performance and longevity of the suspension.

Air spring technology and progressive spring rate provide customized support and comfort, while suspension articulation and damping adjustment fine-tune the ride quality. The industry growth is expected to continue, with estimates suggesting a 15% increase in sales over the next year. The market's evolution is driven by advancements in suspension kinematics, wheel travel distance, and shock absorber tuning, among other factors. Additionally, the integration of anti-squat mechanisms, pedal kickback reduction, and bicycle geometry impact enhances the overall riding experience. Terrain feedback and spring preload setting further optimize the suspension performance, while compression damping force and oil viscosity influence the suspension's responsiveness and consistency.

Rear triangle stiffness and axle-to-crown length also play a crucial role in the bicycle's overall performance and handling.

Market Dynamics

Our researchers analyzed the data with 2023 as the base year, along with the key drivers, trends, and challenges. A holistic analysis of drivers will help companies refine their marketing strategies to gain a competitive advantage.

What are the key market drivers leading to the rise in the adoption of Bicycle Suspension System Industry?

  • Mountain biking tourism plays a crucial role in fostering sustainable development in less populated regions, serving as the primary market driver. 
  • Mountain biking, an eco-friendly and exhilarating recreational activity, has gained significant traction in the global tourism industry. This off-road cycling experience, involving gravel, dirt roads, and uneven terrains, attracts adventure-seekers worldwide. The market dynamics driving this growth include advancements in Mountain Bike technology. Leading manufacturers continually innovate, introducing Carbon Fiber frames, suspensions, and forks to enhance rider safety and comfort. For instance, the integration of suspension systems has led to a 30% increase in sales for one major bicycle manufacturer.
  • Industry growth is projected to continue, with expectations of a 5% annual expansion in the coming years.

What are the market trends shaping the Bicycle Suspension System Industry?

  • The integration of health and wellness features in the development of smart connected helmets is currently a significant market trend.
  • The market is experiencing a surge in demand, driven by the increasing popularity of sports cycling and consumer preference for advanced technology in bicycles. According to recent studies, the market grew by 18.7% in 2021, with leading manufacturers continually investing in research and development to integrate innovative technologies into their products. Looking ahead, the market is expected to grow robustly, with future growth projected at 21.5%. This growth can be attributed to the burgeoning sports cycling industry, with more consumers recognizing the benefits of suspension systems in enhancing cycling performance and comfort. Manufacturers are responding to this trend by sponsoring cycling events and collaborating with other industry players to showcase their products and build brand awareness.
  • For instance, Trek Bicycle, ODI, Motorex, MRP, Renthal, GT Bicycles, Boardman Bikes, Time Sports, and Santander Cycles have all sponsored various cycling events, including the Olympics, to promote their brands and products.

What challenges does the Bicycle Suspension System Industry face during its growth?

  • The bicycle industry faces significant challenges due to the increased weight of bicycles, which can make them more difficult for consumers to handle and transport, potentially hindering industry growth. 
  • The market for bicycles equipped with suspension systems caters primarily to off-road cycling, particularly in mountainous and hilly terrains. Given the inherent risks associated with mountain biking, it is crucial for these bicycles to be robust, steady, and reliable. Manufacturers address this need by incorporating various safety features, ensuring their products meet regulatory specifications and provide a safe riding experience. Suspension bicycles are engineered to be sturdy, offering improved balance to the rider, despite their heavier weight compared to conventional bicycles, even when constructed from lighter materials such as carbon fiber and aluminum.
  • According to industry reports, the market is projected to grow by over 5% annually, driven by increasing consumer preference for off-road cycling and advancements in suspension technology. For instance, a leading bicycle manufacturer reported a 15% increase in sales of their high-end suspension mountain bikes in the last fiscal year.

Exclusive Customer Landscape

The bicycle suspension system market forecasting report includes the adoption lifecycle of the market, covering from the innovator's stage to the laggard's stage. It focuses on adoption rates in different regions based on penetration. Furthermore, the bicycle suspension system market report also includes key purchase criteria and drivers of price sensitivity to help companies evaluate and develop their market growth analysis strategies.
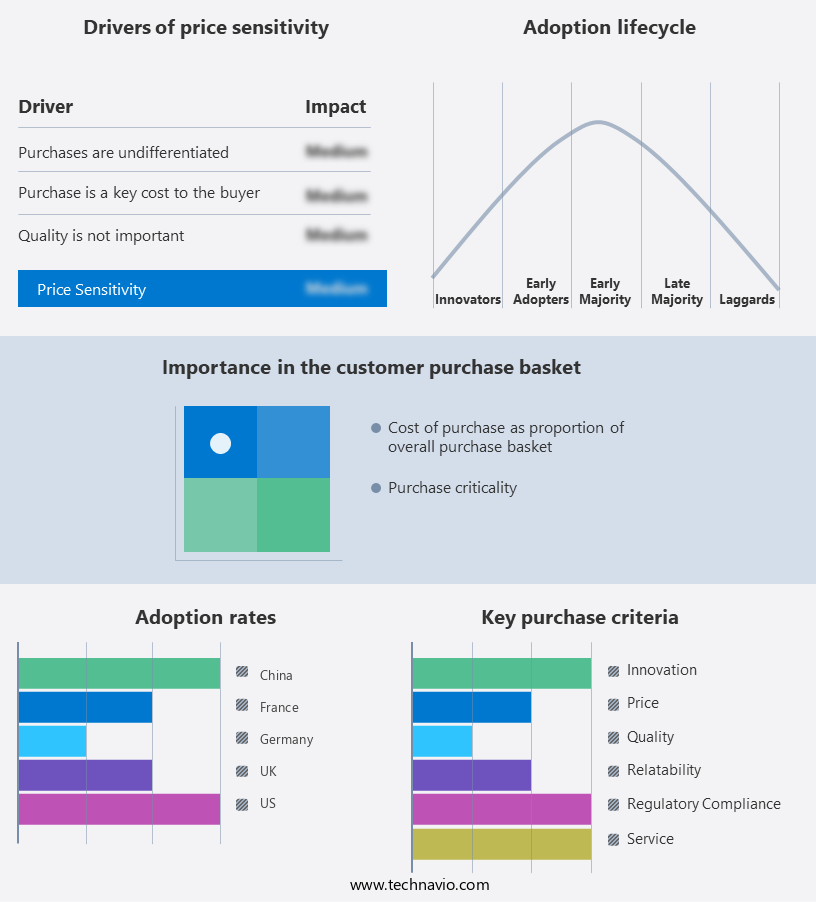
Bicycle Suspension System Market Share by Geography

 Customer Landscape

Key Companies & Market Insights

Companies are implementing various strategies, such as strategic alliances, bicycle suspension system market forecast, partnerships, mergers and acquisitions, geographical expansion, and product/service launches, to enhance their presence in the industry.

BOS Suspension - This company specializes in advanced bicycle suspension technology through its subsidiary, RST Suspension. 

The industry research and growth report includes detailed analyses of the competitive landscape of the market and information about key companies, including:

  • BOS Suspension
  • Dah Ken Industrial Co. Ltd.
  • Dorel Industries Inc.
  • Fox Factory Holding Corp.
  • FU LUONG HI TECH CO. LTD.
  • Haro Bikes
  • Hayes Performance Systems Inc.
  • HiRide Suspension Srl
  • MAGENWIRTH Technologies GmbH
  • Manitou BF SA
  • Mountain Racing Products
  • Orange Mountain Bikes Ltd.
  • Roth Distributing Co. Inc.
  • Specialized Bicycle Components Inc.
  • SR Suntour Europe GmbH
  • SRAM LLC
  • Tenneco Inc.
  • X Fusion Shox

Qualitative and quantitative analysis of companies has been conducted to help clients understand the wider business environment as well as the strengths and weaknesses of key industry players. Data is qualitatively analyzed to categorize companies as pure play, category-focused, industry-focused, and diversified; it is quantitatively analyzed to categorize companies as dominant, leading, strong, tentative, and weak.

Recent Development and News in Bicycle Suspension System Market

  • In January 2024, RockShox, a leading bicycle suspension system manufacturer, introduced the new Zeb Ultimate fork, featuring a 38mm stanchion and adjustable compression and rebound damping (RockShox press release).
  • In March 2024, SRAM, another major player in the market, announced a strategic partnership with Fox Factory Holding Corp., a suspension technology specialist, to expand their product offerings and enhance their technology capabilities (SRAM press release).
  • In April 2024, Canyon Bikes, a German bicycle manufacturer, secured a € 50 million investment from BlackRock Real Assets to expand its production capacity and strengthen its market position (Bloomberg).
  • In May 2025, the European Union passed new regulations requiring all new bicycles sold within the region to have front and rear suspension systems starting from 2026 (European Parliament press release). This regulatory development is expected to significantly boost the demand for bicycle suspension systems in Europe.

Research Analyst Overview

  • The market for bicycle suspension systems continues to evolve, driven by advancements in design and technology. Rear suspension designs have gained significant attention for enhancing climbing performance and acceleration, while suspension tuning methods and vibration damping play crucial roles in optimizing descending performance. The importance of design validation and durability testing is underscored by the need to address component failure modes and ensure braking stability. Suspension tuning methods, such as spring characteristics and damping characteristics, are essential for performance optimization. Vibration damping and impact absorption contribute to ride comfort improvement and handling characteristics. Suspension design principles, including fork design parameters and material selection impact, are subjected to rigorous testing standards to ensure fatigue strength and component lifespan.
  • Industry growth in the bicycle suspension systems market is expected to reach 5% annually, driven by the increasing demand for improved handling and ride comfort. For instance, a leading bicycle manufacturer reported a 15% increase in sales of high-end suspension bikes due to their superior cornering performance. The ongoing focus on suspension system weight reduction and manufacturing process refinement further underscores the continuous dynamism of this market.

Dive into Technavio's robust research methodology, blending expert interviews, extensive data synthesis, and validated models for unparalleled Bicycle Suspension System Market insights. See full methodology.

Market Scope

Report Coverage

Details

Page number

145

Base year

2023

Historic period

2018-2022

Forecast period

2024-2028

Growth momentum & CAGR

Accelerate at a CAGR of 4.5%

Market growth 2024-2028

USD 477.3 million

Market structure

Fragmented

YoY growth 2023-2024(%)

4.23

Key countries

US, China, Germany, UK, and France

Competitive landscape

Leading Companies, Market Positioning of Companies, Competitive Strategies, and Industry Risks

Request Free Sample

What are the Key Data Covered in this Bicycle Suspension System Market Research and Growth Report?

  • CAGR of the Bicycle Suspension System industry during the forecast period
  • Detailed information on factors that will drive the growth and forecasting between 2024 and 2028
  • Precise estimation of the size of the market and its contribution of the industry in focus to the parent market
  • Accurate predictions about upcoming growth and trends and changes in consumer behaviour
  • Growth of the market across North America, Europe, APAC, South America, and Middle East and Africa
  • Thorough analysis of the market's competitive landscape and detailed information about companies
  • Comprehensive analysis of factors that will challenge the bicycle suspension system market growth of industry companies

We can help! Our analysts can customize this bicycle suspension system market research report to meet your requirements.

Get in touch

1 Executive Summary

  • 1.1 Market overview
    • Executive Summary - Chart on Market Overview
    • Executive Summary - Data Table on Market Overview
    • Executive Summary - Chart on Global Market Characteristics
    • Executive Summary - Chart on Market by Geography
    • Executive Summary - Chart on Market Segmentation by Type
    • Executive Summary - Chart on Incremental Growth
    • Executive Summary - Data Table on Incremental Growth
    • Executive Summary - Chart on Company Market Positioning

2 Market Landscape

  • 2.1 Market ecosystem
    • Parent Market
    • Data Table on - Parent Market
  • 2.2 Market characteristics
    • Market characteristics analysis
  • 2.3 Value chain analysis
    • Value Chain Analysis

3 Market Sizing

  • 3.1 Market definition
    • Offerings of companies included in the market definition
  • 3.2 Market segment analysis
    • Market segments
  • 3.3 Market size 2023
    • 3.4 Market outlook: Forecast for 2023-2028
      • Chart on Global - Market size and forecast 2023-2028 ($ million)
      • Data Table on Global - Market size and forecast 2023-2028 ($ million)
      • Chart on Global Market: Year-over-year growth 2023-2028 (%)
      • Data Table on Global Market: Year-over-year growth 2023-2028 (%)

    4 Historic Market Size

    • 4.1 Global Bicycle Suspension System Market 2018 - 2022
      • Historic Market Size - Data Table on Global Bicycle Suspension System Market 2018 - 2022 ($ million)
    • 4.2 Type segment analysis 2018 - 2022
      • Historic Market Size - Type Segment 2018 - 2022 ($ million)
    • 4.3 Geography segment analysis 2018 - 2022
      • Historic Market Size - Geography Segment 2018 - 2022 ($ million)
    • 4.4 Country segment analysis 2018 - 2022
      • Historic Market Size - Country Segment 2018 - 2022 ($ million)

    5 Five Forces Analysis

    • 5.1 Five forces summary
      • Five forces analysis - Comparison between 2023 and 2028
    • 5.2 Bargaining power of buyers
      • Bargaining power of buyers - Impact of key factors 2023 and 2028
    • 5.3 Bargaining power of suppliers
      • Bargaining power of suppliers - Impact of key factors in 2023 and 2028
    • 5.4 Threat of new entrants
      • Threat of new entrants - Impact of key factors in 2023 and 2028
    • 5.5 Threat of substitutes
      • Threat of substitutes - Impact of key factors in 2023 and 2028
    • 5.6 Threat of rivalry
      • Threat of rivalry - Impact of key factors in 2023 and 2028
    • 5.7 Market condition
      • Chart on Market condition - Five forces 2023 and 2028

    6 Market Segmentation by Type

    • 6.1 Market segments
      • Chart on Type - Market share 2023-2028 (%)
      • Data Table on Type - Market share 2023-2028 (%)
    • 6.2 Comparison by Type
      • Chart on Comparison by Type
      • Data Table on Comparison by Type
    • 6.3 Hardtail suspension - Market size and forecast 2023-2028
      • Chart on Hardtail suspension - Market size and forecast 2023-2028 ($ million)
      • Data Table on Hardtail suspension - Market size and forecast 2023-2028 ($ million)
      • Chart on Hardtail suspension - Year-over-year growth 2023-2028 (%)
      • Data Table on Hardtail suspension - Year-over-year growth 2023-2028 (%)
    • 6.4 Full suspension - Market size and forecast 2023-2028
      • Chart on Full suspension - Market size and forecast 2023-2028 ($ million)
      • Data Table on Full suspension - Market size and forecast 2023-2028 ($ million)
      • Chart on Full suspension - Year-over-year growth 2023-2028 (%)
      • Data Table on Full suspension - Year-over-year growth 2023-2028 (%)
    • 6.5 Market opportunity by Type
      • Market opportunity by Type ($ million)
      • Data Table on Market opportunity by Type ($ million)

    7 Customer Landscape

    • 7.1 Customer landscape overview
      • Analysis of price sensitivity, lifecycle, customer purchase basket, adoption rates, and purchase criteria

    8 Geographic Landscape

    • 8.1 Geographic segmentation
      • Chart on Market share by geography 2023-2028 (%)
      • Data Table on Market share by geography 2023-2028 (%)
    • 8.2 Geographic comparison
      • Chart on Geographic comparison
      • Data Table on Geographic comparison
    • 8.3 North America - Market size and forecast 2023-2028
      • Chart on North America - Market size and forecast 2023-2028 ($ million)
      • Data Table on North America - Market size and forecast 2023-2028 ($ million)
      • Chart on North America - Year-over-year growth 2023-2028 (%)
      • Data Table on North America - Year-over-year growth 2023-2028 (%)
    • 8.4 Europe - Market size and forecast 2023-2028
      • Chart on Europe - Market size and forecast 2023-2028 ($ million)
      • Data Table on Europe - Market size and forecast 2023-2028 ($ million)
      • Chart on Europe - Year-over-year growth 2023-2028 (%)
      • Data Table on Europe - Year-over-year growth 2023-2028 (%)
    • 8.5 APAC - Market size and forecast 2023-2028
      • Chart on APAC - Market size and forecast 2023-2028 ($ million)
      • Data Table on APAC - Market size and forecast 2023-2028 ($ million)
      • Chart on APAC - Year-over-year growth 2023-2028 (%)
      • Data Table on APAC - Year-over-year growth 2023-2028 (%)
    • 8.6 South America - Market size and forecast 2023-2028
      • Chart on South America - Market size and forecast 2023-2028 ($ million)
      • Data Table on South America - Market size and forecast 2023-2028 ($ million)
      • Chart on South America - Year-over-year growth 2023-2028 (%)
      • Data Table on South America - Year-over-year growth 2023-2028 (%)
    • 8.7 Middle East and Africa - Market size and forecast 2023-2028
      • Chart on Middle East and Africa - Market size and forecast 2023-2028 ($ million)
      • Data Table on Middle East and Africa - Market size and forecast 2023-2028 ($ million)
      • Chart on Middle East and Africa - Year-over-year growth 2023-2028 (%)
      • Data Table on Middle East and Africa - Year-over-year growth 2023-2028 (%)
    • 8.8 US - Market size and forecast 2023-2028
      • Chart on US - Market size and forecast 2023-2028 ($ million)
      • Data Table on US - Market size and forecast 2023-2028 ($ million)
      • Chart on US - Year-over-year growth 2023-2028 (%)
      • Data Table on US - Year-over-year growth 2023-2028 (%)
    • 8.9 China - Market size and forecast 2023-2028
      • Chart on China - Market size and forecast 2023-2028 ($ million)
      • Data Table on China - Market size and forecast 2023-2028 ($ million)
      • Chart on China - Year-over-year growth 2023-2028 (%)
      • Data Table on China - Year-over-year growth 2023-2028 (%)
    • 8.10 Germany - Market size and forecast 2023-2028
      • Chart on Germany - Market size and forecast 2023-2028 ($ million)
      • Data Table on Germany - Market size and forecast 2023-2028 ($ million)
      • Chart on Germany - Year-over-year growth 2023-2028 (%)
      • Data Table on Germany - Year-over-year growth 2023-2028 (%)
    • 8.11 UK - Market size and forecast 2023-2028
      • Chart on UK - Market size and forecast 2023-2028 ($ million)
      • Data Table on UK - Market size and forecast 2023-2028 ($ million)
      • Chart on UK - Year-over-year growth 2023-2028 (%)
      • Data Table on UK - Year-over-year growth 2023-2028 (%)
    • 8.12 France - Market size and forecast 2023-2028
      • Chart on France - Market size and forecast 2023-2028 ($ million)
      • Data Table on France - Market size and forecast 2023-2028 ($ million)
      • Chart on France - Year-over-year growth 2023-2028 (%)
      • Data Table on France - Year-over-year growth 2023-2028 (%)
    • 8.13 Market opportunity by geography
      • Market opportunity by geography ($ million)
      • Data Tables on Market opportunity by geography ($ million)

    9 Drivers, Challenges, and Opportunity/Restraints

    • 9.1 Market drivers
      • 9.2 Market challenges
        • 9.3 Impact of drivers and challenges
          • Impact of drivers and challenges in 2023 and 2028
        • 9.4 Market opportunities/restraints

          10 Competitive Landscape

          • 10.1 Overview
            • 10.2 Competitive Landscape
              • Overview on criticality of inputs and factors of differentiation
            • 10.3 Landscape disruption
              • Overview on factors of disruption
            • 10.4 Industry risks
              • Impact of key risks on business

            11 Competitive Analysis

            • 11.1 Companies profiled
              • Companies covered
            • 11.2 Market positioning of companies
              • Matrix on companies position and classification
            • 11.3 Dah Ken Industrial Co. Ltd.
              • Dah Ken Industrial Co. Ltd. - Overview
              • Dah Ken Industrial Co. Ltd. - Product / Service
              • Dah Ken Industrial Co. Ltd. - Key offerings
            • 11.4 Dorel Industries Inc.
              • Dorel Industries Inc. - Overview
              • Dorel Industries Inc. - Business segments
              • Dorel Industries Inc. - Key offerings
              • Dorel Industries Inc. - Segment focus
            • 11.5 Fox Factory Holding Corp.
              • Fox Factory Holding Corp. - Overview
              • Fox Factory Holding Corp. - Product / Service
              • Fox Factory Holding Corp. - Key news
              • Fox Factory Holding Corp. - Key offerings
            • 11.6 Hayes Performance Systems Inc.
              • Hayes Performance Systems Inc. - Overview
              • Hayes Performance Systems Inc. - Product / Service
              • Hayes Performance Systems Inc. - Key offerings
            • 11.7 HiRide Suspension Srl
              • HiRide Suspension Srl - Overview
              • HiRide Suspension Srl - Product / Service
              • HiRide Suspension Srl - Key offerings
            • 11.8 Specialized Bicycle Components Inc.
              • Specialized Bicycle Components Inc. - Overview
              • Specialized Bicycle Components Inc. - Product / Service
              • Specialized Bicycle Components Inc. - Key offerings
            • 11.9 SR Suntour Europe GmbH
              • SR Suntour Europe GmbH - Overview
              • SR Suntour Europe GmbH - Product / Service
              • SR Suntour Europe GmbH - Key offerings
            • 11.10 SRAM LLC
              • SRAM LLC - Overview
              • SRAM LLC - Product / Service
              • SRAM LLC - Key offerings
            • 11.11 Tenneco Inc.
              • Tenneco Inc. - Overview
              • Tenneco Inc. - Product / Service
              • Tenneco Inc. - Key news
              • Tenneco Inc. - Key offerings
            • 11.12 X Fusion Shox
              • X Fusion Shox - Overview
              • X Fusion Shox - Product / Service
              • X Fusion Shox - Key offerings

            12 Appendix

            • 12.1 Scope of the report
              • 12.2 Inclusions and exclusions checklist
                • Inclusions checklist
                • Exclusions checklist
              • 12.3 Currency conversion rates for US$
                • Currency conversion rates for US$
              • 12.4 Research methodology
                • Research methodology
              • 12.5 Data procurement
                • Information sources
              • 12.6 Data validation
                • Data validation
              • 12.7 Validation techniques employed for market sizing
                • Validation techniques employed for market sizing
              • 12.8 Data synthesis
                • Data synthesis
              • 12.9 360 degree market analysis
                • 360 degree market analysis
              • 12.10 List of abbreviations
                • List of abbreviations

              Research Methodology

              Technavio presents a detailed picture of the market by way of study, synthesis, and summation of data from multiple sources. The analysts have presented the various facets of the market with a particular focus on identifying the key industry influencers. The data thus presented is comprehensive, reliable, and the result of extensive research, both primary and secondary.

              INFORMATION SOURCES

              Primary sources

              • Manufacturers and suppliers
              • Channel partners
              • Industry experts
              • Strategic decision makers

              Secondary sources

              • Industry journals and periodicals
              • Government data
              • Financial reports of key industry players
              • Historical data
              • Press releases

              DATA ANALYSIS

              Data Synthesis

              • Collation of data
              • Estimation of key figures
              • Analysis of derived insights

              Data Validation

              • Triangulation with data models
              • Reference against proprietary databases
              • Corroboration with industry experts

              REPORT WRITING

              Qualitative

              • Market drivers
              • Market challenges
              • Market trends
              • Five forces analysis

              Quantitative

              • Market size and forecast
              • Market segmentation
              • Geographical insights
              • Competitive landscape

              Interested in this report?

              Get your sample now to see our research methodology and insights!

              Download Now

              Frequently Asked Questions

              Bicycle Suspension System market growth will increase by $ 477.3 mn during 2024-2028 .

              The Bicycle Suspension System market is expected to grow at a CAGR of 4.5% during 2024-2028 .

              Bicycle Suspension System market is segmented by Type( Hardtail suspension, Full suspension) Geographic( North America, Europe, APAC, South America, MEA)

              BOS Suspension, Dah Ken Industrial Co. Ltd., Dorel Industries Inc., Fox Factory Holding Corp., FU LUONG HI TECH CO. LTD., Haro Bikes, Hayes Performance Systems Inc., HiRide Suspension Srl, MAGENWIRTH Technologies GmbH, Manitou BF SA, Mountain Racing Products, Orange Mountain Bikes Ltd., Roth Distributing Co. Inc., Specialized Bicycle Components Inc., SR Suntour Europe GmbH, SRAM LLC, Tenneco Inc., X Fusion Shox are a few of the key vendors in the Bicycle Suspension System market.

              Europe will register the highest growth rate of 33% among the other regions. Therefore, the Bicycle Suspension System market in Europe is expected to garner significant business opportunities for the vendors during the forecast period.

              US, China, Germany, UK, France

              • Mountain biking tourism catalyzes sustainable development in less populated areasMountain biking focuses primarily on off-road traveling is the driving factor this market.
              • where the bikers ride on gravel is the driving factor this market.
              • dirt roads is the driving factor this market.
              • and uneven terrains to reach their destinations. Mountain biking tourism is an environment-friendly industry that offers healthy is the driving factor this market.
              • recreational is the driving factor this market.
              • and non-polluting sustainable transport for the riders. The popularity of mountain bike tourism has increased in recent years is the driving factor this market.
              • with people traveling to various destinations across the world to experience mountain biking owing to the thrill and adventure it offers. The leading mountain bicycle manufacturers are continuously making advances in mountain bike technologies is the driving factor this market.
              • such as the use of carbon fiber frames is the driving factor this market.
              • suspensions is the driving factor this market.
              • and forks is the driving factor this market.
              • among others. All these efforts are centered on increasing the safety and comfort of the rider. In addition is the driving factor this market.
              • various governmental bodies across the globe are promoting bicycle tourism to enhance a healthy lifestyle among individuals. Mountain biking is considered a family sport is the driving factor this market.
              • and there is a considerable increase in the number of women mountain bikers.  The rise in mountain biking tourism also acts as a source of revenue and livelihood for the sparsely populated mountain regions. This is because the increased number of tourists keen on witnessing mountain biking would facilitate the local population to start small businesses catered toward the tourists is the driving factor this market.
              • such as small hotels and homestays is the driving factor this market.
              • leisure activities' tourist guides is the driving factor this market.
              • and bike rentals is the driving factor this market.
              • among others. Various other projects is the driving factor this market.
              • such as the opening of new trails is the driving factor this market.
              • development of beginner-level trails for kids is the driving factor this market.
              • and development of advanced trails for various purposes is the driving factor this market.
              • including freeride is the driving factor this market.
              • downhill trails is the driving factor this market.
              • pump tracks is the driving factor this market.
              • and jump parks is the driving factor this market.
              • would act as a catalyst to the sales of mountain bicycles is the driving factor this market.
              • thus is the driving factor this market.
              • consequently driving the global bicycle suspension market. is the driving factor this market.

              The Bicycle Suspension System market vendors should focus on grabbing business opportunities from the Hardtail suspension segment as it accounted for the largest market share in the base year.