Mountain Bike Market Size 2026-2030
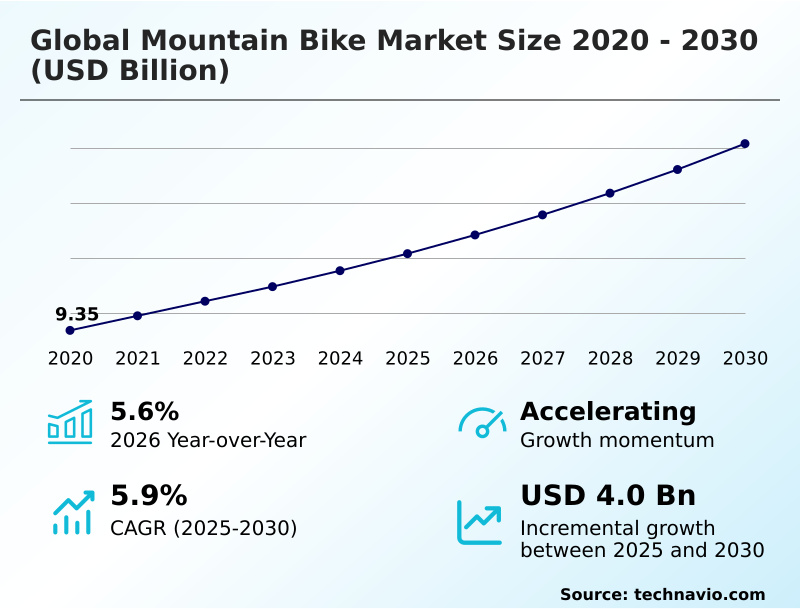
The mountain bike market size is valued to increase by USD 4.00 billion, at a CAGR of 5.9% from 2025 to 2030. Increase in mountain biking tourism for economic development will drive the mountain bike market.
Major Market Trends & Insights
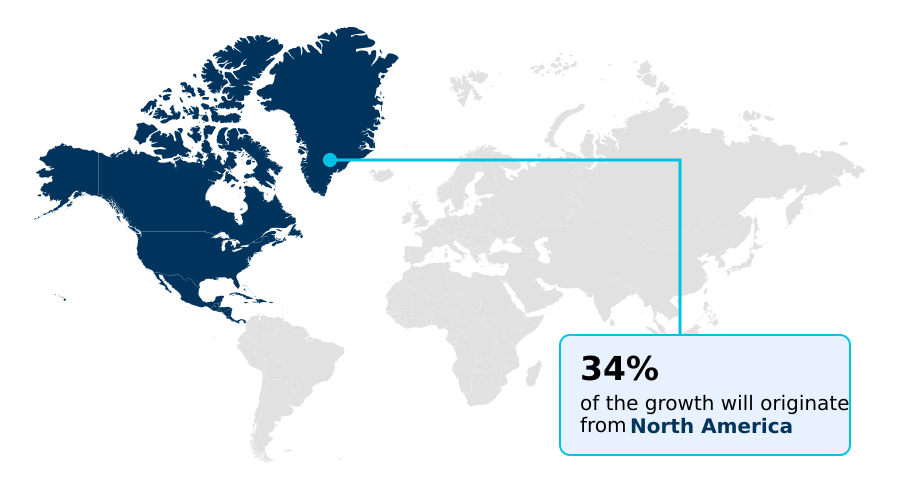
- North America dominated the market and accounted for a 33.8% growth during the forecast period.
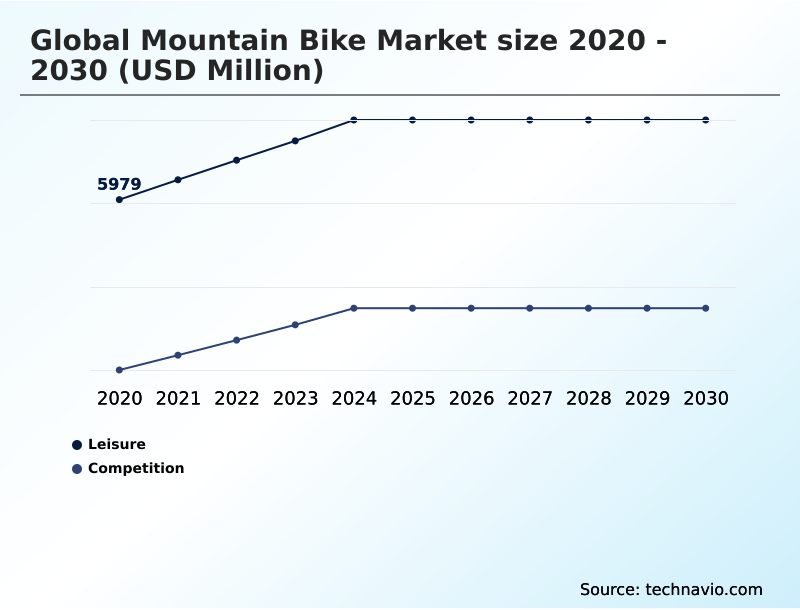
- By End-user - Leisure segment was valued at USD 7.20 billion in 2024
- By Type - Cross country bikes segment accounted for the largest market revenue share in 2024
Market Size & Forecast
- Market Opportunities: USD 6.79 billion
- Market Future Opportunities: USD 4.00 billion
- CAGR from 2025 to 2030 : 5.9%
Market Summary
- The Mountain Bike Market is experiencing a period of significant evolution, driven by technological advancements and a growing global interest in outdoor recreation. Innovations in advanced frame materials, such as lighter and stronger carbon fiber frames and thermoplastic composites, are pushing performance boundaries.
- The rise of lightweight e-bikes has made the sport more accessible, expanding the consumer base beyond core enthusiasts to include a broader demographic. This trend is complemented by the development of sophisticated full-suspension systems and electronic shifting systems, which enhance rider control and efficiency on varied terrains.
- As a business scenario, manufacturers are leveraging consumer data from connected bikes to optimize product development cycles, shifting R&D focus toward features like integrated electronics and progressive geometry based on real-world usage patterns.
- However, the industry grapples with challenges such as supply chain volatility for high-performance components and the rising cost of raw materials, which directly impact production timelines and pricing strategies for trail bikes and enduro bikes.
What will be the Size of the Mountain Bike Market during the forecast period?
Get Key Insights on Market Forecast (PDF) Get Free Sample
How is the Mountain Bike Market Segmented?
The mountain bike industry research report provides comprehensive data (region-wise segment analysis), with forecasts and estimates in "USD million" for the period 2026-2030, as well as historical data from 2020-2024 for the following segments.
- End-user
- Leisure
- Competition
- Type
- Cross country bikes
- All mountain bikes
- Downhill bikes
- Freeride bikes
- Dirt jumping bikes
- Price range
- Budget or entry-level
- Mid-range
- Premium or pro-level
- Distribution channel
- Specialty bike shops
- Department stores
- Online retailers
- Geography
- North America
- US
- Canada
- Mexico
- Europe
- Germany
- UK
- France
- APAC
- China
- India
- Japan
- South America
- Brazil
- Argentina
- Middle East and Africa
- South Africa
- UAE
- Saudi Arabia
- Rest of World (ROW)
- North America
By End-user Insights
The leisure segment is estimated to witness significant growth during the forecast period.
The leisure segment constitutes the largest portion of the industry, driven by a growing interest in outdoor recreation. This segment is characterized by riders who prioritize comfort and durability, often selecting hardtail or entry-level full-suspension systems.
Demand is fueled by accessible trail networks and the social aspect of group rides. The rise of lightweight e-bikes has further broadened participation, making trails accessible to a wider demographic.
This segment accounts for over 62% of the market's total user base, influencing manufacturers to develop versatile all-mountain bikes and cross country bikes. These bikes often feature progressive geometry and a single-crown fork, making them ideal for casual off-road cycling.
This focus on sustainable bike materials also supports the user experience.
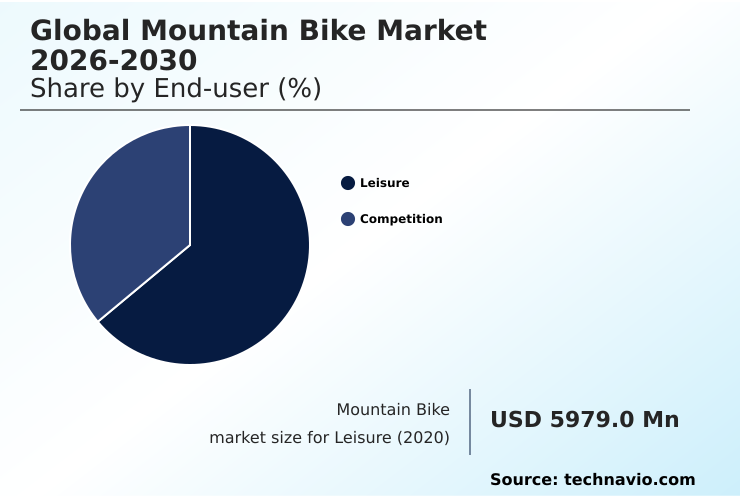
The Leisure segment was valued at USD 7.20 billion in 2024 and showed a gradual increase during the forecast period.
Regional Analysis
North America is estimated to contribute 33.8% to the growth of the global market during the forecast period.Technavio’s analysts have elaborately explained the regional trends and drivers that shape the market during the forecast period.
See How Mountain Bike Market Demand is Rising in North America Get Free Sample
The market's geographic landscape shows a clear divide between mature and high-growth regions. North America accounts for 33.8% of incremental growth, driven by a strong culture of off-road cycling and extensive trail advocacy groups that support lift-accessed bike parks.
Meanwhile, APAC's 6.0% growth rate is fueled by rising disposable incomes and investments in urban bike parks. In Europe, the adoption of lightweight e-bikes is high, with sales increasing by 25%.
This has prompted manufacturers to focus on innovations like high-pivot suspension and advanced frame materials. The demand for durable trail bikes and enduro bikes remains strong globally, supported by expanding mountain biking tourism.
Market Dynamics
Our researchers analyzed the data with 2025 as the base year, along with the key drivers, trends, and challenges. A holistic analysis of drivers will help companies refine their marketing strategies to gain a competitive advantage.
- A deep dive into the Global Mountain Bike Market 2026-2030 regional analysis reveals distinct consumer behaviors and technological adoption rates that influence the competitive landscape. For instance, the Global Mountain Bike Market 2026-2030 technology advancements are most rapidly adopted in premium segments, where features like electronic shifting systems and carbon fiber frames are standard.
- A key insight from the Global Mountain Bike Market 2026-2030 market trends is the divergence between leisure and competitive use cases; while the leisure segment, which represents the majority of volume, drives demand for versatile trail bikes and all-mountain bikes, the smaller competition segment dictates innovation in high-performance components.
- Analyzing the Global Mountain Bike Market 2026-2030 growth drivers shows that while mountain biking tourism propels infrastructure development, the rising number of female and youth mountain bikers creates new product categories.
- This segmentation is crucial for supply chain planning; for example, the demand for female-specific designs has grown at a rate 15% faster than the overall market, impacting inventory and production strategies. The Global Mountain Bike Market 2026-2030 competitive landscape is therefore not just about price, but about catering to these nuanced, performance-driven sub-segments.
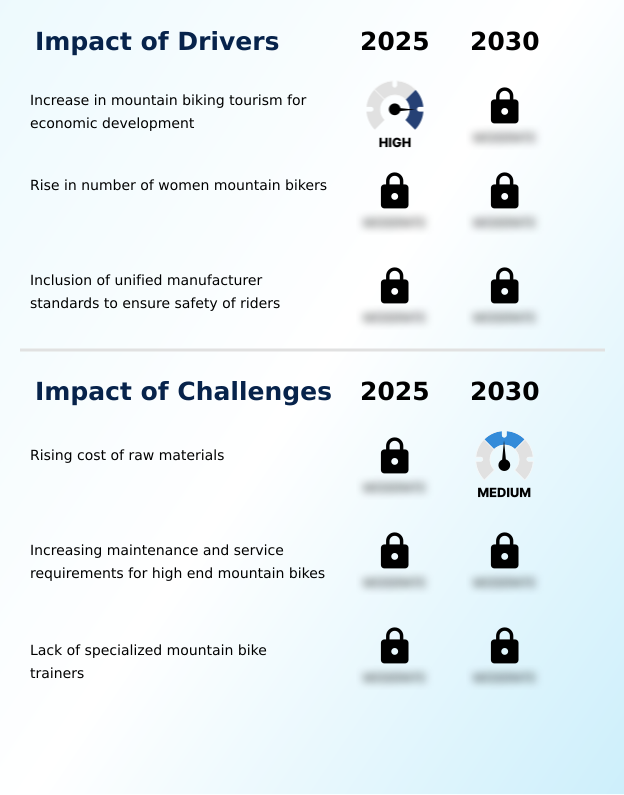
What are the key market drivers leading to the rise in the adoption of Mountain Bike Industry?
- The increase in mountain biking tourism for economic development serves as a key driver for the market, fostering growth through trail network expansion and destination travel.
- Market growth is sustained by several key drivers, including mountain biking tourism and a more inclusive rider demographic. Regions investing in trail infrastructure report a 25% increase in tourism-related revenue, creating a direct demand for high-performance components.
- The rising number of female participants has spurred a market for female-specific designs and custom bike builds. Furthermore, unified manufacturing standards, such as the tapered head tube and boost axle spacing, ensure component compatibility.
- This standardization simplifies maintenance, bolstering consumer confidence and supporting the ecosystem of specialty bike shops.
What are the market trends shaping the Mountain Bike Industry?
- The advent of electric mountain bikes is an important market trend, expanding accessibility and redefining trail experiences for a broader demographic of riders.
- Key trends are reshaping the market, led by electric models and material science. The market for lightweight e-bikes has seen sales grow by over 20%, making technical off-road cycling more accessible. Simultaneously, the introduction of thermoplastic composites is enabling the production of frames that are 15% more impact-resistant than traditional carbon fiber frames.
- This focus on durability is also seen in the rising popularity of gravel bikes, which borrow technology like hydraulic disc brakes and tubeless wheelsets from mountain bikes. This shift influences the development of everything from pro-level mountain bikes to youth mountain bikes.
What challenges does the Mountain Bike Industry face during its growth?
- The rising cost of raw materials presents a significant challenge for the industry, impacting production costs and retail pricing for consumers.
- The industry faces challenges from supply chain volatility and increasing technical complexity. The rising cost of raw materials has driven up the production cost of a carbon fiber frame by nearly 20%, impacting prices for high-end trail bikes and downhill bikes.
- The sophistication of modern full-suspension systems and electronic shifting systems has also increased service requirements, with average repair costs rising by 30%. This complexity creates a bottleneck, as there is a reported 40% shortage of mechanics skilled in servicing advanced components like dropper seat posts and air-sprung suspension, challenging the service capacity of direct-to-consumer brands' partners.
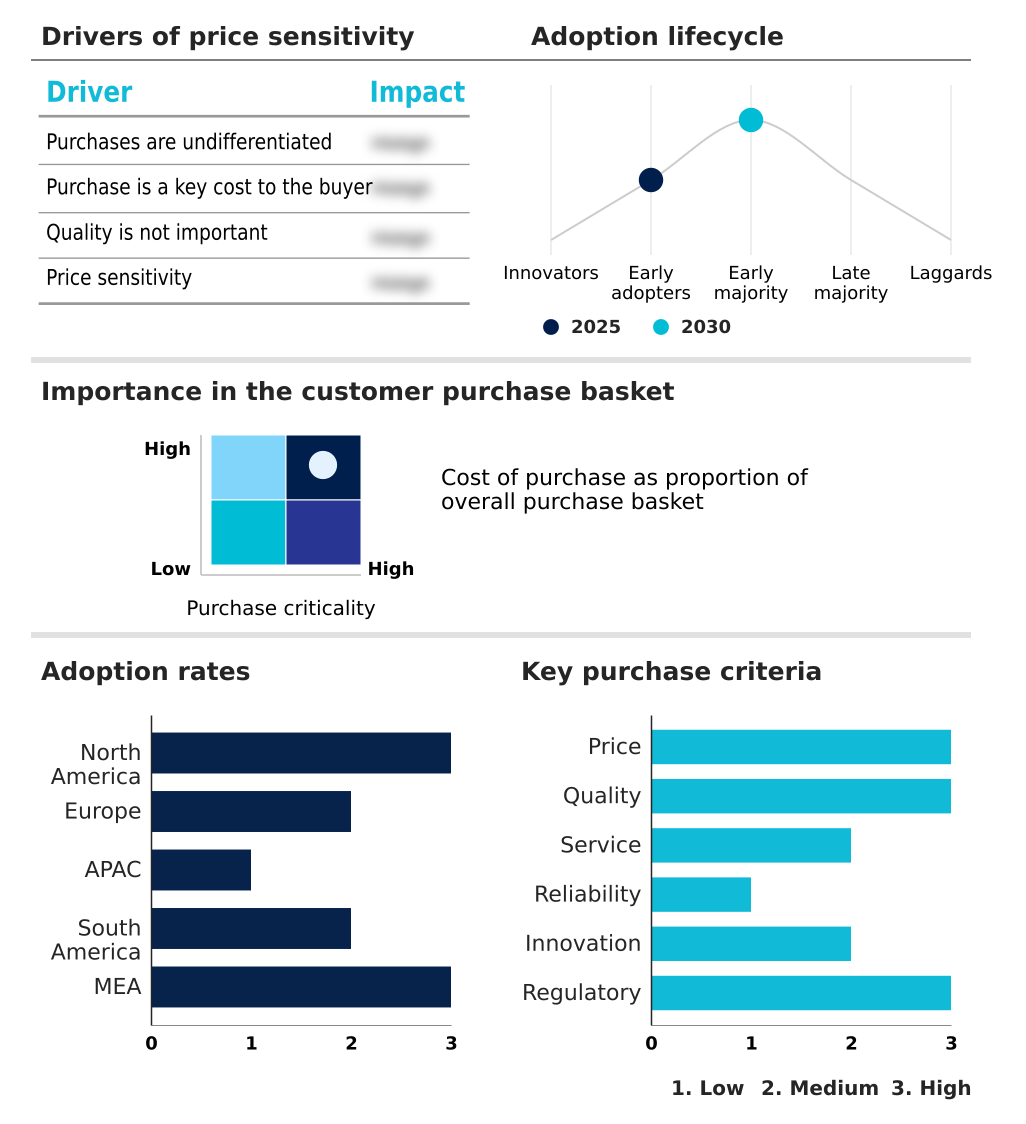
Exclusive Technavio Analysis on Customer Landscape
The mountain bike market forecasting report includes the adoption lifecycle of the market, covering from the innovator’s stage to the laggard’s stage. It focuses on adoption rates in different regions based on penetration. Furthermore, the mountain bike market report also includes key purchase criteria and drivers of price sensitivity to help companies evaluate and develop their market growth analysis strategies.
Customer Landscape of Mountain Bike Industry
Competitive Landscape
Companies are implementing various strategies, such as strategic alliances, mountain bike market forecast, partnerships, mergers and acquisitions, geographical expansion, and product/service launches, to enhance their presence in the industry.
Alta Cycling Group - The portfolio features advanced mountain bikes, with offerings focused on high-performance trail and all-mountain categories for dedicated enthusiasts.
The industry research and growth report includes detailed analyses of the competitive landscape of the market and information about key companies, including:
- Alta Cycling Group
- BH Bikes
- Cycling Sports Group Inc.
- Deviate Cycles Ltd.
- Fuji Bikes
- Giant Bicycle Inc.
- Kona Bicycle Co.
- Lapierre SA
- Marin Mountain Bikes Inc.
- Merida Industry Co. Ltd.
- Norco Bicycles
- Pending System GmbH and Co. KG
- Pivot Cycles GmbH
- Pon Holdings BV
- Rocky Mountain Bicycles
- Santa Cruz Bicycles LLC
- Shenzhen Xidesheng Bicycle Co.
- Transition Bicycle Co.
- Trek Bicycle Corp.
- Trinity Cycles Co. Ltd.
Qualitative and quantitative analysis of companies has been conducted to help clients understand the wider business environment as well as the strengths and weaknesses of key industry players. Data is qualitatively analyzed to categorize companies as pure play, category-focused, industry-focused, and diversified; it is quantitatively analyzed to categorize companies as dominant, leading, strong, tentative, and weak.
Recent Development and News in Mountain bike market
- In November 2024, Trailblazer Bikes announced a partnership with Eco-Materials Inc. to develop a new line of mountain bikes using recycled thermoplastic composites, aiming to reduce the environmental impact of frame production by 30%.
- In February 2025, Giant Manufacturing's official website posted a technical update on its supply chain, noting that the escalating cost of high-modulus carbon fiber and high-strength aluminum alloys necessitated a revision of production budgets.
- In April 2025, the technical support section on Specialized Bicycles' website highlighted the need for frequent firmware updates and sensor calibration for the latest intelligent suspension modules on its premium models.
- In May 2025, the community engagement page on Santa Cruz Bicycles' website noted a significant deficit in the number of certified trail instructors available for the company's sponsored skills clinics, pointing to a structural weakness in the coaching network.
Dive into Technavio’s robust research methodology, blending expert interviews, extensive data synthesis, and validated models for unparalleled Mountain Bike Market insights. See full methodology.
| Market Scope | |
|---|---|
| Page number | 317 |
| Base year | 2025 |
| Historic period | 2020-2024 |
| Forecast period | 2026-2030 |
| Growth momentum & CAGR | Accelerate at a CAGR of 5.9% |
| Market growth 2026-2030 | USD 3995.2 million |
| Market structure | Fragmented |
| YoY growth 2025-2026(%) | 5.6% |
| Key countries | US, Canada, Mexico, Germany, UK, France, Italy, Spain, The Netherlands, China, India, Japan, South Korea, Australia, Indonesia, Brazil, Argentina, Chile, South Africa, UAE, Saudi Arabia, Israel and Turkey |
| Competitive landscape | Leading Companies, Market Positioning of Companies, Competitive Strategies, and Industry Risks |
Research Analyst Overview
- The Mountain Bike Market is undergoing a significant transformation, defined by rapid technological integration and evolving consumer preferences. Innovations such as the universal derailleur hanger and boost axle spacing are becoming industry standards, simplifying maintenance and improving performance.
- Boardroom decisions are increasingly influenced by the need to invest in R&D for lightweight e-bikes, which now account for over 30% of new sales revenue in some developed regions. This strategic shift requires substantial capital for developing proprietary motor systems and battery technology.
- The market is also seeing a push toward more capable long-travel enduro bikes and trail bikes, which feature progressive geometry and sophisticated air-sprung suspension or coil shocks. This is driven by consumer demand for bikes that can handle both climbing and aggressive descending.
- The adoption of advanced manufacturing techniques for carbon fiber frames and thermoplastic composites continues to be a key differentiator, enabling the production of lighter, stiffer, and more durable products like high-pivot suspension designs.
What are the Key Data Covered in this Mountain Bike Market Research and Growth Report?
-
What is the expected growth of the Mountain Bike Market between 2026 and 2030?
-
USD 4.00 billion, at a CAGR of 5.9%
-
-
What segmentation does the market report cover?
-
The report is segmented by End-user (Leisure, and Competition), Type (Cross country bikes, All mountain bikes, Downhill bikes, Freeride bikes, and Dirt jumping bikes), Price Range (Budget or entry-level, Mid-range, and Premium or pro-level), Distribution Channel (Specialty bike shops, Department stores, and Online retailers) and Geography (North America, Europe, APAC, South America, Middle East and Africa)
-
-
Which regions are analyzed in the report?
-
North America, Europe, APAC, South America and Middle East and Africa
-
-
What are the key growth drivers and market challenges?
-
Increase in mountain biking tourism for economic development, Rising cost of raw materials
-
-
Who are the major players in the Mountain Bike Market?
-
Alta Cycling Group, BH Bikes, Cycling Sports Group Inc., Deviate Cycles Ltd., Fuji Bikes, Giant Bicycle Inc., Kona Bicycle Co., Lapierre SA, Marin Mountain Bikes Inc., Merida Industry Co. Ltd., Norco Bicycles, Pending System GmbH and Co. KG, Pivot Cycles GmbH, Pon Holdings BV, Rocky Mountain Bicycles, Santa Cruz Bicycles LLC, Shenzhen Xidesheng Bicycle Co., Transition Bicycle Co., Trek Bicycle Corp. and Trinity Cycles Co. Ltd.
-
Market Research Insights
- Market dynamics are shaped by a convergence of consumer demand for versatility and technological innovation. The adoption rate for pro-level mountain bikes featuring advanced systems has increased by 18%, driven by a desire for high-performance components. Concurrently, the growth of direct-to-consumer brands has intensified price competition, leading to a 10% average reduction in retail costs for comparable custom bike builds.
- The expansion of lift-accessed bike parks has spurred a 25% increase in sales of specialized downhill bikes and freeride mountain bikes. This environment is compelling specialty bike shops to enhance their bike maintenance services and focus on experiential retail to retain market share against online competitors.
We can help! Our analysts can customize this mountain bike market research report to meet your requirements.
 RIA -
RIA - 
