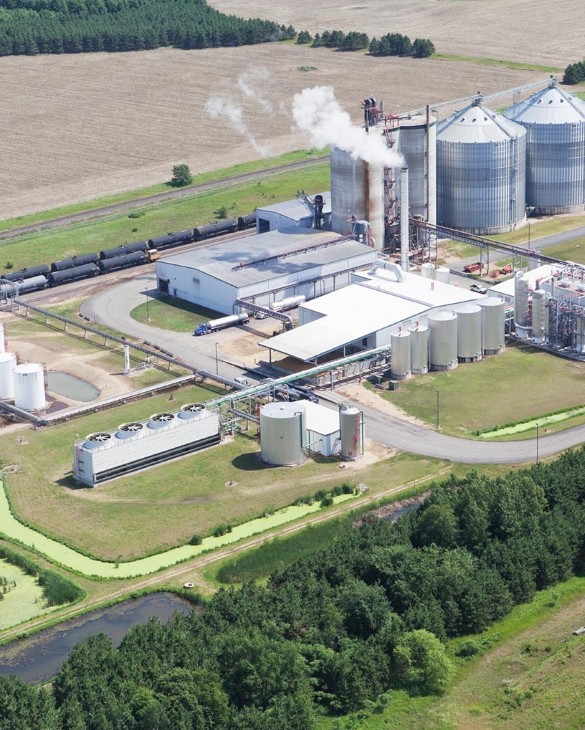
Biorefinery Market Analysis, Size, and Forecast 2026-2030: North America (US, Canada, and Mexico), Europe (Germany, UK, and France), APAC (China, Japan, and India), South America (Brazil, Argentina, and Chile), Middle East and Africa (Saudi Arabia, UAE, and South Africa), and Rest of World (ROW)

Biorefinery Market Analysis, Size, and Forecast 2026-2030:
North America (US, Canada, and Mexico), Europe (Germany, UK, and France), APAC (China, Japan, and India), South America (Brazil, Argentina, and Chile), Middle East and Africa (Saudi Arabia, UAE, and South Africa), and Rest of World (ROW)

Published: Oct 2026 308 Pages SKU: IRTNTR73152

Market Overview at a Glance

$902.11 Mn
Market Opportunity
12.8%
CAGR 2025 - 2030
61.5%
North America Growth
$491.69 Mn
Industrial biotechnology segment 2024

Biorefinery Market Size 2026-2030

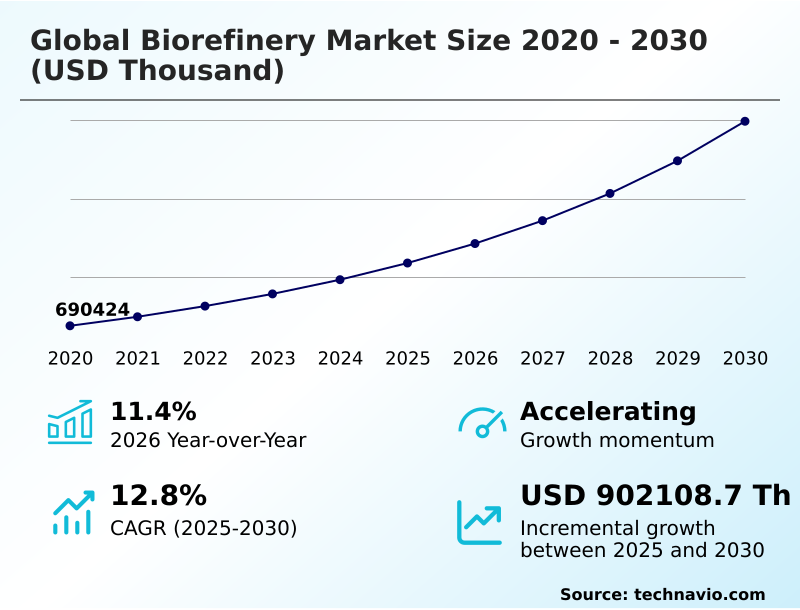
The biorefinery market size is valued to increase by USD 902.11 million, at a CAGR of 12.8% from 2025 to 2030. Accelerating decarbonization policies and renewable fuel mandates will drive the biorefinery market.

Major Market Trends & Insights

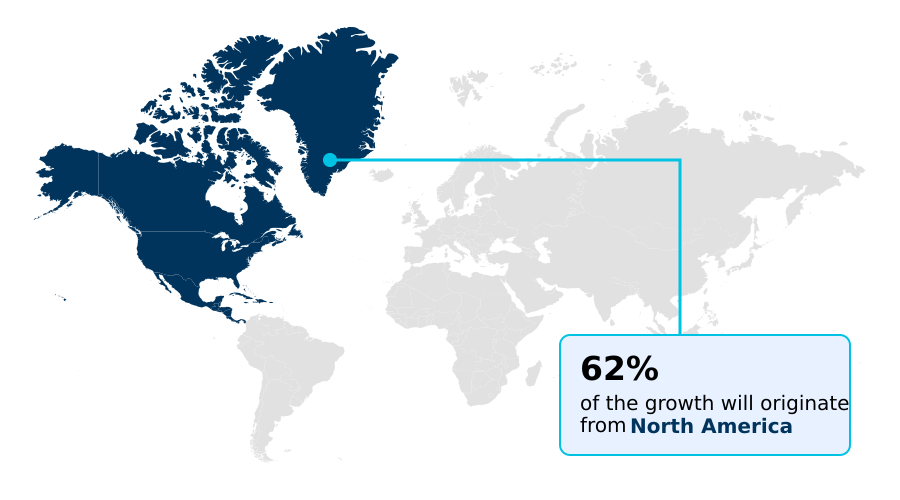
  • North America dominated the market and accounted for a 61.5% growth during the forecast period.
  • By Technology - Industrial biotechnology segment was valued at USD 491.69 million in 2024
  • By Feedstock - Starch and sugar crops segment accounted for the largest market revenue share in 2024

Market Size & Forecast

  • Market Opportunities:
  • Market Future Opportunities: USD 902.11 million
  • CAGR from 2025 to 2030 : 12.8%

Market Summary

  • The Biorefinery Market is undergoing a massive structural transformation as industrial manufacturers systematically transition from linear fossil-dependent processes to integrated, closed-loop biological production frameworks.
  • A fundamental operational driver is the stringent enforcement of regional low-carbon fuel standards, which compels transportation and logistics operators to blend sustainable aviation fuels and renewable diesel into their existing supply chains, thereby directly pulling demand for advanced biochemical processing.
  • For instance, automotive packaging suppliers are rapidly substituting traditional petrochemical resins with bio-based polymers to align with corporate Scope 3 emission targets, ensuring long-term supply chain compliance. This strategic shift has enabled advanced refining operations to improve overall lifecycle carbon efficiency by up to 45% compared to conventional crude processing facilities.
  • However, severe capital expenditure constraints and complex feedstock variability present significant scaling challenges, as inconsistent agricultural biomass requires continuous pretreatment recalibration. Overcoming these logistical bottlenecks demands sophisticated preprocessing depots to stabilize input streams, ensuring continuous reactor throughput and maintaining acceptable commercial profit margins across the evolving bioeconomy.

What will be the Size of the Biorefinery Market during the forecast period?
Get Key Insights on Market Forecast (PDF) Get Free Sample

How is the Biorefinery Market Segmented?

The biorefinery industry research report provides comprehensive data (region-wise segment analysis), with forecasts and estimates in "USD thousand" for the period 2026-2030, as well as historical data from 2020-2024 for the following segments.

  • Technology
    • Industrial biotechnology
    • Physico-chemical
    • Thermochemical
  • Feedstock
    • Starch and sugar crops
    • Organic and agricultural residues
    • Energy crops
    • Multi-feedstock
  • Product
    • Energy driven
    • Material driven
  • Geography
    • North America
      • US
      • Canada
      • Mexico
    • Europe
      • Germany
      • UK
      • France
      • Italy
      • Spain
      • The Netherlands
    • APAC
      • China
      • Japan
      • India
      • South Korea
      • Australia
      • Indonesia
    • South America
      • Brazil
      • Argentina
      • Chile
    • Middle East and Africa
      • Saudi Arabia
      • UAE
      • South Africa
      • Israel
      • Turkey

By Technology Insights

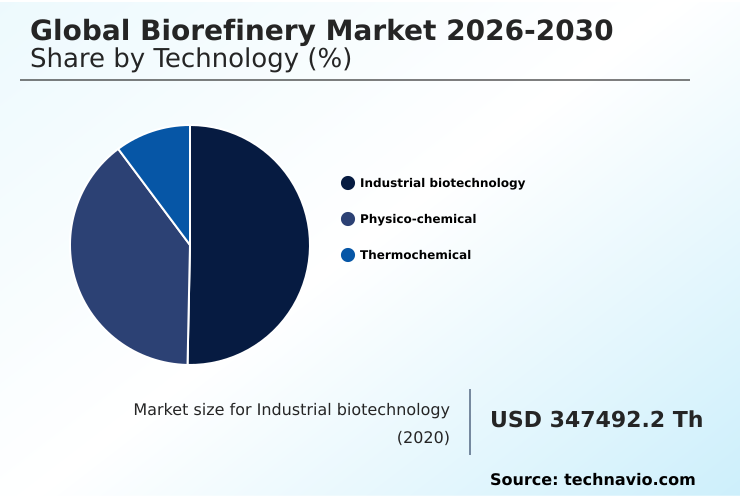
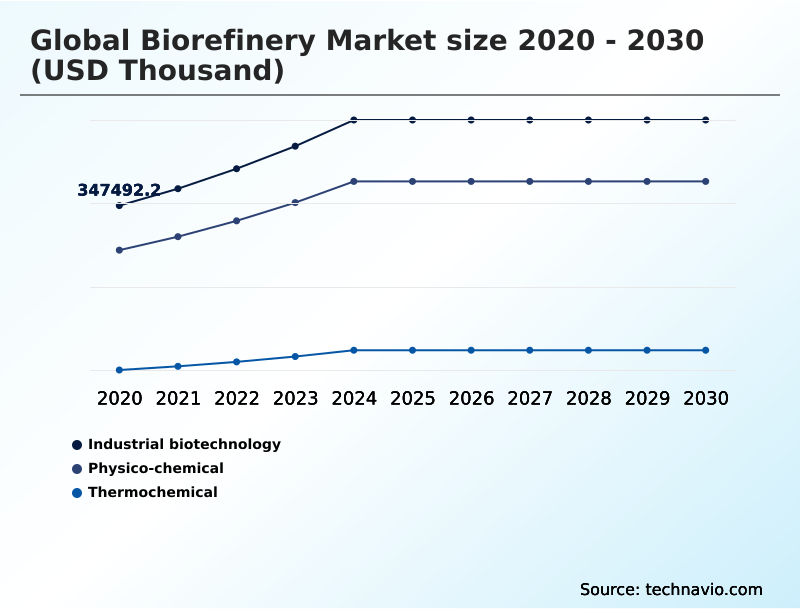
The industrial biotechnology segment is estimated to witness significant growth during the forecast period.

Industrial biotechnology transforms the Global Biorefinery Market 2026-2030 by shifting traditional fossil-dependent routes toward closed loop bio-based chemical production. The integration of heterogeneous catalyst development and advanced biomass conversion processes enables facilities to effectively manage agricultural residue valorization.

This operational shift directly lowers lifecycle greenhouse gas emissions, establishing highly compliant carbon intensity scoring for industrial manufacturers. By prioritizing closed-loop material cycles, operators transition away from first-generation inputs to focus on macroalgae processing and complex lignocellulosic structures.

Consequently, manufacturers scale up green ethylene capacity and hydroprocessed esters, yielding high-value bio-based platform chemicals. Replacing energy-intensive synthetic routes with precise biocatalytic mechanisms improves overall thermal energy efficiency by 35% compared to conventional petrochemical pathways.

This efficiency gain allows refining complexes to sustain continuous operations while drastically minimizing waste output.
Get Free Sample

The Industrial biotechnology segment was valued at USD 491.69 million in 2024 and showed a gradual increase during the forecast period.
Get Free Sample

Regional Analysis

North America is estimated to contribute 61.5% to the growth of the global market during the forecast period.Technavio’s analysts have elaborately explained the regional trends and drivers that shape the market during the forecast period.
See How Biorefinery Market Demand is Rising in North America Get Free Sample

The geographic landscape of the Global Biorefinery Market 2026-2030 reveals distinct structural variations in technology adoption and biomass utilization. North America currently dominates the deployment of sustainable aviation fuel and drop-in renewable fuels, heavily incentivized by stringent low-carbon fuel standards.

Conversely, Europe emphasizes municipal solid waste valorization and biomethane production, driven by aggressive circular bioeconomy mandates. These divergent regulatory frameworks result in a 25% higher adoption rate of anaerobic digestion and fluid-bed reactor optimization in Europe compared to the Americas.

In North America, the transition toward multi-feedstock biorefineries has enhanced production uptime by 18%, as facilities seamlessly shift between agricultural residues and energy crops.

To overcome complex raw material variances, operators globally are deploying precision enzymatic lignocellulosic hydrolysis solutions, which lower overall catalytic processing costs by 14%.

These strategic adaptations ensure continuous output of low-carbon liquid biofuels, solidifying the market's role in establishing long-term global energy security.

Market Dynamics

Our researchers analyzed the data with 2025 as the base year, along with the key drivers, trends, and challenges. A holistic analysis of drivers will help companies refine their marketing strategies to gain a competitive advantage.

  • The long-term commercial viability of the Global Biorefinery Market 2026-2030 relies heavily on overcoming intricate raw material logistics and scaling advanced transformation technologies. Establishing decentralized agricultural biomass preprocessing depots has become a critical supply chain strategy for modern operators.
  • By densifying and standardizing organic waste near the source of harvest, these depots significantly reduce transportation overhead and minimize the moisture-related degradation that historically plagued centralized processing models. As raw materials arrive at primary refining hubs, operators rely on continuous biological microbial fermentation pathways and integrated waste biomass thermochemical processing to maximize output yields.
  • This dual-pronged technological approach ensures that facilities can dynamically pivot between synthesizing liquid transportation fuels and extracting high-value biochemicals based on real-time commodity pricing. Transitioning from legacy batch processing to continuous biological extraction methods has yielded substantial operational improvements, with modern facilities demonstrating a nearly 30% reduction in equipment downtime compared to older, single-feedstock refinery models.
  • Furthermore, implementing precision enzymatic lignocellulosic hydrolysis solutions enables plants to effectively breakdown tough forestry residues without requiring excessive thermal energy. This continuous optimization fosters closed loop bio-based chemical production, allowing manufacturing industries to directly substitute fossil-derived polymers with sustainable alternatives.
  • Ultimately, these structural supply chain enhancements and processing innovations provide operators with the necessary margins to compete directly against deeply established petrochemical supply networks.
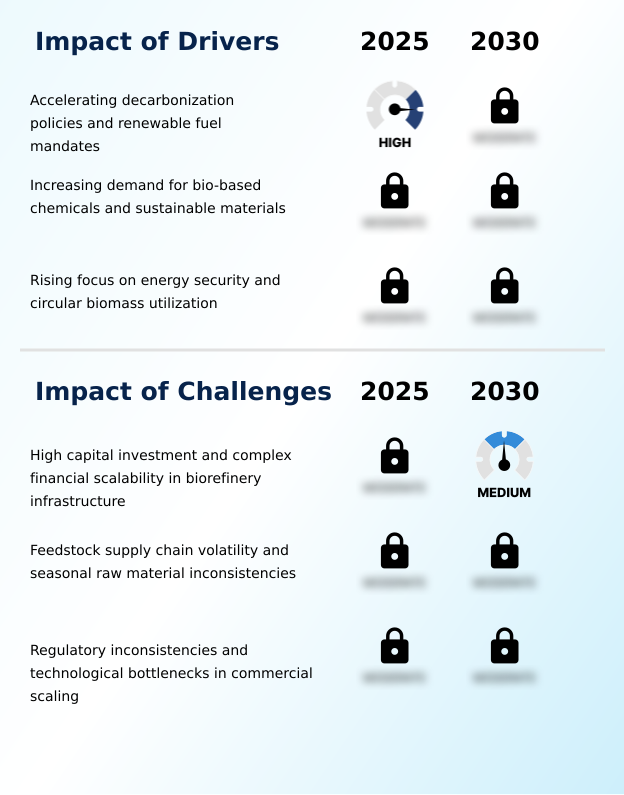
What are the key market drivers leading to the rise in the adoption of Biorefinery Industry?

  • Accelerating decarbonization policies and stringent renewable fuel mandates function as primary structural drivers propelling widespread industrial transition toward sustainable bio-based production.

  • Stringent low-carbon transportation mandates are aggressively driving the Global Biorefinery Market 2026-2030 by forcing logistics and aviation sectors to substitute conventional fuels with hydrotreated vegetable oil and renewable natural gas.
  • This immediate regulatory pressure catalyzes massive investments into waste-to-energy assets and continuous biological microbial fermentation pathways. By leveraging hydrothermal liquefaction and fast pyrolysis, operators effectively convert difficult municipal sludges into valuable energy commodities.
  • The implementation of advanced catalytic upgrading technologies and catalytic fractionation has reduced overall processing thermal energy consumption by 20%, significantly enhancing plant profit margins compared to older transesterification models.
  • As a direct result, manufacturers can reliably source high-purity bio-based polymer inputs for commercial packaging. Furthermore, the commercial scaling of microalgae biorefineries decreases freshwater usage by 35%, empowering corporations to meet aggressive environmental compliance targets while maintaining robust manufacturing output.

What are the market trends shaping the Biorefinery Industry?

  • Accelerating mandates for decarbonization and net-zero emission targets represent a prominent structural trend shaping the industry. This regulatory shift compels operators to transition toward renewable inputs and advanced processing methodologies.

  • The Global Biorefinery Market 2026-2030 is experiencing a rapid technological transition as operators integrate metabolic engineering and enzymatic hydrolysis to process complex lignocellulosic biomass. This shift occurs because environmental mandates strictly penalize the carbon footprints of traditional petroleum derivatives, compelling industries to adopt non-food feedstocks and organic solid waste.
  • By deploying advanced biochemical conversion methods and continuous fermentation systems within modern biorefining platforms, facilities have improved overall product yield efficiency by 22% compared to standard batch processing. Furthermore, implementing decentralized agricultural biomass preprocessing depots minimizes raw material transport degradation, cutting supply chain logistics costs by 15%.
  • This structural evolution directly enables manufacturers to maximize carbon sequestration capabilities and seamlessly output drop-in chemicals. Consequently, the expanding adoption of thermochemical gasification transforms variable waste streams into high-purity energy carriers, ensuring stable corporate compliance with international decarbonization regulations.

What challenges does the Biorefinery Industry face during its growth?

  • High capital investment requirements and complex financial scalability in advanced infrastructure remain significant challenges hindering the rapid commercialization of processing facilities.

  • Unpredictable raw material quality and extreme capital expenditure requirements remain critical structural bottlenecks within the Global Biorefinery Market 2026-2030. Integrating sophisticated biomass processing systems and synthetic biology platforms requires heavy upfront financial commitments, deterring immediate scalability. Because seasonal moisture variations severely disrupt second-generation processing, operators face frequent recalibrations during integrated waste biomass thermochemical processing.
  • These supply inconsistencies frequently reduce synthesis gas production efficiency by up to 18%, forcing facilities to operate below optimal capacity. Consequently, the complex purification of drop-in biochemicals and bioplastics precursors, such as bio-succinic acid and polyhydroxyalkanoates, demands intense thermal energy, raising total operational costs by 24% compared to linear fossil extraction.
  • To stabilize these output fluctuations, plants must continuously invest in advanced biocatalysis and complex lignin recovery infrastructure, tightening overall commercial profit margins in volatile commodity environments.

Exclusive Technavio Analysis on Customer Landscape

The biorefinery market forecasting report includes the adoption lifecycle of the market, covering from the innovator’s stage to the laggard’s stage. It focuses on adoption rates in different regions based on penetration. Furthermore, the biorefinery market report also includes key purchase criteria and drivers of price sensitivity to help companies evaluate and develop their market growth analysis strategies.
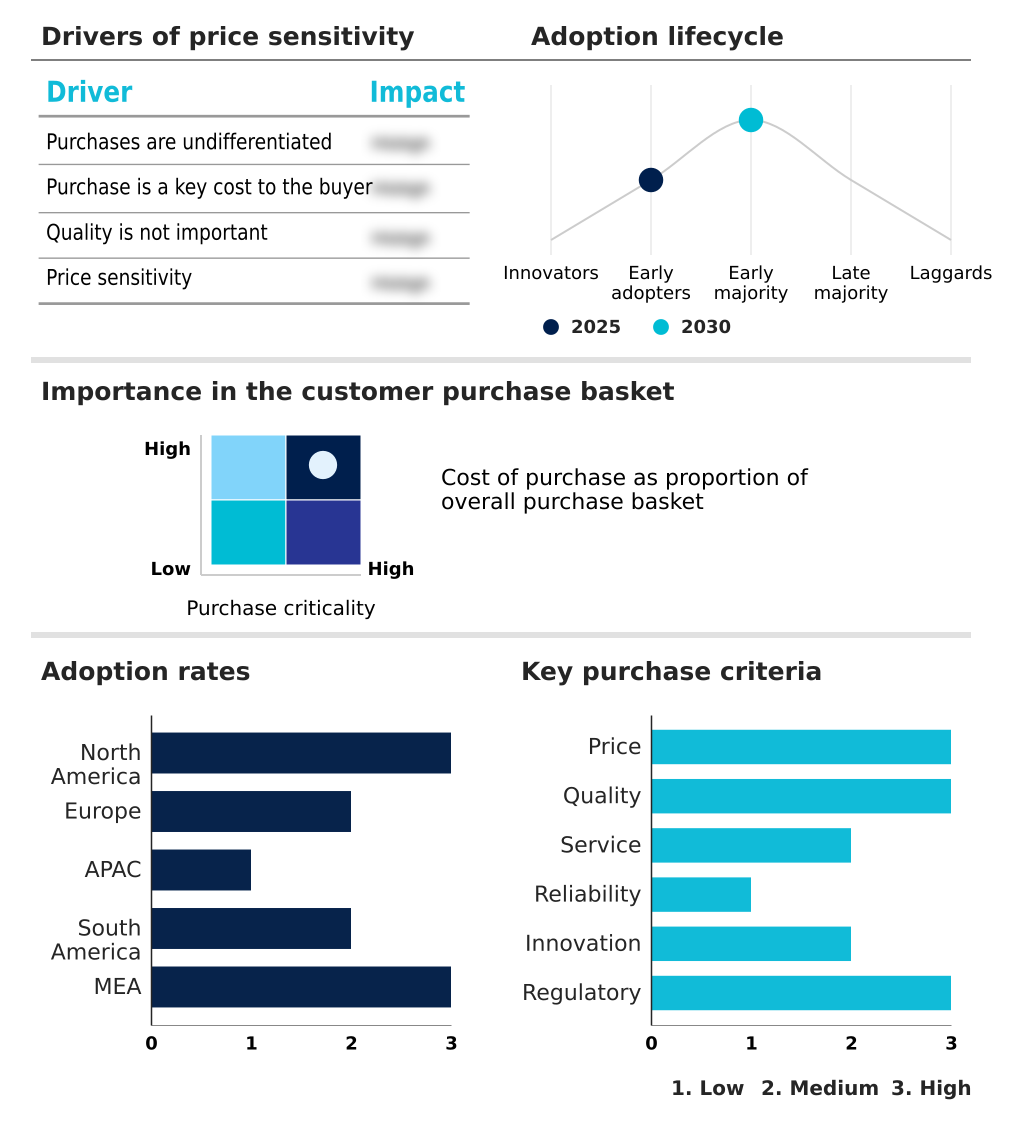
Customer Landscape of Biorefinery Industry

Competitive Landscape

Companies are implementing various strategies, such as strategic alliances, biorefinery market forecast, partnerships, mergers and acquisitions, geographical expansion, and product/service launches, to enhance their presence in the industry.

Andritz AG - The biorefinery sector provides advanced separation technologies, continuous fermentation platforms, and specialized catalytic upgrading equipment to accelerate decarbonization efforts across the global energy and manufacturing industries.

The industry research and growth report includes detailed analyses of the competitive landscape of the market and information about key companies, including:

  • Andritz AG
  • Archer Daniels Midland Co.
  • Axens Group
  • Borregaard ASA
  • Cargill Inc.
  • Clariant International Ltd.
  • DSM Firmenich AG
  • Eni SpA
  • Green Plains Inc.
  • Honeywell International Inc.
  • LanzaTech Global Inc.
  • Metsa Group
  • Neste Corp.
  • Novonesis Group
  • Praj Industries Ltd.
  • Raizen Energia SA
  • Stora Enso Oyj
  • TotalEnergies SE
  • UPM Kymmene Corp.
  • Valmet Oyj

Qualitative and quantitative analysis of companies has been conducted to help clients understand the wider business environment as well as the strengths and weaknesses of key industry players. Data is qualitatively analyzed to categorize companies as pure play, category-focused, industry-focused, and diversified; it is quantitatively analyzed to categorize companies as dominant, leading, strong, tentative, and weak.

Recent Development and News in Biorefinery market

  • In the Oil and Gas Refining and Marketing industry, the enforcement of stringent marine bunker fuel sulfur restrictions under MARPOL regulations has shifted feedstock processing toward low-sulfur inputs, directly impacting Biorefinery demand by accelerating the integration of hydrotreated vegetable oil into marine supply chains.
  • In the Oil and Gas Refining and Marketing industry, the optimization of fluid catalytic cracking units to process heavier and sourer crude blends has increased operational complexity, driving traditional refiners to co-process lignocellulosic biomass and municipal solid waste to offset regional carbon penalties.
  • In the Oil and Gas Refining and Marketing industry, the global implementation of lifecycle carbon reduction mandates has forced operators to reduce overall greenhouse gas emissions by 15% across primary refining networks, pulling significant capital investment into drop-in renewable fuels and bio-succinic acid production within advanced biorefining platforms.
  • In the Oil and Gas Refining and Marketing industry, the standardization of predictive maintenance software across downstream processing assets has improved total refinery throughput efficiency by 12%, enabling Biorefinery operators to optimize complex biochemical conversion methods and continuous fermentation systems for higher yield stability.

Dive into Technavio’s robust research methodology, blending expert interviews, extensive data synthesis, and validated models for unparalleled Biorefinery Market insights. See full methodology.

Market Scope
Page number 308
Base year 2025
Historic period 2020-2024
Forecast period 2026-2030
Growth momentum & CAGR Accelerate at a CAGR of 12.8%
Market growth 2026-2030 USD 902108.7 thousand
Market structure Fragmented
YoY growth 2025-2026(%) 11.4%
Key countries US, Canada, Mexico, Germany, UK, France, Italy, Spain, The Netherlands, China, Japan, India, South Korea, Australia, Indonesia, Brazil, Argentina, Chile, Saudi Arabia, UAE, South Africa, Israel and Turkey
Competitive landscape Leading Companies, Market Positioning of Companies, Competitive Strategies, and Industry Risks

Request Free Sample

Research Analyst Overview

  • The Global Biorefinery Market 2026-2030 represents a fundamental shift in how global manufacturing and transportation sectors secure core raw materials and energy carriers. Industrial facilities are continuously evolving from simple ethanol production toward highly integrated, multiproduct biochemical complexes. The aggressive transition from first-generation starch inputs to complex lignocellulosic agricultural residues forces operators to continuously refine their pretreatment and hydrolysis protocols.
  • By implementing advanced digital twin monitoring and real-time kinetic sensing, modern biorefining platforms have achieved a 28% reduction in unplanned thermal reactor downtime compared to legacy configurations. This precise operational control directly impacts corporate compliance strategies, enabling companies to definitively trace and lower their Scope 3 greenhouse gas emissions.
  • As geopolitical volatility disrupts traditional petroleum supply lines, securing localized, continuous biological supply chains becomes a top-tier boardroom priority. Consequently, industrial leaders are accelerating capital investments into thermochemical gasification and fast pyrolysis architectures to produce high-value bioplastics precursors and sustainable aviation fuels. This ongoing industrial alignment seamlessly bridges environmental stewardship with robust, localized energy security.

What are the Key Data Covered in this Biorefinery Market Research and Growth Report?

  • What is the expected growth of the Biorefinery Market between 2026 and 2030?

    • USD 902.11 million, at a CAGR of 12.8%

  • What segmentation does the market report cover?

    • The report is segmented by Technology (Industrial biotechnology, Physico-chemical, and Thermochemical), Feedstock (Starch and sugar crops, Organic and agricultural residues, Energy crops, and Multi-feedstock), Product (Energy driven, and Material driven) and Geography (North America, Europe, APAC, South America, Middle East and Africa)

  • Which regions are analyzed in the report?

    • North America, Europe, APAC, South America and Middle East and Africa

  • What are the key growth drivers and market challenges?

    • Accelerating decarbonization policies and renewable fuel mandates, High capital investment and complex financial scalability in biorefinery infrastructure

  • Who are the major players in the Biorefinery Market?

    • Andritz AG, Archer Daniels Midland Co., Axens Group, Borregaard ASA, Cargill Inc., Clariant International Ltd., DSM Firmenich AG, Eni SpA, Green Plains Inc., Honeywell International Inc., LanzaTech Global Inc., Metsa Group, Neste Corp., Novonesis Group, Praj Industries Ltd., Raizen Energia SA, Stora Enso Oyj, TotalEnergies SE, UPM Kymmene Corp. and Valmet Oyj

Market Research Insights

  • The Biorefinery Market is accelerating the global energy transition by integrating advanced biomass processing systems and biochemical conversion methods into existing industrial infrastructures. Operators are optimizing lignin recovery and focusing on multi-feedstock biorefineries to ensure continuous material supply regardless of seasonal agricultural disruptions.
  • By adopting these flexible architectures, facilities have reduced raw material logistics costs by 18% and improved total thermal efficiency by 22% compared to single-feedstock models. These operational enhancements drive higher output volumes of renewable natural gas and low-carbon liquid biofuels. Consequently, industrial manufacturers secure critical supply chain resilience and achieve strict carbon compliance, transforming waste streams into high-value energy commodities.

We can help! Our analysts can customize this biorefinery market research report to meet your requirements.

Get in touch

1. Executive Summary

1.1 Market overview

Executive Summary - Chart on Market Overview
Executive Summary - Data Table on Market Overview
Executive Summary - Chart on Global Market Characteristics
Executive Summary - Chart on Market by Geography
Executive Summary - Chart on Market Segmentation by Technology
Executive Summary - Chart on Market Segmentation by Feedstock
Executive Summary - Chart on Market Segmentation by Product
Executive Summary - Chart on Incremental Growth
Executive Summary - Data Table on Incremental Growth
Executive Summary - Chart on Company Market Positioning

2. Technavio Analysis

2.1 Analysis of price sensitivity, lifecycle, customer purchase basket, adoption rates, and purchase criteria

2.2 Criticality of inputs and Factors of differentiation

Chart on Overview on criticality of inputs and factors of differentiation

2.3 Factors of disruption

Chart on Overview on factors of disruption

2.4 Impact of drivers and challenges

Chart on Impact of drivers and challenges in 2025 and 2030

3. Market Landscape

3.1 Market ecosystem

Chart on Parent Market
Data Table on - Parent Market

3.2 Market characteristics

Chart on Market characteristics analysis

3.3 Value chain analysis

Chart on Value chain analysis

4. Market Sizing

4.1 Market definition

Data Table on Offerings of companies included in the market definition

4.2 Market segment analysis

Market segments

4.3 Market size 2025

4.4 Market outlook: Forecast for 2025-2030

Chart on Global - Market size and forecast 2025-2030 ($ thousand)
Data Table on Global - Market size and forecast 2025-2030 ($ thousand)
Chart on Global Market: Year-over-year growth 2025-2030 (%)
Data Table on Global Market: Year-over-year growth 2025-2030 (%)

5. Historic Market Size

5.1 Global Biorefinery Market 2020 - 2024

Historic Market Size - Data Table on Global Biorefinery Market 2020 - 2024 ($ thousand)

5.2 Technology segment analysis 2020 - 2024

Historic Market Size - Technology Segment 2020 - 2024 ($ thousand)

5.3 Feedstock segment analysis 2020 - 2024

Historic Market Size - Feedstock Segment 2020 - 2024 ($ thousand)

5.4 Product segment analysis 2020 - 2024

Historic Market Size - Product Segment 2020 - 2024 ($ thousand)

5.5 Geography segment analysis 2020 - 2024

Historic Market Size - Geography Segment 2020 - 2024 ($ thousand)

5.6 Country segment analysis 2020 - 2024

Historic Market Size - Country Segment 2020 - 2024 ($ thousand)

6. Qualitative Analysis

6.1 Impact of AI on Global Biorefinery Market

6.2 Impact of geopolitical conflict for global biorefinery market

7. Five Forces Analysis

7.1 Five forces summary

Five forces analysis - Comparison between 2025 and 2030

7.2 Bargaining power of buyers

Bargaining power of buyers - Impact of key factors 2025 and 2030

7.3 Bargaining power of suppliers

Bargaining power of suppliers - Impact of key factors in 2025 and 2030

7.4 Threat of new entrants

Threat of new entrants - Impact of key factors in 2025 and 2030

7.5 Threat of substitutes

Threat of substitutes - Impact of key factors in 2025 and 2030

7.6 Threat of rivalry

Threat of rivalry - Impact of key factors in 2025 and 2030

7.7 Market condition

Chart on Market condition - Five forces 2025 and 2030

8. Market Segmentation by Technology

8.1 Market segments

Chart on Technology - Market share 2025-2030 (%)
Data Table on Technology - Market share 2025-2030 (%)

8.2 Comparison by Technology

Chart on Comparison by Technology
Data Table on Comparison by Technology

8.3 Industrial biotechnology - Market size and forecast 2025-2030

Chart on Industrial biotechnology - Market size and forecast 2025-2030 ($ thousand)
Data Table on Industrial biotechnology - Market size and forecast 2025-2030 ($ thousand)
Chart on Industrial biotechnology - Year-over-year growth 2025-2030 (%)
Data Table on Industrial biotechnology - Year-over-year growth 2025-2030 (%)

8.4 Physico-chemical - Market size and forecast 2025-2030

Chart on Physico-chemical - Market size and forecast 2025-2030 ($ thousand)
Data Table on Physico-chemical - Market size and forecast 2025-2030 ($ thousand)
Chart on Physico-chemical - Year-over-year growth 2025-2030 (%)
Data Table on Physico-chemical - Year-over-year growth 2025-2030 (%)

8.5 Thermochemical - Market size and forecast 2025-2030

Chart on Thermochemical - Market size and forecast 2025-2030 ($ thousand)
Data Table on Thermochemical - Market size and forecast 2025-2030 ($ thousand)
Chart on Thermochemical - Year-over-year growth 2025-2030 (%)
Data Table on Thermochemical - Year-over-year growth 2025-2030 (%)

8.6 Market opportunity by Technology

Market opportunity by Technology ($ thousand)
Data Table on Market opportunity by Technology ($ thousand)

9. Market Segmentation by Feedstock

9.1 Market segments

Chart on Feedstock - Market share 2025-2030 (%)
Data Table on Feedstock - Market share 2025-2030 (%)

9.2 Comparison by Feedstock

Chart on Comparison by Feedstock
Data Table on Comparison by Feedstock

9.3 Starch and sugar crops - Market size and forecast 2025-2030

Chart on Starch and sugar crops - Market size and forecast 2025-2030 ($ thousand)
Data Table on Starch and sugar crops - Market size and forecast 2025-2030 ($ thousand)
Chart on Starch and sugar crops - Year-over-year growth 2025-2030 (%)
Data Table on Starch and sugar crops - Year-over-year growth 2025-2030 (%)

9.4 Organic and agricultural residues - Market size and forecast 2025-2030

Chart on Organic and agricultural residues - Market size and forecast 2025-2030 ($ thousand)
Data Table on Organic and agricultural residues - Market size and forecast 2025-2030 ($ thousand)
Chart on Organic and agricultural residues - Year-over-year growth 2025-2030 (%)
Data Table on Organic and agricultural residues - Year-over-year growth 2025-2030 (%)

9.5 Energy crops - Market size and forecast 2025-2030

Chart on Energy crops - Market size and forecast 2025-2030 ($ thousand)
Data Table on Energy crops - Market size and forecast 2025-2030 ($ thousand)
Chart on Energy crops - Year-over-year growth 2025-2030 (%)
Data Table on Energy crops - Year-over-year growth 2025-2030 (%)

9.6 Multi-feedstock - Market size and forecast 2025-2030

Chart on Multi-feedstock - Market size and forecast 2025-2030 ($ thousand)
Data Table on Multi-feedstock - Market size and forecast 2025-2030 ($ thousand)
Chart on Multi-feedstock - Year-over-year growth 2025-2030 (%)
Data Table on Multi-feedstock - Year-over-year growth 2025-2030 (%)

9.7 Market opportunity by Feedstock

Market opportunity by Feedstock ($ thousand)
Data Table on Market opportunity by Feedstock ($ thousand)

10. Market Segmentation by Product

10.1 Market segments

Chart on Product - Market share 2025-2030 (%)
Data Table on Product - Market share 2025-2030 (%)

10.2 Comparison by Product

Chart on Comparison by Product
Data Table on Comparison by Product

10.3 Energy driven - Market size and forecast 2025-2030

Chart on Energy driven - Market size and forecast 2025-2030 ($ thousand)
Data Table on Energy driven - Market size and forecast 2025-2030 ($ thousand)
Chart on Energy driven - Year-over-year growth 2025-2030 (%)
Data Table on Energy driven - Year-over-year growth 2025-2030 (%)

10.4 Material driven - Market size and forecast 2025-2030

Chart on Material driven - Market size and forecast 2025-2030 ($ thousand)
Data Table on Material driven - Market size and forecast 2025-2030 ($ thousand)
Chart on Material driven - Year-over-year growth 2025-2030 (%)
Data Table on Material driven - Year-over-year growth 2025-2030 (%)

10.5 Market opportunity by Product

Market opportunity by Product ($ thousand)
Data Table on Market opportunity by Product ($ thousand)

11. Customer Landscape

11.1 Customer landscape overview

Analysis of price sensitivity, lifecycle, customer purchase basket, adoption rates, and purchase criteria

12. Geographic Landscape

12.1 Geographic segmentation

Chart on Market share by geography 2025-2030 (%)
Data Table on Market share by geography 2025-2030 (%)

12.2 Geographic comparison

Chart on Geographic comparison
Data Table on Geographic comparison

12.3 North America - Market size and forecast 2025-2030

Chart on North America - Market size and forecast 2025-2030 ($ thousand)
Data Table on North America - Market size and forecast 2025-2030 ($ thousand)
Chart on North America - Year-over-year growth 2025-2030 (%)
Data Table on North America - Year-over-year growth 2025-2030 (%)
Chart on Regional Comparison - North America
Data Table on Regional Comparison - North America

12.3.1 US - Market size and forecast 2025-2030

Chart on US - Market size and forecast 2025-2030 ($ thousand)
Data Table on US - Market size and forecast 2025-2030 ($ thousand)
Chart on US - Year-over-year growth 2025-2030 (%)
Data Table on US - Year-over-year growth 2025-2030 (%)

12.3.2 Canada - Market size and forecast 2025-2030

Chart on Canada - Market size and forecast 2025-2030 ($ thousand)
Data Table on Canada - Market size and forecast 2025-2030 ($ thousand)
Chart on Canada - Year-over-year growth 2025-2030 (%)
Data Table on Canada - Year-over-year growth 2025-2030 (%)

12.3.3 Mexico - Market size and forecast 2025-2030

Chart on Mexico - Market size and forecast 2025-2030 ($ thousand)
Data Table on Mexico - Market size and forecast 2025-2030 ($ thousand)
Chart on Mexico - Year-over-year growth 2025-2030 (%)
Data Table on Mexico - Year-over-year growth 2025-2030 (%)

12.4 Europe - Market size and forecast 2025-2030

Chart on Europe - Market size and forecast 2025-2030 ($ thousand)
Data Table on Europe - Market size and forecast 2025-2030 ($ thousand)
Chart on Europe - Year-over-year growth 2025-2030 (%)
Data Table on Europe - Year-over-year growth 2025-2030 (%)
Chart on Regional Comparison - Europe
Data Table on Regional Comparison - Europe

12.4.1 Germany - Market size and forecast 2025-2030

Chart on Germany - Market size and forecast 2025-2030 ($ thousand)
Data Table on Germany - Market size and forecast 2025-2030 ($ thousand)
Chart on Germany - Year-over-year growth 2025-2030 (%)
Data Table on Germany - Year-over-year growth 2025-2030 (%)

12.4.2 UK - Market size and forecast 2025-2030

Chart on UK - Market size and forecast 2025-2030 ($ thousand)
Data Table on UK - Market size and forecast 2025-2030 ($ thousand)
Chart on UK - Year-over-year growth 2025-2030 (%)
Data Table on UK - Year-over-year growth 2025-2030 (%)

12.4.3 France - Market size and forecast 2025-2030

Chart on France - Market size and forecast 2025-2030 ($ thousand)
Data Table on France - Market size and forecast 2025-2030 ($ thousand)
Chart on France - Year-over-year growth 2025-2030 (%)
Data Table on France - Year-over-year growth 2025-2030 (%)

12.4.4 Italy - Market size and forecast 2025-2030

Chart on Italy - Market size and forecast 2025-2030 ($ thousand)
Data Table on Italy - Market size and forecast 2025-2030 ($ thousand)
Chart on Italy - Year-over-year growth 2025-2030 (%)
Data Table on Italy - Year-over-year growth 2025-2030 (%)

12.4.5 Spain - Market size and forecast 2025-2030

Chart on Spain - Market size and forecast 2025-2030 ($ thousand)
Data Table on Spain - Market size and forecast 2025-2030 ($ thousand)
Chart on Spain - Year-over-year growth 2025-2030 (%)
Data Table on Spain - Year-over-year growth 2025-2030 (%)

12.4.6 The Netherlands - Market size and forecast 2025-2030

Chart on The Netherlands - Market size and forecast 2025-2030 ($ thousand)
Data Table on The Netherlands - Market size and forecast 2025-2030 ($ thousand)
Chart on The Netherlands - Year-over-year growth 2025-2030 (%)
Data Table on The Netherlands - Year-over-year growth 2025-2030 (%)

12.5 APAC - Market size and forecast 2025-2030

Chart on APAC - Market size and forecast 2025-2030 ($ thousand)
Data Table on APAC - Market size and forecast 2025-2030 ($ thousand)
Chart on APAC - Year-over-year growth 2025-2030 (%)
Data Table on APAC - Year-over-year growth 2025-2030 (%)
Chart on Regional Comparison - APAC
Data Table on Regional Comparison - APAC

12.5.1 China - Market size and forecast 2025-2030

Chart on China - Market size and forecast 2025-2030 ($ thousand)
Data Table on China - Market size and forecast 2025-2030 ($ thousand)
Chart on China - Year-over-year growth 2025-2030 (%)
Data Table on China - Year-over-year growth 2025-2030 (%)

12.5.2 Japan - Market size and forecast 2025-2030

Chart on Japan - Market size and forecast 2025-2030 ($ thousand)
Data Table on Japan - Market size and forecast 2025-2030 ($ thousand)
Chart on Japan - Year-over-year growth 2025-2030 (%)
Data Table on Japan - Year-over-year growth 2025-2030 (%)

12.5.3 India - Market size and forecast 2025-2030

Chart on India - Market size and forecast 2025-2030 ($ thousand)
Data Table on India - Market size and forecast 2025-2030 ($ thousand)
Chart on India - Year-over-year growth 2025-2030 (%)
Data Table on India - Year-over-year growth 2025-2030 (%)

12.5.4 South Korea - Market size and forecast 2025-2030

Chart on South Korea - Market size and forecast 2025-2030 ($ thousand)
Data Table on South Korea - Market size and forecast 2025-2030 ($ thousand)
Chart on South Korea - Year-over-year growth 2025-2030 (%)
Data Table on South Korea - Year-over-year growth 2025-2030 (%)

12.5.5 Australia - Market size and forecast 2025-2030

Chart on Australia - Market size and forecast 2025-2030 ($ thousand)
Data Table on Australia - Market size and forecast 2025-2030 ($ thousand)
Chart on Australia - Year-over-year growth 2025-2030 (%)
Data Table on Australia - Year-over-year growth 2025-2030 (%)

12.5.6 Indonesia - Market size and forecast 2025-2030

Chart on Indonesia - Market size and forecast 2025-2030 ($ thousand)
Data Table on Indonesia - Market size and forecast 2025-2030 ($ thousand)
Chart on Indonesia - Year-over-year growth 2025-2030 (%)
Data Table on Indonesia - Year-over-year growth 2025-2030 (%)

12.6 South America - Market size and forecast 2025-2030

Chart on South America - Market size and forecast 2025-2030 ($ thousand)
Data Table on South America - Market size and forecast 2025-2030 ($ thousand)
Chart on South America - Year-over-year growth 2025-2030 (%)
Data Table on South America - Year-over-year growth 2025-2030 (%)
Chart on Regional Comparison - South America
Data Table on Regional Comparison - South America

12.6.1 Brazil - Market size and forecast 2025-2030

Chart on Brazil - Market size and forecast 2025-2030 ($ thousand)
Data Table on Brazil - Market size and forecast 2025-2030 ($ thousand)
Chart on Brazil - Year-over-year growth 2025-2030 (%)
Data Table on Brazil - Year-over-year growth 2025-2030 (%)

12.6.2 Argentina - Market size and forecast 2025-2030

Chart on Argentina - Market size and forecast 2025-2030 ($ thousand)
Data Table on Argentina - Market size and forecast 2025-2030 ($ thousand)
Chart on Argentina - Year-over-year growth 2025-2030 (%)
Data Table on Argentina - Year-over-year growth 2025-2030 (%)

12.6.3 Chile - Market size and forecast 2025-2030

Chart on Chile - Market size and forecast 2025-2030 ($ thousand)
Data Table on Chile - Market size and forecast 2025-2030 ($ thousand)
Chart on Chile - Year-over-year growth 2025-2030 (%)
Data Table on Chile - Year-over-year growth 2025-2030 (%)

12.7 Middle East and Africa - Market size and forecast 2025-2030

Chart on Middle East and Africa - Market size and forecast 2025-2030 ($ thousand)
Data Table on Middle East and Africa - Market size and forecast 2025-2030 ($ thousand)
Chart on Middle East and Africa - Year-over-year growth 2025-2030 (%)
Data Table on Middle East and Africa - Year-over-year growth 2025-2030 (%)
Chart on Regional Comparison - Middle East and Africa
Data Table on Regional Comparison - Middle East and Africa

12.7.1 Saudi Arabia - Market size and forecast 2025-2030

Chart on Saudi Arabia - Market size and forecast 2025-2030 ($ thousand)
Data Table on Saudi Arabia - Market size and forecast 2025-2030 ($ thousand)
Chart on Saudi Arabia - Year-over-year growth 2025-2030 (%)
Data Table on Saudi Arabia - Year-over-year growth 2025-2030 (%)

12.7.2 UAE - Market size and forecast 2025-2030

Chart on UAE - Market size and forecast 2025-2030 ($ thousand)
Data Table on UAE - Market size and forecast 2025-2030 ($ thousand)
Chart on UAE - Year-over-year growth 2025-2030 (%)
Data Table on UAE - Year-over-year growth 2025-2030 (%)

12.7.3 South Africa - Market size and forecast 2025-2030

Chart on South Africa - Market size and forecast 2025-2030 ($ thousand)
Data Table on South Africa - Market size and forecast 2025-2030 ($ thousand)
Chart on South Africa - Year-over-year growth 2025-2030 (%)
Data Table on South Africa - Year-over-year growth 2025-2030 (%)

12.7.4 Israel - Market size and forecast 2025-2030

Chart on Israel - Market size and forecast 2025-2030 ($ thousand)
Data Table on Israel - Market size and forecast 2025-2030 ($ thousand)
Chart on Israel - Year-over-year growth 2025-2030 (%)
Data Table on Israel - Year-over-year growth 2025-2030 (%)

12.7.5 Turkey - Market size and forecast 2025-2030

Chart on Turkey - Market size and forecast 2025-2030 ($ thousand)
Data Table on Turkey - Market size and forecast 2025-2030 ($ thousand)
Chart on Turkey - Year-over-year growth 2025-2030 (%)
Data Table on Turkey - Year-over-year growth 2025-2030 (%)

12.8 Market opportunity by geography

Market opportunity by geography ($ thousand)
Data Tables on Market opportunity by geography ($ thousand)

13. Drivers, Challenges, and Opportunity

13.1 Market drivers

Accelerating decarbonization policies and renewable fuel mandates
Increasing demand for bio-based chemicals and sustainable materials
Rising focus on energy security and circular biomass utilization

13.2 Market challenges

High capital investment and complex financial scalability in biorefinery infrastructure
Feedstock supply chain volatility and seasonal raw material inconsistencies
Regulatory inconsistencies and technological bottlenecks in commercial scaling

13.3 Impact of drivers and challenges

Impact of drivers and challenges in 2025 and 2030

13.4 Market opportunities

Accelerating mandates for decarbonization and net-zero emission targets
Technological advancements in second- and third-generation conversion technologies
Transition towards bio-based circular economy and supply chain security

14. Competitive Landscape

14.1 Overview

14.2

Overview on criticality of inputs and factors of differentiation

14.3 Landscape disruption

Overview on factors of disruption

14.4 Industry risks

Impact of key risks on business

15. Competitive Analysis

15.1 Companies profiled

Companies covered

15.2 Company ranking index

15.3 Market positioning of companies

Matrix on companies position and classification

15.4 Andritz AG

Andritz AG - Overview
Andritz AG - Business segments
Andritz AG - Key news
Andritz AG - Key offerings
Andritz AG - Segment focus
SWOT

15.5 Archer Daniels Midland Co.

Archer Daniels Midland Co. - Overview
Archer Daniels Midland Co. - Business segments
Archer Daniels Midland Co. - Key news
Archer Daniels Midland Co. - Key offerings
Archer Daniels Midland Co. - Segment focus
SWOT

15.6 Borregaard ASA

Borregaard ASA - Overview
Borregaard ASA - Business segments
Borregaard ASA - Key offerings
Borregaard ASA - Segment focus
SWOT

15.7 Clariant International Ltd.

Clariant International Ltd. - Overview
Clariant International Ltd. - Business segments
Clariant International Ltd. - Key offerings
Clariant International Ltd. - Segment focus
SWOT

15.8 DSM Firmenich AG

DSM Firmenich AG - Overview
DSM Firmenich AG - Business segments
DSM Firmenich AG - Key offerings
DSM Firmenich AG - Segment focus
SWOT

15.9 Eni SpA

Eni SpA - Overview
Eni SpA - Business segments
Eni SpA - Key offerings
Eni SpA - Segment focus
SWOT

15.10 Green Plains Inc.

Green Plains Inc. - Overview
Green Plains Inc. - Business segments
Green Plains Inc. - Key offerings
Green Plains Inc. - Segment focus
SWOT

15.11 Honeywell International Inc.

Honeywell International Inc. - Overview
Honeywell International Inc. - Business segments
Honeywell International Inc. - Key news
Honeywell International Inc. - Key offerings
Honeywell International Inc. - Segment focus
SWOT

15.12 Neste Corp.

Neste Corp. - Overview
Neste Corp. - Business segments
Neste Corp. - Key offerings
Neste Corp. - Segment focus
SWOT

15.13 Praj Industries Ltd.

Praj Industries Ltd. - Overview
Praj Industries Ltd. - Product / Service
Praj Industries Ltd. - Key offerings
SWOT

15.14 Raizen Energia SA

Raizen Energia SA - Overview
Raizen Energia SA - Product / Service
Raizen Energia SA - Key offerings
SWOT

15.15 Stora Enso Oyj

Stora Enso Oyj - Overview
Stora Enso Oyj - Business segments
Stora Enso Oyj - Key news
Stora Enso Oyj - Key offerings
Stora Enso Oyj - Segment focus
SWOT

15.16 TotalEnergies SE

TotalEnergies SE - Overview
TotalEnergies SE - Business segments
TotalEnergies SE - Key news
TotalEnergies SE - Key offerings
TotalEnergies SE - Segment focus
SWOT

15.17 UPM Kymmene Corp.

UPM Kymmene Corp. - Overview
UPM Kymmene Corp. - Business segments
UPM Kymmene Corp. - Key offerings
UPM Kymmene Corp. - Segment focus
SWOT

15.18 Valmet Oyj

Valmet Oyj - Overview
Valmet Oyj - Business segments
Valmet Oyj - Key offerings
Valmet Oyj - Segment focus
SWOT

16. Appendix

16.1 Scope of the report

Market definition
Objectives
Notes and caveats

16.2 Inclusions and exclusions checklist

Inclusions checklist
Exclusions checklist

16.3 Currency conversion rates for US$

16.4 Research methodology

16.5 Data procurement

Information sources

16.6 Data validation

16.7 Validation techniques employed for market sizing

16.8 Data synthesis

16.9 360 degree market analysis

16.10 List of abbreviations

Research Methodology

Technavio presents a detailed picture of the market by way of study, synthesis, and summation of data from multiple sources. The analysts have presented the various facets of the market with a particular focus on identifying the key industry influencers. The data thus presented is comprehensive, reliable, and the result of extensive research, both primary and secondary.

INFORMATION SOURCES

Primary sources

  • Manufacturers and suppliers
  • Channel partners
  • Industry experts
  • Strategic decision makers

Secondary sources

  • Industry journals and periodicals
  • Government data
  • Financial reports of key industry players
  • Historical data
  • Press releases

DATA ANALYSIS

Data Synthesis

  • Collation of data
  • Estimation of key figures
  • Analysis of derived insights

Data Validation

  • Triangulation with data models
  • Reference against proprietary databases
  • Corroboration with industry experts

REPORT WRITING

Qualitative

  • Market drivers
  • Market challenges
  • Market trends
  • Five forces analysis

Quantitative

  • Market size and forecast
  • Market segmentation
  • Geographical insights
  • Competitive landscape

Interested in this report?

Get your sample now to see our research methodology and insights!

Download Now

Frequently Asked Questions

Biorefinery market growth will increase by USD 902108.7 thousand thousand during 2026-2030.

The Biorefinery market is expected to grow at a CAGR of 12.8% during 2026-2030.

Biorefinery market is segmented by Technology (Industrial biotechnology, Physico-chemical, Thermochemical) Feedstock (Starch and sugar crops, Organic and agricultural residues, Energy crops, Multi-feedstock) Product (Energy driven, Material driven)

Andritz AG, Archer Daniels Midland Co., Axens Group, Borregaard ASA, Cargill Inc., Clariant International Ltd., DSM Firmenich AG, Eni SpA, Green Plains Inc., Honeywell International Inc., LanzaTech Global Inc., Metsa Group, Neste Corp., Novonesis Group, Praj Industries Ltd., Raizen Energia SA, Stora Enso Oyj, TotalEnergies SE, UPM Kymmene Corp., Valmet Oyj are a few of the key vendors in the Biorefinery market.

North America will register the highest growth rate of 61.5% among the other regions. Therefore, the Biorefinery market in North America is expected to garner significant business opportunities for the vendors during the forecast period.

US, Canada, Mexico, Germany, UK, France, Italy, Spain, The Netherlands, China, Japan, India, South Korea, Australia, Indonesia, Brazil, Argentina, Chile, Saudi Arabia, UAE, South Africa, Israel, Turkey

  • Accelerating decarbonization policies and renewable fuel mandates is the driving factor this market.

The Biorefinery market vendors should focus on grabbing business opportunities from the Technology segment as it accounted for the largest market share in the base year.
RIA - Research AI Assistant
Ask RIA
