Biogas Market Size 2026-2030
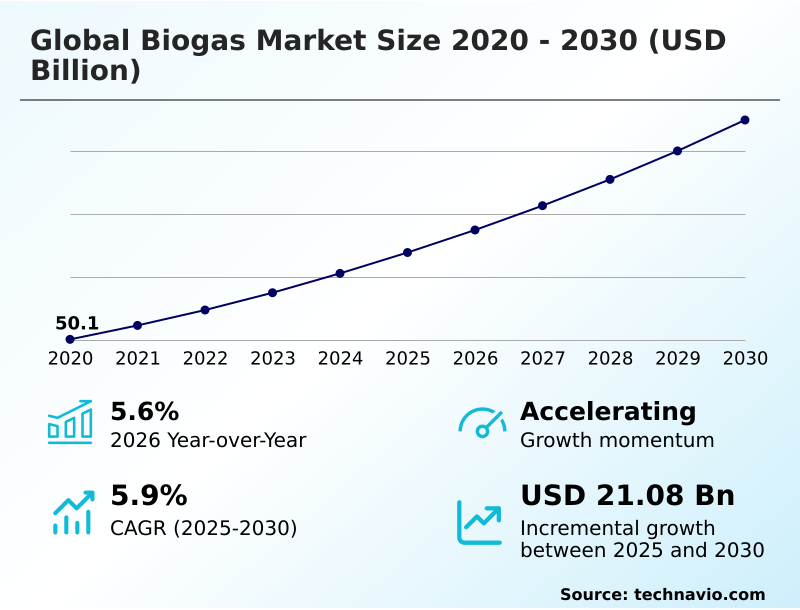
The biogas market size is valued to increase by USD 21.08 billion, at a CAGR of 5.9% from 2025 to 2030. Increased generation of municipal solid waste will drive the biogas market.
Major Market Trends & Insights
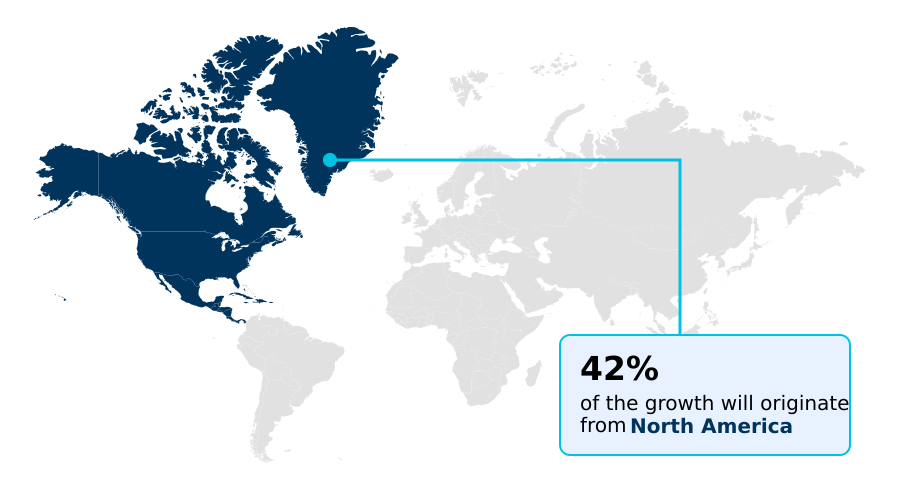
- North America dominated the market and accounted for a 41.9% growth during the forecast period.
- By Application - Co-generation segment was valued at USD 20.87 billion in 2024
- By Source - Agricultural waste segment accounted for the largest market revenue share in 2024
Market Size & Forecast
- Market Opportunities: USD 34.89 billion
- Market Future Opportunities: USD 21.08 billion
- CAGR from 2025 to 2030 : 5.9%
Market Summary
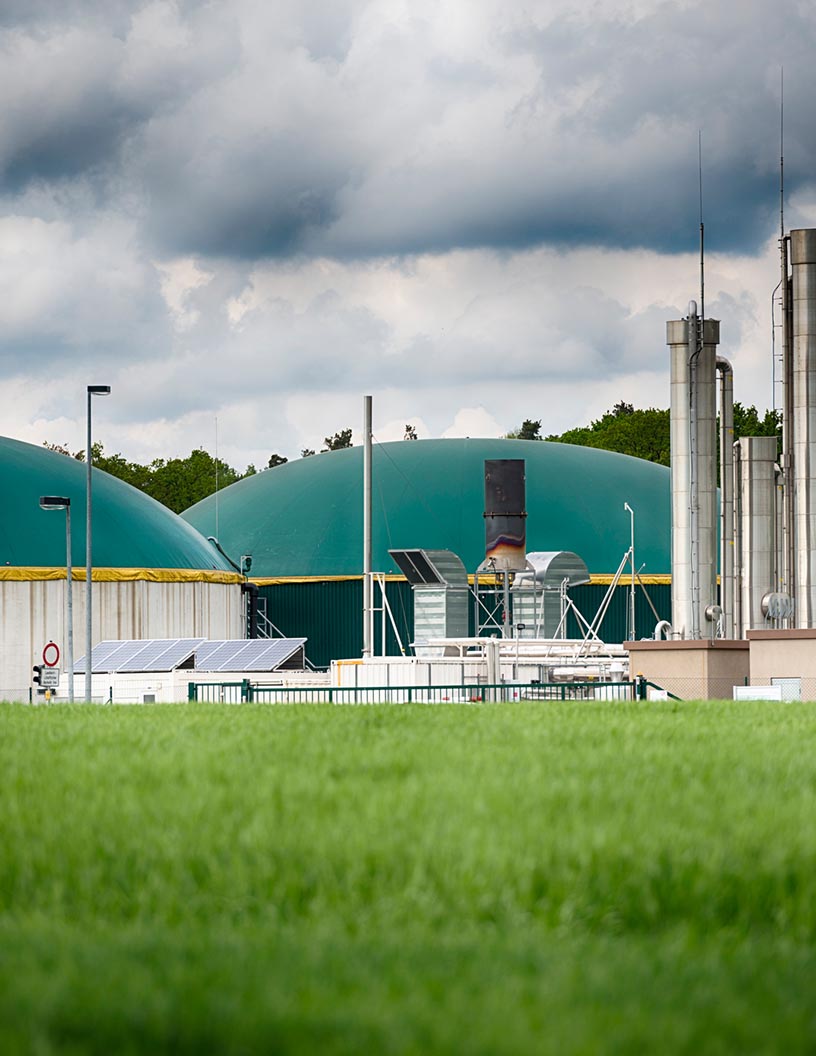
- The biogas market is integral to the global shift toward a circular economy, converting organic waste into a valuable energy resource. This market's expansion is fundamentally driven by dual imperatives: the urgent need for sustainable waste management and the global push for decarbonization.
- Policies mandating the reduction of greenhouse gas emissions, particularly methane from landfills and agriculture, create a strong regulatory pull. Concurrently, the trend of upgrading biogas to high-purity biomethane, or renewable natural gas (RNG), is unlocking high-value applications in transportation and industry, moving beyond simple electricity generation.
- However, the industry navigates challenges related to the logistical complexities and variability of feedstock supply. For instance, a food processing company can implement an on-site anaerobic digester to convert its organic byproducts into biogas, powering its own operations and reducing energy costs while significantly improving its environmental, social, and governance (ESG) profile by minimizing waste sent to landfills.
- This synergy of waste valorization and energy independence exemplifies the market's core value proposition.
What will be the Size of the Biogas Market during the forecast period?
Get Key Insights on Market Forecast (PDF) Get Free Sample
How is the Biogas Market Segmented?
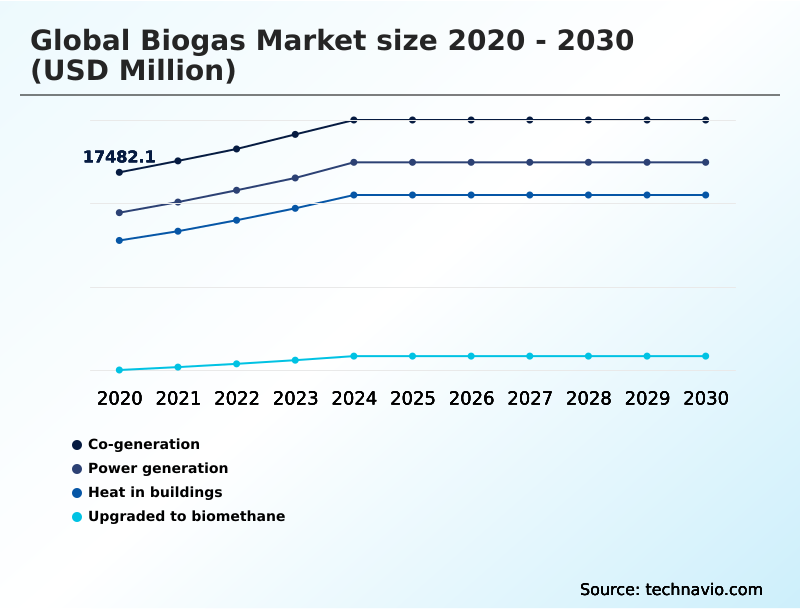
The biogas industry research report provides comprehensive data (region-wise segment analysis), with forecasts and estimates in "USD million" for the period 2026-2030, as well as historical data from 2020-2024 for the following segments.
- Application
- Co-generation
- Power generation
- Heat in buildings
- Upgraded to biomethane
- Source
- Agricultural waste
- Landfill
- Others
- Feedstock
- Organic residue and wastes
- Energy crops
- Geography
- North America
- US
- Canada
- Mexico
- APAC
- China
- India
- Japan
- Europe
- Germany
- France
- Italy
- Middle East and Africa
- UAE
- South Africa
- Saudi Arabia
- South America
- Brazil
- Argentina
- Colombia
- Rest of World (ROW)
- North America
By Application Insights
The co-generation segment is estimated to witness significant growth during the forecast period.
Co-generation, or combined heat and power (CHP), represents a highly efficient application pathway, leveraging anaerobic digester technology to produce both electricity and thermal energy.
This dual-output model, using biomethane from anaerobic digestion, significantly enhances overall energy conversion, with systems often exceeding 85% efficiency.
It is primarily driven by policies promoting decentralized energy production and finds its strongest foothold in sectors with consistent, simultaneous demand for both heat and electricity, such as wastewater treatment facilities and food processing plants.
The effective feedstock management and subsequent use of digestate for nutrient recovery further improve the system's circularity.
In this context, biogas for electricity generation is used onsite or sold to the grid, while captured thermal energy is used for process heating, creating a self-sustaining cycle that lowers the carbon intensity score of operations.
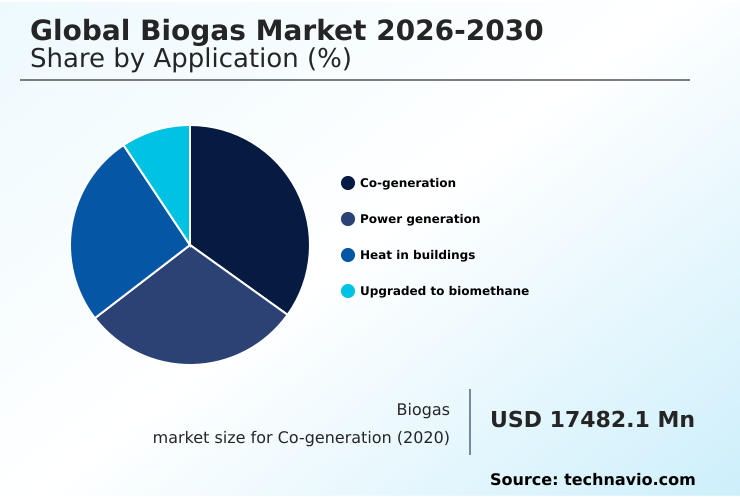
The Co-generation segment was valued at USD 20.87 billion in 2024 and showed a gradual increase during the forecast period.
Regional Analysis
North America is estimated to contribute 41.9% to the growth of the global market during the forecast period.Technavio’s analysts have elaborately explained the regional trends and drivers that shape the market during the forecast period.
See How Biogas Market Demand is Rising in North America Get Free Sample
The global geographic landscape is diverse, with North America contributing 41.9% of the market's incremental growth, largely driven by policy-backed demand for renewable natural gas.
This region's focus on on-farm digesters and agricultural waste management for grid injection contrasts with the mature European market, which has a well-established infrastructure for co-generation (CHP) and decentralized energy production supported by mechanisms like the renewable heat incentive (RHI).
Europe's advanced plants often achieve a 15% greater yield from sludge digestion. Meanwhile, APAC is the fastest-growing region, where development is often centered on providing energy access in rural areas.
The issuance of green gas certificates is becoming a standardized practice globally, enhancing the traceability and value of biomethane across these distinct regional markets.
Market Dynamics
Our researchers analyzed the data with 2025 as the base year, along with the key drivers, trends, and challenges. A holistic analysis of drivers will help companies refine their marketing strategies to gain a competitive advantage.
- The global biogas market 2026-2030 is fundamentally shaped by the anearobic digestion process, which converts diverse organic materials into energy. The choice of feedstock significantly dictates plant design and output, creating distinct segments.
- For instance, the global biogas market 2026-2030 from municipal solid waste focuses on urban waste streams, requiring sophisticated pre-treatment to handle contaminants, whereas the global biogas market 2026-2030 for agricultural waste leverages manure and crop residues, integrating directly into farm-level circular economy models. The application of the resulting energy is another critical differentiator.
- The role of anaerobic digestion in the global biogas market 2026-2030 is pivotal, whether for combined heat and power or for upgrading to high-purity renewable natural gas. The decision between these pathways impacts project economics, as biomethane production costs in the global biogas market 2026-2030 are higher but unlock access to premium fuel markets.
- Examining the co-generation efficiency in the global biogas market 2026-2030 reveals that it can improve overall plant thermal efficiency by more than 40% compared to standalone power generation, directly impacting operational planning and cost structures. Ultimately, analyzing the impact of feedstock on the global biogas market 2026-2030 yield remains a central strategic consideration for all stakeholders.
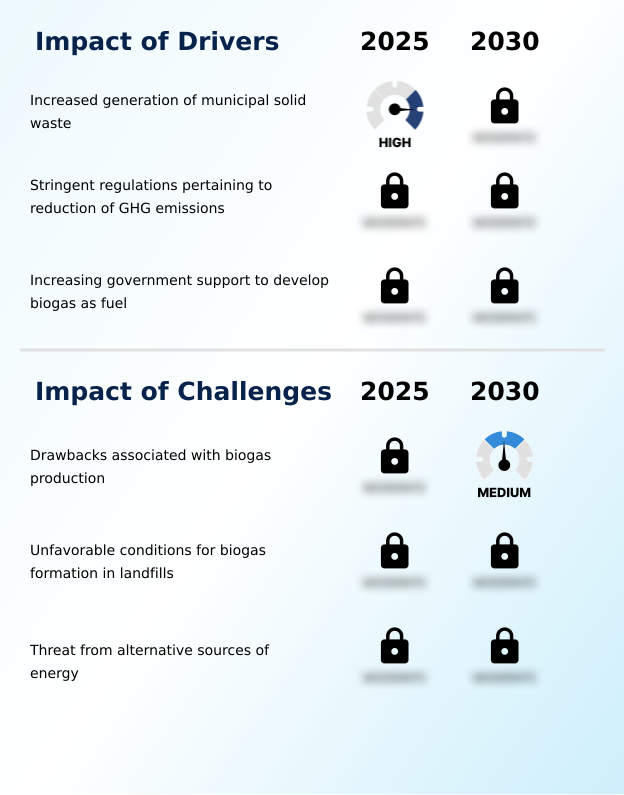
What are the key market drivers leading to the rise in the adoption of Biogas Industry?
- The rising global generation of municipal solid waste, driven by urbanization and population growth, is a primary driver for the biogas market.
- The market is fundamentally driven by circular economy principles and stringent environmental regulations aimed at managing organic waste streams.
- The increasing diversion of municipal solid waste biogas sources, especially the organic fraction of municipal solid waste (OFMSW), from landfills creates a reliable feedstock for waste-to-energy facilities.
- This practice of waste valorization not only generates renewable energy but also mitigates potent greenhouse gas emissions. Advanced landfill gas (LFG) extraction systems now achieve over 90% methane capture efficiency.
- This focus on landfill gas extraction and processing improves the overall methane yield from waste, directly addressing climate targets while converting a disposal liability into a valuable energy asset for urban centers pursuing sustainability goals.
What are the market trends shaping the Biogas Industry?
- The increasing utilization of biogas as piped gas, particularly after being upgraded to biomethane, is a significant emerging trend. This development facilitates its injection into existing natural gas grids for broader distribution and use.
- A primary market trend is the strategic shift toward upgrading raw biogas into high-value products, particularly for the transportation sector. Through advanced biomethanation and biogas purification processes, raw gas is converted into biomethane as vehicle fuel, available as either bio-CNG or bio-LNG.
- This pathway is heavily incentivized by regulatory frameworks such as the Low Carbon Fuel Standard (LCFS), which provides significant financial credits for reducing carbon intensity. Consequently, projects focused on this application often see revenue streams increase by up to 40% compared to traditional electricity generation models.
- The development of gas upgrading technologies is also opening future opportunities for producing sustainable aviation fuel (SAF) from biogas, positioning it as a key resource for decarbonizing hard-to-abate sectors.
What challenges does the Biogas Industry face during its growth?
- Key drawbacks associated with biogas production, including technological inefficiencies and feedstock variability, present a significant challenge to industry growth.
- Key operational challenges stem from feedstock composition and process stability. The high content of lignocellulosic biomass in certain agricultural wastes requires costly pre-treatment for effective wet fermentation or dry fermentation. Additionally, the presence of impurities necessitates effective biogas desulfurization, as contaminants can increase engine maintenance costs by up to 20%.
- Process efficiency is also highly dependent on maintaining optimal conditions for either mesophilic bacteria or thermophilic bacteria, as temperature fluctuations can significantly reduce output. For commercial viability, securing long-term offtake through a power purchase agreement (PPA) is critical, yet competition from other renewables can make this difficult, particularly for projects producing compressed biogas (CBG) in unsubsidized markets.
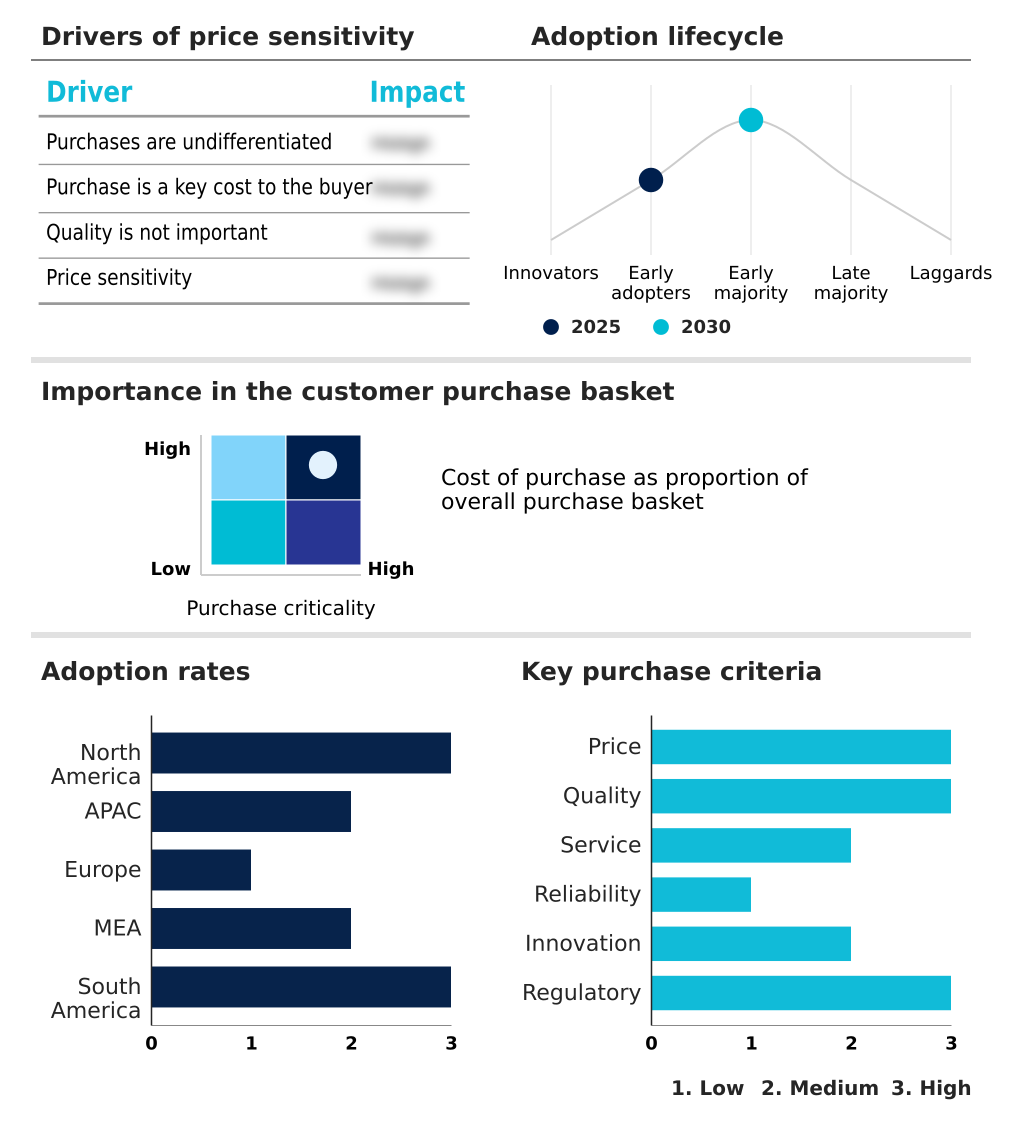
Exclusive Technavio Analysis on Customer Landscape
The biogas market forecasting report includes the adoption lifecycle of the market, covering from the innovator’s stage to the laggard’s stage. It focuses on adoption rates in different regions based on penetration. Furthermore, the biogas market report also includes key purchase criteria and drivers of price sensitivity to help companies evaluate and develop their market growth analysis strategies.
Customer Landscape of Biogas Industry
Competitive Landscape
Companies are implementing various strategies, such as strategic alliances, biogas market forecast, partnerships, mergers and acquisitions, geographical expansion, and product/service launches, to enhance their presence in the industry.
Air Liquide SA - Offerings are focused on upgrading biogas to high-purity biomethane, enabling grid injection and diverse applications as a renewable natural gas.
The industry research and growth report includes detailed analyses of the competitive landscape of the market and information about key companies, including:
- Air Liquide SA
- Ameresco Inc.
- Ammongas A S
- Bekon Energy Technologies Inc
- Biofrigas Sweden AB
- Biokraft AB
- Bright Renewables B.V.
- DMT International
- EnviTec Biogas AG
- Gasum Oy
- Greenlane Renewables Inc.
- HomeBiogas Ltd
- HoSt Holding B.V.
- PlanET Biogastechnik GmbH
- Schmack Biogas Srl
- STRABAG Umwelttechnik GmbH
- TotalEnergies SE
- Verdant Biogas Co Ltd
- Wartsila Corp.
- WELTEC BIOPOWER GmbH
Qualitative and quantitative analysis of companies has been conducted to help clients understand the wider business environment as well as the strengths and weaknesses of key industry players. Data is qualitatively analyzed to categorize companies as pure play, category-focused, industry-focused, and diversified; it is quantitatively analyzed to categorize companies as dominant, leading, strong, tentative, and weak.
Recent Development and News in Biogas market
- In October 2024, BioConstruct announced a large-scale biomethane injection plant near Liverpool to process approximately 125,000 tons of waste annually into grid-injected biomethane, supporting national goals to reduce fossil fuel use.
- In January 2025, Verde NRG secured a significant federal grant under the US Inflation Reduction Act to develop five new renewable natural gas (RNG) facilities at dairy farms across the Midwest, aiming to capture methane emissions from agricultural waste.
- In April 2025, technology firm Innovate Corp. signed a long-term power purchase agreement with AgriGas Solutions to supply its new data center campus with baseload power generated from an agricultural waste-fed biogas plant, ensuring 24/7 renewable energy.
- In May 2025, the European Union Parliament granted final approval for a new directive classifying biomethane produced via advanced gasification as a zero-emission transport fuel, which is expected to accelerate its adoption in heavy-duty logistics.
Dive into Technavio’s robust research methodology, blending expert interviews, extensive data synthesis, and validated models for unparalleled Biogas Market insights. See full methodology.
| Market Scope | |
|---|---|
| Page number | 295 |
| Base year | 2025 |
| Historic period | 2020-2024 |
| Forecast period | 2026-2030 |
| Growth momentum & CAGR | Accelerate at a CAGR of 5.9% |
| Market growth 2026-2030 | USD 21077.6 million |
| Market structure | Fragmented |
| YoY growth 2025-2026(%) | 5.6% |
| Key countries | US, Canada, Mexico, China, India, Japan, South Korea, Australia, Indonesia, Germany, France, Italy, UK, Spain, The Netherlands, UAE, South Africa, Saudi Arabia, Egypt, Turkey, Brazil, Argentina and Colombia |
| Competitive landscape | Leading Companies, Market Positioning of Companies, Competitive Strategies, and Industry Risks |
Research Analyst Overview
- The biogas market is undergoing a significant transformation, moving beyond its traditional role in waste management to become a key player in the renewable energy landscape. This evolution is driven by advancements in anaerobic digestion and gas upgrading technologies, which enable the conversion of diverse feedstocks into high-purity biomethane, or renewable natural gas (RNG).
- The process leverages both mesophilic bacteria and more efficient thermophilic bacteria to optimize methane yield from inputs like lignocellulosic biomass and landfill gas (LFG). As a result, biogas purification and biomethanation are becoming standard, facilitating grid injection and creating a fungible, low-carbon energy carrier.
- This trend toward producing RNG is critical for boardroom decisions, as the associated carbon intensity score allows companies to access lucrative credits in regulated markets, directly impacting financial strategy.
- The ability to upgrade biogas, increasing methane concentration from a baseline of 50% to over 97%, enhances its value and application potential in co-generation (CHP), waste-to-energy systems, and as a fuel, while the resulting digestate supports nutrient recovery.
What are the Key Data Covered in this Biogas Market Research and Growth Report?
-
What is the expected growth of the Biogas Market between 2026 and 2030?
-
USD 21.08 billion, at a CAGR of 5.9%
-
-
What segmentation does the market report cover?
-
The report is segmented by Application (Co-generation, Power generation, Heat in buildings, and Upgraded to biomethane), Source (Agricultural waste, Landfill, and Others), Feedstock (Organic residue and wastes, and Energy crops) and Geography (North America, APAC, Europe, Middle East and Africa, South America)
-
-
Which regions are analyzed in the report?
-
North America, APAC, Europe, Middle East and Africa and South America
-
-
What are the key growth drivers and market challenges?
-
Increased generation of municipal solid waste, Drawbacks associated with biogas production
-
-
Who are the major players in the Biogas Market?
-
Air Liquide SA, Ameresco Inc., Ammongas A S, Bekon Energy Technologies Inc, Biofrigas Sweden AB, Biokraft AB, Bright Renewables B.V., DMT International, EnviTec Biogas AG, Gasum Oy, Greenlane Renewables Inc., HomeBiogas Ltd, HoSt Holding B.V., PlanET Biogastechnik GmbH, Schmack Biogas Srl, STRABAG Umwelttechnik GmbH, TotalEnergies SE, Verdant Biogas Co Ltd, Wartsila Corp. and WELTEC BIOPOWER GmbH
-
Market Research Insights
- Market dynamics are increasingly shaped by policy incentives and corporate sustainability targets that prioritize high-value applications. The strategic pivot from basic electricity generation toward producing biomethane as a vehicle fuel is notable, as projects aligned with programs like the Low Carbon Fuel Standard (LCFS) can achieve a return on investment that is up to 30% higher than conventional power-only facilities.
- This shift in organic waste to energy strategies is supported by advancements in anaerobic digester technology, which have improved methane yield from feedstock by over 15% in certain applications.
- This enhancement in biogas for electricity generation and fuel production makes investments in agricultural waste management and circular economy biogas models more financially viable, accelerating the transition toward a decentralized energy production landscape.
We can help! Our analysts can customize this biogas market research report to meet your requirements.
 RIA -
RIA - 
