Supply Chain Management (SCM) Software Market Analysis, Size, and Forecast 2026-2030: North America (US, Canada, and Mexico), Europe (UK, Germany, and France), APAC (China, Japan, and South Korea), Middle East and Africa (Saudi Arabia, South Africa, and Turkey), South America (Brazil and Argentina), and Rest of World (ROW)

Supply Chain Management (SCM) Software Market Analysis, Size, and Forecast 2026-2030:
North America (US, Canada, and Mexico), Europe (UK, Germany, and France), APAC (China, Japan, and South Korea), Middle East and Africa (Saudi Arabia, South Africa, and Turkey), South America (Brazil and Argentina), and Rest of World (ROW)

Published: Mar 2026 296 Pages SKU: IRTNTR40287

Market Overview at a Glance

$29.63 B
Market Opportunity
15.2%
CAGR 2025 - 2030
35.8%
North America Growth
$9.26 B
SCP segment 2024

Supply Chain Management (SCM) Software Market Size 2026-2030

The supply chain management (scm) software market size is valued to increase by USD 29.63 billion, at a CAGR of 15.2% from 2025 to 2030. Strategic mainstreaming of agentic AI and autonomous decision-support systems will drive the supply chain management (scm) software market.

Major Market Trends & Insights

  • North America dominated the market and accounted for a 35.8% growth during the forecast period.
  • By Application - SCP segment was valued at USD 9.26 billion in 2024
  • By Deployment - On-premises segment accounted for the largest market revenue share in 2024

Market Size & Forecast

  • Market Opportunities: USD 40.55 billion
  • Market Future Opportunities: USD 29.63 billion
  • CAGR from 2025 to 2030 : 15.2%

Market Summary

  • The supply chain management (SCM) software market is undergoing a significant transformation, moving beyond traditional data reporting to embrace autonomous orchestration and agentic intelligence. This evolution is driven by the need for enterprises to build resilient, self-healing supply chains capable of navigating persistent global trade volatility.
  • Core to this shift is the adoption of unified, cloud-native platforms that integrate advanced technologies like artificial intelligence, digital twins, and generative AI. For instance, a global manufacturer can now leverage a digital twin of its entire network to simulate the impact of a potential port strike, allowing it to proactively reroute shipments and adjust inventory levels before disruptions occur.
  • The market is also heavily influenced by the mandatory digitalization of sustainability and ESG compliance, compelling firms to invest in solutions that provide end-to-end visibility into multi-tier supplier ethics and Scope 3 emissions.
  • However, this progress is tempered by challenges such as the technical complexity of integrating modern software with legacy systems and the escalating threat of cybersecurity risks in highly interconnected digital ecosystems. The democratization of technology through low-code/no-code platforms is a key trend, empowering business users to develop custom applications and accelerate digital adoption across the organization.

What will be the Size of the Supply Chain Management (SCM) Software Market during the forecast period?

Get Key Insights on Market Forecast (PDF) Request Free Sample

How is the Supply Chain Management (SCM) Software Market Segmented?

The supply chain management (scm) software industry research report provides comprehensive data (region-wise segment analysis), with forecasts and estimates in "USD million" for the period 2026-2030, as well as historical data from 2020-2024 for the following segments.

  • Application
    • SCP
    • Procurement
    • WMS
    • TMS
  • Deployment
    • On-premises
    • Cloud-based
  • Component
    • Software
    • Services
  • Geography
    • North America
      • US
      • Canada
      • Mexico
    • Europe
      • UK
      • Germany
      • France
    • APAC
      • China
      • Japan
      • South Korea
    • Middle East and Africa
      • Saudi Arabia
      • South Africa
      • Turkey
    • South America
      • Brazil
      • Argentina
    • Rest of World (ROW)

By Application Insights

The scp segment is estimated to witness significant growth during the forecast period.

The supply chain planning (SCP) segment is shifting from periodic planning cycles toward continuous, event-driven models powered by predictive demand sensing and autonomous orchestration. Modern platforms now use digital twin technology for real-time disruption simulation, allowing for proactive strategy testing.

A key development is the integration of agentic AI, with software agents now capable of independently identifying supply-demand imbalances and executing corrective actions, a transition that has improved forecast accuracy by over 15% in early adoption cases.

This move toward self-healing networks, which also incorporate prescriptive analytics and ethical sourcing metrics, minimizes reliance on manual forecasting. The evolution of low-code/no-code platforms and cloud-native orchestration further democratizes access to advanced optimization tools, enhancing overall system resilience and performance.

Request Free Sample

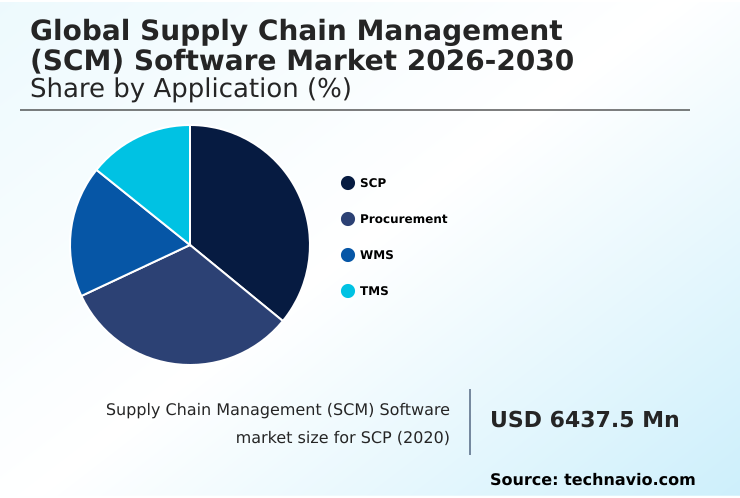
The SCP segment was valued at USD 9.26 billion in 2024 and showed a gradual increase during the forecast period.

Request Free Sample

Regional Analysis

North America is estimated to contribute 35.8% to the growth of the global market during the forecast period.Technavio’s analysts have elaborately explained the regional trends and drivers that shape the market during the forecast period.

See How Supply Chain Management (SCM) Software Market Demand is Rising in North America Request Free Sample

The global supply chain management (SCM) software market is geographically led by North America, which accounts for over 35% of the incremental growth, driven by its sophisticated technological ecosystem and rapid adoption of predictive demand sensing and warehouse automation.

Europe follows closely, with its market heavily influenced by stringent regulatory frameworks like the Corporate Sustainability Reporting Directive, which mandates deep multi-tier supplier transparency and Scope 3 emissions tracking.

The APAC region is the fastest-growing market, with a CAGR of 15.7%, propelled by massive industrialization and the expansion of the digital economy in countries like China and India.

These regions are prioritizing cloud-native orchestration and dynamic freight optimization to manage complex, high-volume trade corridors, underscoring the global demand for agile, intelligent, and compliant supply chain solutions.

Market Dynamics

Our researchers analyzed the data with 2025 as the base year, along with the key drivers, trends, and challenges. A holistic analysis of drivers will help companies refine their marketing strategies to gain a competitive advantage.

  • Enterprises are increasingly focusing on strategic SCM initiatives to gain a competitive edge. A primary area of investment is in AI-driven procurement automation benefits, where machine learning algorithms optimize sourcing decisions and automate routine purchasing tasks, leading to significant cost reductions and improved supplier performance.
  • Simultaneously, the adoption of cloud-native SCM for SMEs is democratizing access to advanced capabilities, allowing smaller businesses to compete with larger corporations on agility and efficiency.
  • This trend is complemented by the growing importance of ESG compliance reporting software, which provides the necessary tools to track and report on sustainability metrics across the entire value chain, meeting both regulatory requirements and consumer expectations. To manage increasing complexity and risk, companies are turning to a digital twin for supply chain risk simulation.
  • This technology allows them to model various disruption scenarios and develop robust contingency plans. Furthermore, the integration of generative AI in demand forecasting is revolutionizing how businesses predict market trends, with natural language queries enabling more intuitive and accurate analysis.
  • This shift toward intelligent, interconnected, and sustainable supply chains is redefining operational excellence, with companies leveraging advanced software reporting double-digit improvements in operational efficiency compared to those relying on legacy systems.

What are the key market drivers leading to the rise in the adoption of Supply Chain Management (SCM) Software Industry?

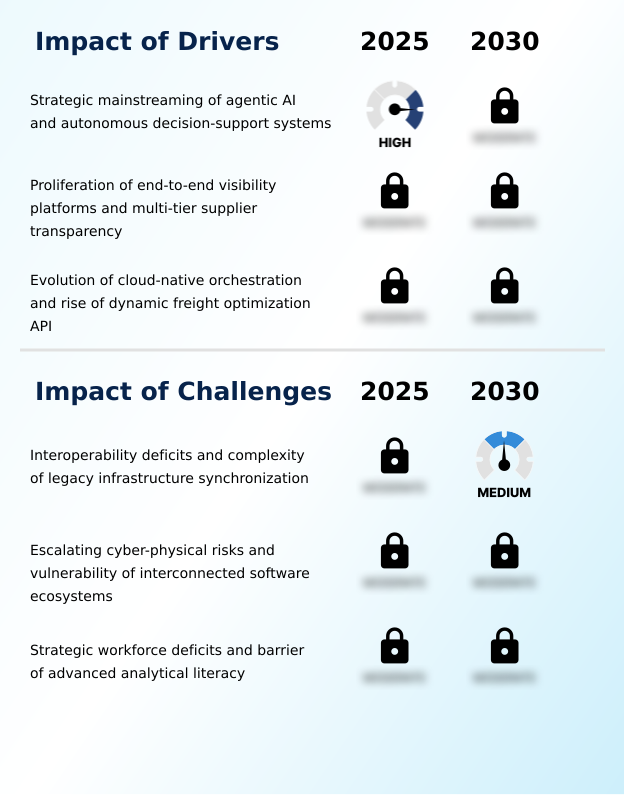
  • The strategic mainstreaming of agentic AI and autonomous decision-support systems is a key driver of market growth.

  • Market growth is propelled by the strategic mainstreaming of agentic AI for autonomous decision-making across logistics networks. This shift addresses the need to shorten disruption response times, with software agents now capable of automatically rerouting shipments based on predictive analytics.
  • A second major driver is the proliferation of end-to-end visibility platforms, which provide transparency into multi-tier supplier networks to identify hidden risks and ensure regulatory compliance.
  • Supply chain concerns have doubled year-over-year, leading to a sevenfold increase in exploration of technologies like digital twins for traceability.
  • Finally, the evolution of cloud-native orchestration and dynamic freight optimization APIs provides the real-time modal flexibility needed to navigate fluctuating costs and capacity constraints, making advanced demand forecasting accessible to more businesses.

What are the market trends shaping the Supply Chain Management (SCM) Software Industry?

  • The digitalization of mandatory sustainability and Environmental, Social, and Governance (ESG) compliance is an increasingly vital market trend.

  • Key market trends are centered on sustainability, circularity, and democratization. The transition toward mandatory ESG compliance is compelling companies to adopt auditable, real-time data platforms for tracking Scope 3 emissions and ethical sourcing metrics. This is creating significant demand for digital product passports.
  • Concurrently, the rise of circular supply chain platforms, a sector projected to grow at 13.7%, is enabling robust material recovery tracking and reverse logistics. This trend is crucial for managing cradle-to-cradle product lifecycles. Furthermore, the democratization of development through low-code/no-code platforms is accelerating digital transformation, with forecasts indicating that 70% of new SCM applications will use these technologies.
  • This allows for greater innovation and customization using tools for procurement automation and inventory optimization.

What challenges does the Supply Chain Management (SCM) Software Industry face during its growth?

  • Interoperability deficits and the complexity of synchronizing with legacy infrastructure are key challenges affecting industry growth.

  • The market faces significant structural challenges, led by interoperability deficits between modern cloud platforms and legacy infrastructure, a problem cited by 83% of supply chain professionals as a primary decelerator for digital transformation. This technical debt creates data silos that inhibit end-to-end visibility and agile decision-making. Another critical challenge is the escalation of cyber-physical risks within interconnected software ecosystems.
  • The expanded attack surface of cloud-based models requires a move toward zero-trust architecture to protect against sophisticated threats. Finally, a strategic workforce deficit and a lack of advanced analytical literacy hinder the effective use of sophisticated tools for prescriptive analytics and warehouse automation, leading to underutilization and poor returns on investment for many organizations.

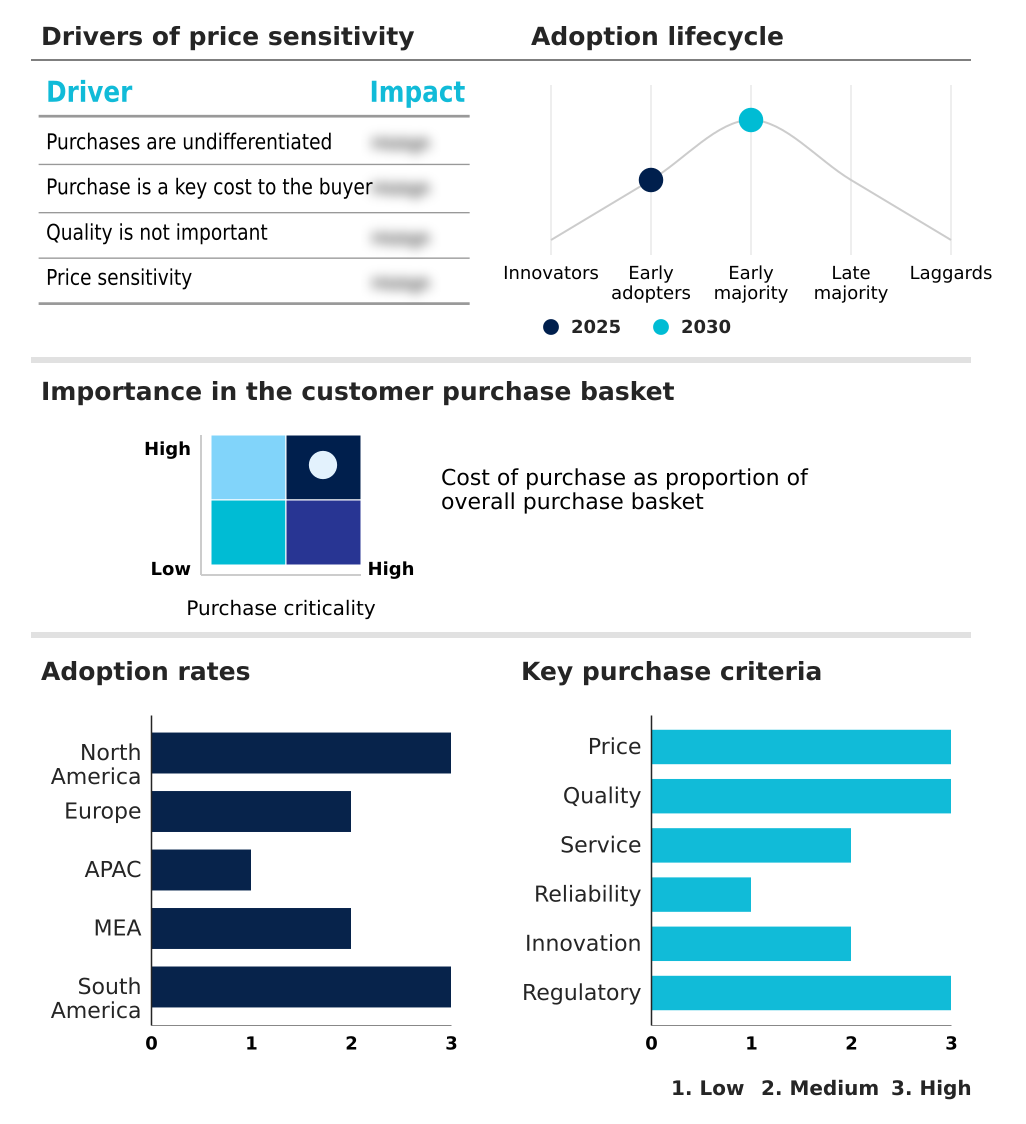
Exclusive Technavio Analysis on Customer Landscape

The supply chain management (scm) software market forecasting report includes the adoption lifecycle of the market, covering from the innovator’s stage to the laggard’s stage. It focuses on adoption rates in different regions based on penetration. Furthermore, the supply chain management (scm) software market report also includes key purchase criteria and drivers of price sensitivity to help companies evaluate and develop their market growth analysis strategies.

Customer Landscape of Supply Chain Management (SCM) Software Industry

Competitive Landscape

Companies are implementing various strategies, such as strategic alliances, supply chain management (scm) software market forecast, partnerships, mergers and acquisitions, geographical expansion, and product/service launches, to enhance their presence in the industry.

Blue Yonder Group Inc. - Offerings center on AI-driven demand planning, inventory optimization, and comprehensive logistics solutions that facilitate autonomous, resilient, and transparent end-to-end supply chain operations.

The industry research and growth report includes detailed analyses of the competitive landscape of the market and information about key companies, including:

  • Blue Yonder Group Inc.
  • Coupa Software Inc.
  • Descartes Systems Group Inc.
  • E2open Parent Holdings Inc.
  • Epicor Software Corp.
  • IBM Corp.
  • Infor Inc.
  • Jaggaer LLC
  • Kinaxis Inc.
  • Logility SCS Inc.
  • Magaya Corp.
  • Manhattan Associates Inc.
  • Microsoft Corp.
  • o9 Solutions Inc.
  • Oracle Corp.
  • Panasonic Holdings Corp.
  • SAP SE
  • Solvoyo Co.
  • StockIQ Technologies Inc.
  • Webgility Inc.

Qualitative and quantitative analysis of companies has been conducted to help clients understand the wider business environment as well as the strengths and weaknesses of key industry players. Data is qualitatively analyzed to categorize companies as pure play, category-focused, industry-focused, and diversified; it is quantitatively analyzed to categorize companies as dominant, leading, strong, tentative, and weak.

Recent Development and News in Supply chain management (scm) software market

  • In May, 2025, Oracle announced the launch of specialized AI agents within its Fusion Cloud Applications, designed to autonomously manage high-volume workflows like competitive bidding and the conversion of purchase orders.
  • In March, 2025, a revised technology forecast from a leading research firm predicted that 70% of new enterprise applications in the supply chain sector will utilize low-code or no-code technologies by year-end.
  • In December, 2024, a major global trade management platform launched a localized compliance engine designed to automate the classification of goods under new, highly complex tariff and environmental tax regimes.
  • In September, 2024, a Thomson Reuters Global Trade Report revealed that supply chain concerns among trade professionals doubled year-over-year, leading to a sevenfold increase in the exploration of emerging technologies for traceability.

Dive into Technavio’s robust research methodology, blending expert interviews, extensive data synthesis, and validated models for unparalleled Supply Chain Management (SCM) Software Market insights. See full methodology.

Market Scope
Page number 296
Base year 2025
Historic period 2020-2024
Forecast period 2026-2030
Growth momentum & CAGR Accelerate at a CAGR of 15.2%
Market growth 2026-2030 USD 29629.7 million
Market structure Fragmented
YoY growth 2025-2026(%) 13.5%
Key countries US, Canada, Mexico, UK, Germany, France, Spain, Italy, The Netherlands, China, Japan, South Korea, India, Australia, Indonesia, Saudi Arabia, South Africa, Turkey, UAE, Israel, Brazil, Argentina and Chile
Competitive landscape Leading Companies, Market Positioning of Companies, Competitive Strategies, and Industry Risks

Request Free Sample

Research Analyst Overview

  • The supply chain management (SCM) software market is rapidly evolving from systems of record to intelligent engines of autonomous decision-making. The integration of agentic AI and digital twin technology is becoming standard, enabling a human-plus-agent framework where software executes corrective actions based on predictive demand sensing and real-time geopolitical risk signals.
  • This shift toward continuous planning and low-touch planning is critical for navigating volatility. A major boardroom consideration is the mandatory implementation of scope 3 emissions tracking and ethical sourcing metrics, which necessitates platforms capable of ensuring multi-tier supplier transparency. While the benefits are clear, nearly 83% of professionals identify legacy infrastructure synchronization as a primary barrier.
  • The move to cloud-native orchestration and the use of generative AI for natural language queries are helping to overcome these hurdles. Successful deployment requires a focus on zero-trust architecture to mitigate cyber-physical risks, alongside investments in circular supply chain modules for material recovery tracking and reverse logistics to achieve sustainability goals.

What are the Key Data Covered in this Supply Chain Management (SCM) Software Market Research and Growth Report?

  • What is the expected growth of the Supply Chain Management (SCM) Software Market between 2026 and 2030?

    • USD 29.63 billion, at a CAGR of 15.2%

  • What segmentation does the market report cover?

    • The report is segmented by Application (SCP, Procurement, WMS, and TMS), Deployment (On-premises, and Cloud-based), Component (Software, and Services) and Geography (North America, Europe, APAC, Middle East and Africa, South America)

  • Which regions are analyzed in the report?

    • North America, Europe, APAC, Middle East and Africa and South America

  • What are the key growth drivers and market challenges?

    • Strategic mainstreaming of agentic AI and autonomous decision-support systems, Interoperability deficits and complexity of legacy infrastructure synchronization

  • Who are the major players in the Supply Chain Management (SCM) Software Market?

    • Blue Yonder Group Inc., Coupa Software Inc., Descartes Systems Group Inc., E2open Parent Holdings Inc., Epicor Software Corp., IBM Corp., Infor Inc., Jaggaer LLC, Kinaxis Inc., Logility SCS Inc., Magaya Corp., Manhattan Associates Inc., Microsoft Corp., o9 Solutions Inc., Oracle Corp., Panasonic Holdings Corp., SAP SE, Solvoyo Co., StockIQ Technologies Inc. and Webgility Inc.

Market Research Insights

  • Market dynamics are increasingly shaped by the push for systemic resilience over pure cost optimization, a shift where 68% of trade professionals now cite supply chain reliability as their top strategic concern. The adoption of advanced software, particularly for spend management and global trade compliance, is accelerating.
  • Organizations are leveraging supply chain orchestration platforms to manage complex supplier relationships and automate procurement processes. This has led to a sevenfold increase in the exploration of technologies like blockchain for traceability.
  • Furthermore, the focus on omnichannel fulfillment and last-mile delivery modules is intensifying, driven by the need to meet heightened consumer expectations for speed and transparency in the final stages of the supply chain.

We can help! Our analysts can customize this supply chain management (scm) software market research report to meet your requirements.

Get in touch

1. Executive Summary

1.1 Market overview

Executive Summary - Chart on Market Overview
Executive Summary - Data Table on Market Overview
Executive Summary - Chart on Global Market Characteristics
Executive Summary - Chart on Market by Geography
Executive Summary - Chart on Market Segmentation by Application
Executive Summary - Chart on Market Segmentation by Deployment
Executive Summary - Chart on Market Segmentation by Component
Executive Summary - Chart on Incremental Growth
Executive Summary - Data Table on Incremental Growth
Executive Summary - Chart on Company Market Positioning

2. Technavio Analysis

2.1 Analysis of price sensitivity, lifecycle, customer purchase basket, adoption rates, and purchase criteria

2.2 Criticality of inputs and Factors of differentiation

Chart on Overview on criticality of inputs and factors of differentiation

2.3 Factors of disruption

Chart on Overview on factors of disruption

2.4 Impact of drivers and challenges

Chart on Impact of drivers and challenges in 2025 and 2030

3. Market Landscape

3.1 Market ecosystem

Chart on Parent Market
Data Table on - Parent Market

3.2 Market characteristics

Chart on Market characteristics analysis

3.3 Value chain analysis

Chart on Value chain analysis

4. Market Sizing

4.1 Market definition

Data Table on Offerings of companies included in the market definition

4.2 Market segment analysis

Market segments

4.3 Market size 2025

4.4 Market outlook: Forecast for 2025-2030

Chart on Global - Market size and forecast 2025-2030 ($ million)
Data Table on Global - Market size and forecast 2025-2030 ($ million)
Chart on Global Market: Year-over-year growth 2025-2030 (%)
Data Table on Global Market: Year-over-year growth 2025-2030 (%)

5. Historic Market Size

5.1 Global Supply Chain Management (SCM) Software Market 2020 - 2024

Historic Market Size - Data Table on Global Supply Chain Management (SCM) Software Market 2020 - 2024 ($ million)

5.2 Application segment analysis 2020 - 2024

Historic Market Size - Application Segment 2020 - 2024 ($ million)

5.3 Deployment segment analysis 2020 - 2024

Historic Market Size - Deployment Segment 2020 - 2024 ($ million)

5.4 Component segment analysis 2020 - 2024

Historic Market Size - Component Segment 2020 - 2024 ($ million)

5.5 Geography segment analysis 2020 - 2024

Historic Market Size - Geography Segment 2020 - 2024 ($ million)

5.6 Country segment analysis 2020 - 2024

Historic Market Size - Country Segment 2020 - 2024 ($ million)

6. Qualitative Analysis

6.1 Impact of AI in global supply chain management (SCM) software market

7. Five Forces Analysis

7.1 Five forces summary

Five forces analysis - Comparison between 2025 and 2030

7.2 Bargaining power of buyers

Bargaining power of buyers - Impact of key factors 2025 and 2030

7.3 Bargaining power of suppliers

Bargaining power of suppliers - Impact of key factors in 2025 and 2030

7.4 Threat of new entrants

Threat of new entrants - Impact of key factors in 2025 and 2030

7.5 Threat of substitutes

Threat of substitutes - Impact of key factors in 2025 and 2030

7.6 Threat of rivalry

Threat of rivalry - Impact of key factors in 2025 and 2030

7.7 Market condition

Chart on Market condition - Five forces 2025 and 2030

8. Market Segmentation by Application

8.1 Market segments

Chart on Application - Market share 2025-2030 (%)
Data Table on Application - Market share 2025-2030 (%)

8.2 Comparison by Application

Chart on Comparison by Application
Data Table on Comparison by Application

8.3 SCP - Market size and forecast 2025-2030

Chart on SCP - Market size and forecast 2025-2030 ($ million)
Data Table on SCP - Market size and forecast 2025-2030 ($ million)
Chart on SCP - Year-over-year growth 2025-2030 (%)
Data Table on SCP - Year-over-year growth 2025-2030 (%)

8.4 Procurement - Market size and forecast 2025-2030

Chart on Procurement - Market size and forecast 2025-2030 ($ million)
Data Table on Procurement - Market size and forecast 2025-2030 ($ million)
Chart on Procurement - Year-over-year growth 2025-2030 (%)
Data Table on Procurement - Year-over-year growth 2025-2030 (%)

8.5 WMS - Market size and forecast 2025-2030

Chart on WMS - Market size and forecast 2025-2030 ($ million)
Data Table on WMS - Market size and forecast 2025-2030 ($ million)
Chart on WMS - Year-over-year growth 2025-2030 (%)
Data Table on WMS - Year-over-year growth 2025-2030 (%)

8.6 TMS - Market size and forecast 2025-2030

Chart on TMS - Market size and forecast 2025-2030 ($ million)
Data Table on TMS - Market size and forecast 2025-2030 ($ million)
Chart on TMS - Year-over-year growth 2025-2030 (%)
Data Table on TMS - Year-over-year growth 2025-2030 (%)

8.7 Market opportunity by Application

Market opportunity by Application ($ million)
Data Table on Market opportunity by Application ($ million)

9. Market Segmentation by Deployment

9.1 Market segments

Chart on Deployment - Market share 2025-2030 (%)
Data Table on Deployment - Market share 2025-2030 (%)

9.2 Comparison by Deployment

Chart on Comparison by Deployment
Data Table on Comparison by Deployment

9.3 On-premises - Market size and forecast 2025-2030

Chart on On-premises - Market size and forecast 2025-2030 ($ million)
Data Table on On-premises - Market size and forecast 2025-2030 ($ million)
Chart on On-premises - Year-over-year growth 2025-2030 (%)
Data Table on On-premises - Year-over-year growth 2025-2030 (%)

9.4 Cloud-based - Market size and forecast 2025-2030

Chart on Cloud-based - Market size and forecast 2025-2030 ($ million)
Data Table on Cloud-based - Market size and forecast 2025-2030 ($ million)
Chart on Cloud-based - Year-over-year growth 2025-2030 (%)
Data Table on Cloud-based - Year-over-year growth 2025-2030 (%)

9.5 Market opportunity by Deployment

Market opportunity by Deployment ($ million)
Data Table on Market opportunity by Deployment ($ million)

10. Market Segmentation by Component

10.1 Market segments

Chart on Component - Market share 2025-2030 (%)
Data Table on Component - Market share 2025-2030 (%)

10.2 Comparison by Component

Chart on Comparison by Component
Data Table on Comparison by Component

10.3 Software - Market size and forecast 2025-2030

Chart on Software - Market size and forecast 2025-2030 ($ million)
Data Table on Software - Market size and forecast 2025-2030 ($ million)
Chart on Software - Year-over-year growth 2025-2030 (%)
Data Table on Software - Year-over-year growth 2025-2030 (%)

10.4 Services - Market size and forecast 2025-2030

Chart on Services - Market size and forecast 2025-2030 ($ million)
Data Table on Services - Market size and forecast 2025-2030 ($ million)
Chart on Services - Year-over-year growth 2025-2030 (%)
Data Table on Services - Year-over-year growth 2025-2030 (%)

10.5 Market opportunity by Component

Market opportunity by Component ($ million)
Data Table on Market opportunity by Component ($ million)

11. Customer Landscape

11.1 Customer landscape overview

Analysis of price sensitivity, lifecycle, customer purchase basket, adoption rates, and purchase criteria

12. Geographic Landscape

12.1 Geographic segmentation

Chart on Market share by geography 2025-2030 (%)
Data Table on Market share by geography 2025-2030 (%)

12.2 Geographic comparison

Chart on Geographic comparison
Data Table on Geographic comparison

12.3 North America - Market size and forecast 2025-2030

Chart on North America - Market size and forecast 2025-2030 ($ million)
Data Table on North America - Market size and forecast 2025-2030 ($ million)
Chart on North America - Year-over-year growth 2025-2030 (%)
Data Table on North America - Year-over-year growth 2025-2030 (%)
Chart on Regional Comparison - North America
Data Table on Regional Comparison - North America

12.3.1 US - Market size and forecast 2025-2030

Chart on US - Market size and forecast 2025-2030 ($ million)
Data Table on US - Market size and forecast 2025-2030 ($ million)
Chart on US - Year-over-year growth 2025-2030 (%)
Data Table on US - Year-over-year growth 2025-2030 (%)

12.3.2 Canada - Market size and forecast 2025-2030

Chart on Canada - Market size and forecast 2025-2030 ($ million)
Data Table on Canada - Market size and forecast 2025-2030 ($ million)
Chart on Canada - Year-over-year growth 2025-2030 (%)
Data Table on Canada - Year-over-year growth 2025-2030 (%)

12.3.3 Mexico - Market size and forecast 2025-2030

Chart on Mexico - Market size and forecast 2025-2030 ($ million)
Data Table on Mexico - Market size and forecast 2025-2030 ($ million)
Chart on Mexico - Year-over-year growth 2025-2030 (%)
Data Table on Mexico - Year-over-year growth 2025-2030 (%)

12.4 Europe - Market size and forecast 2025-2030

Chart on Europe - Market size and forecast 2025-2030 ($ million)
Data Table on Europe - Market size and forecast 2025-2030 ($ million)
Chart on Europe - Year-over-year growth 2025-2030 (%)
Data Table on Europe - Year-over-year growth 2025-2030 (%)
Chart on Regional Comparison - Europe
Data Table on Regional Comparison - Europe

12.4.1 UK - Market size and forecast 2025-2030

Chart on UK - Market size and forecast 2025-2030 ($ million)
Data Table on UK - Market size and forecast 2025-2030 ($ million)
Chart on UK - Year-over-year growth 2025-2030 (%)
Data Table on UK - Year-over-year growth 2025-2030 (%)

12.4.2 Germany - Market size and forecast 2025-2030

Chart on Germany - Market size and forecast 2025-2030 ($ million)
Data Table on Germany - Market size and forecast 2025-2030 ($ million)
Chart on Germany - Year-over-year growth 2025-2030 (%)
Data Table on Germany - Year-over-year growth 2025-2030 (%)

12.4.3 France - Market size and forecast 2025-2030

Chart on France - Market size and forecast 2025-2030 ($ million)
Data Table on France - Market size and forecast 2025-2030 ($ million)
Chart on France - Year-over-year growth 2025-2030 (%)
Data Table on France - Year-over-year growth 2025-2030 (%)

12.4.4 Spain - Market size and forecast 2025-2030

Chart on Spain - Market size and forecast 2025-2030 ($ million)
Data Table on Spain - Market size and forecast 2025-2030 ($ million)
Chart on Spain - Year-over-year growth 2025-2030 (%)
Data Table on Spain - Year-over-year growth 2025-2030 (%)

12.4.5 Italy - Market size and forecast 2025-2030

Chart on Italy - Market size and forecast 2025-2030 ($ million)
Data Table on Italy - Market size and forecast 2025-2030 ($ million)
Chart on Italy - Year-over-year growth 2025-2030 (%)
Data Table on Italy - Year-over-year growth 2025-2030 (%)

12.4.6 The Netherlands - Market size and forecast 2025-2030

Chart on The Netherlands - Market size and forecast 2025-2030 ($ million)
Data Table on The Netherlands - Market size and forecast 2025-2030 ($ million)
Chart on The Netherlands - Year-over-year growth 2025-2030 (%)
Data Table on The Netherlands - Year-over-year growth 2025-2030 (%)

12.5 APAC - Market size and forecast 2025-2030

Chart on APAC - Market size and forecast 2025-2030 ($ million)
Data Table on APAC - Market size and forecast 2025-2030 ($ million)
Chart on APAC - Year-over-year growth 2025-2030 (%)
Data Table on APAC - Year-over-year growth 2025-2030 (%)
Chart on Regional Comparison - APAC
Data Table on Regional Comparison - APAC

12.5.1 China - Market size and forecast 2025-2030

Chart on China - Market size and forecast 2025-2030 ($ million)
Data Table on China - Market size and forecast 2025-2030 ($ million)
Chart on China - Year-over-year growth 2025-2030 (%)
Data Table on China - Year-over-year growth 2025-2030 (%)

12.5.2 Japan - Market size and forecast 2025-2030

Chart on Japan - Market size and forecast 2025-2030 ($ million)
Data Table on Japan - Market size and forecast 2025-2030 ($ million)
Chart on Japan - Year-over-year growth 2025-2030 (%)
Data Table on Japan - Year-over-year growth 2025-2030 (%)

12.5.3 South Korea - Market size and forecast 2025-2030

Chart on South Korea - Market size and forecast 2025-2030 ($ million)
Data Table on South Korea - Market size and forecast 2025-2030 ($ million)
Chart on South Korea - Year-over-year growth 2025-2030 (%)
Data Table on South Korea - Year-over-year growth 2025-2030 (%)

12.5.4 India - Market size and forecast 2025-2030

Chart on India - Market size and forecast 2025-2030 ($ million)
Data Table on India - Market size and forecast 2025-2030 ($ million)
Chart on India - Year-over-year growth 2025-2030 (%)
Data Table on India - Year-over-year growth 2025-2030 (%)

12.5.5 Australia - Market size and forecast 2025-2030

Chart on Australia - Market size and forecast 2025-2030 ($ million)
Data Table on Australia - Market size and forecast 2025-2030 ($ million)
Chart on Australia - Year-over-year growth 2025-2030 (%)
Data Table on Australia - Year-over-year growth 2025-2030 (%)

12.5.6 Indonesia - Market size and forecast 2025-2030

Chart on Indonesia - Market size and forecast 2025-2030 ($ million)
Data Table on Indonesia - Market size and forecast 2025-2030 ($ million)
Chart on Indonesia - Year-over-year growth 2025-2030 (%)
Data Table on Indonesia - Year-over-year growth 2025-2030 (%)

12.6 Middle East and Africa - Market size and forecast 2025-2030

Chart on Middle East and Africa - Market size and forecast 2025-2030 ($ million)
Data Table on Middle East and Africa - Market size and forecast 2025-2030 ($ million)
Chart on Middle East and Africa - Year-over-year growth 2025-2030 (%)
Data Table on Middle East and Africa - Year-over-year growth 2025-2030 (%)
Chart on Regional Comparison - Middle East and Africa
Data Table on Regional Comparison - Middle East and Africa

12.6.1 Saudi Arabia - Market size and forecast 2025-2030

Chart on Saudi Arabia - Market size and forecast 2025-2030 ($ million)
Data Table on Saudi Arabia - Market size and forecast 2025-2030 ($ million)
Chart on Saudi Arabia - Year-over-year growth 2025-2030 (%)
Data Table on Saudi Arabia - Year-over-year growth 2025-2030 (%)

12.6.2 South Africa - Market size and forecast 2025-2030

Chart on South Africa - Market size and forecast 2025-2030 ($ million)
Data Table on South Africa - Market size and forecast 2025-2030 ($ million)
Chart on South Africa - Year-over-year growth 2025-2030 (%)
Data Table on South Africa - Year-over-year growth 2025-2030 (%)

12.6.3 Turkey - Market size and forecast 2025-2030

Chart on Turkey - Market size and forecast 2025-2030 ($ million)
Data Table on Turkey - Market size and forecast 2025-2030 ($ million)
Chart on Turkey - Year-over-year growth 2025-2030 (%)
Data Table on Turkey - Year-over-year growth 2025-2030 (%)

12.6.4 UAE - Market size and forecast 2025-2030

Chart on UAE - Market size and forecast 2025-2030 ($ million)
Data Table on UAE - Market size and forecast 2025-2030 ($ million)
Chart on UAE - Year-over-year growth 2025-2030 (%)
Data Table on UAE - Year-over-year growth 2025-2030 (%)

12.6.5 Israel - Market size and forecast 2025-2030

Chart on Israel - Market size and forecast 2025-2030 ($ million)
Data Table on Israel - Market size and forecast 2025-2030 ($ million)
Chart on Israel - Year-over-year growth 2025-2030 (%)
Data Table on Israel - Year-over-year growth 2025-2030 (%)

12.7 South America - Market size and forecast 2025-2030

Chart on South America - Market size and forecast 2025-2030 ($ million)
Data Table on South America - Market size and forecast 2025-2030 ($ million)
Chart on South America - Year-over-year growth 2025-2030 (%)
Data Table on South America - Year-over-year growth 2025-2030 (%)
Chart on Regional Comparison - South America
Data Table on Regional Comparison - South America

12.7.1 Brazil - Market size and forecast 2025-2030

Chart on Brazil - Market size and forecast 2025-2030 ($ million)
Data Table on Brazil - Market size and forecast 2025-2030 ($ million)
Chart on Brazil - Year-over-year growth 2025-2030 (%)
Data Table on Brazil - Year-over-year growth 2025-2030 (%)

12.7.2 Argentina - Market size and forecast 2025-2030

Chart on Argentina - Market size and forecast 2025-2030 ($ million)
Data Table on Argentina - Market size and forecast 2025-2030 ($ million)
Chart on Argentina - Year-over-year growth 2025-2030 (%)
Data Table on Argentina - Year-over-year growth 2025-2030 (%)

12.7.3 Chile - Market size and forecast 2025-2030

Chart on Chile - Market size and forecast 2025-2030 ($ million)
Data Table on Chile - Market size and forecast 2025-2030 ($ million)
Chart on Chile - Year-over-year growth 2025-2030 (%)
Data Table on Chile - Year-over-year growth 2025-2030 (%)

12.8 Market opportunity by geography

Market opportunity by geography ($ million)
Data Tables on Market opportunity by geography ($ million)

13. Drivers, Challenges, and Opportunity

13.1 Market drivers

Strategic mainstreaming of agentic AI and autonomous decision-support systems
Proliferation of end-to-end visibility platforms and multi-tier supplier transparency
Evolution of cloud-native orchestration and rise of dynamic freight optimization API

13.2 Market challenges

Interoperability deficits and complexity of legacy infrastructure synchronization
Escalating cyber-physical risks and vulnerability of interconnected software ecosystems
Strategic workforce deficits and barrier of advanced analytical literacy

13.3 Impact of drivers and challenges

Impact of drivers and challenges in 2025 and 2030

13.4 Market opportunities

Mandatory sustainability and ESG compliance digitalization
Integration of circular supply chain platforms and material recovery tracking
Democratization of SCM development through low-code and no-code platforms

14. Competitive Landscape

14.1 Overview

14.2

Overview on criticality of inputs and factors of differentiation

14.3 Landscape disruption

Overview on factors of disruption

14.4 Industry risks

Impact of key risks on business

15. Competitive Analysis

15.1 Companies profiled

Companies covered

15.2 Company ranking index

15.3 Market positioning of companies

Matrix on companies position and classification

15.4 Blue Yonder Group Inc.

Blue Yonder Group Inc. - Overview
Blue Yonder Group Inc. - Product / Service
Blue Yonder Group Inc. - Key offerings
SWOT

15.5 Coupa Software Inc.

Coupa Software Inc. - Overview
Coupa Software Inc. - Product / Service
Coupa Software Inc. - Key offerings
SWOT

15.6 Descartes Systems Group Inc.

Descartes Systems Group Inc. - Overview
Descartes Systems Group Inc. - Business segments
Descartes Systems Group Inc. - Key offerings
Descartes Systems Group Inc. - Segment focus
SWOT

15.7 E2open Parent Holdings Inc.

E2open Parent Holdings Inc. - Overview
E2open Parent Holdings Inc. - Business segments
E2open Parent Holdings Inc. - Key news
E2open Parent Holdings Inc. - Key offerings
E2open Parent Holdings Inc. - Segment focus
SWOT

15.8 Epicor Software Corp.

Epicor Software Corp. - Overview
Epicor Software Corp. - Product / Service
Epicor Software Corp. - Key news
Epicor Software Corp. - Key offerings
SWOT

15.9 IBM Corp.

IBM Corp. - Overview
IBM Corp. - Business segments
IBM Corp. - Key news
IBM Corp. - Key offerings
IBM Corp. - Segment focus
SWOT

15.10 Infor Inc.

Infor Inc. - Overview
Infor Inc. - Product / Service
Infor Inc. - Key news
Infor Inc. - Key offerings
SWOT

15.11 Kinaxis Inc.

Kinaxis Inc. - Overview
Kinaxis Inc. - Product / Service
Kinaxis Inc. - Key news
Kinaxis Inc. - Key offerings
SWOT

15.12 Magaya Corp.

Magaya Corp. - Overview
Magaya Corp. - Product / Service
Magaya Corp. - Key offerings
SWOT

15.13 Manhattan Associates Inc.

Manhattan Associates Inc. - Overview
Manhattan Associates Inc. - Business segments
Manhattan Associates Inc. - Key news
Manhattan Associates Inc. - Key offerings
Manhattan Associates Inc. - Segment focus
SWOT

15.14 Microsoft Corp.

Microsoft Corp. - Overview
Microsoft Corp. - Business segments
Microsoft Corp. - Key news
Microsoft Corp. - Key offerings
Microsoft Corp. - Segment focus
SWOT

15.15 o9 Solutions Inc.

o9 Solutions Inc. - Overview
o9 Solutions Inc. - Product / Service
o9 Solutions Inc. - Key offerings
SWOT

15.16 Oracle Corp.

Oracle Corp. - Overview
Oracle Corp. - Business segments
Oracle Corp. - Key news
Oracle Corp. - Key offerings
Oracle Corp. - Segment focus
SWOT

15.17 Panasonic Holdings Corp.

Panasonic Holdings Corp. - Overview
Panasonic Holdings Corp. - Business segments
Panasonic Holdings Corp. - Key news
Panasonic Holdings Corp. - Key offerings
Panasonic Holdings Corp. - Segment focus
SWOT

15.18 SAP SE

SAP SE - Overview
SAP SE - Business segments
SAP SE - Key news
SAP SE - Key offerings
SAP SE - Segment focus
SWOT

16. Appendix

16.1 Scope of the report

Market definition
Objectives
Notes and caveats

16.2 Inclusions and exclusions checklist

Inclusions checklist
Exclusions checklist

16.3 Currency conversion rates for US$

16.4 Research methodology

16.5 Data procurement

Information sources

16.6 Data validation

16.7 Validation techniques employed for market sizing

16.8 Data synthesis

16.9 360 degree market analysis

16.10 List of abbreviations

Research Methodology

Technavio presents a detailed picture of the market by way of study, synthesis, and summation of data from multiple sources. The analysts have presented the various facets of the market with a particular focus on identifying the key industry influencers. The data thus presented is comprehensive, reliable, and the result of extensive research, both primary and secondary.

INFORMATION SOURCES

Primary sources

  • Manufacturers and suppliers
  • Channel partners
  • Industry experts
  • Strategic decision makers

Secondary sources

  • Industry journals and periodicals
  • Government data
  • Financial reports of key industry players
  • Historical data
  • Press releases

DATA ANALYSIS

Data Synthesis

  • Collation of data
  • Estimation of key figures
  • Analysis of derived insights

Data Validation

  • Triangulation with data models
  • Reference against proprietary databases
  • Corroboration with industry experts

REPORT WRITING

Qualitative

  • Market drivers
  • Market challenges
  • Market trends
  • Five forces analysis

Quantitative

  • Market size and forecast
  • Market segmentation
  • Geographical insights
  • Competitive landscape

Interested in this report?

Get your sample now to see our research methodology and insights!

Download Now

Frequently Asked Questions

Supply Chain Management (SCM) Software market growth will increase by USD 29629.7 million during 2026-2030.

The Supply Chain Management (SCM) Software market is expected to grow at a CAGR of 15.2% during 2026-2030.

Supply Chain Management (SCM) Software market is segmented by Application (SCP, Procurement, WMS, TMS) Deployment (On-premises, Cloud-based) Component (Software, Services)

Blue Yonder Group Inc., Coupa Software Inc., Descartes Systems Group Inc., E2open Parent Holdings Inc., Epicor Software Corp., IBM Corp., Infor Inc., Jaggaer LLC, Kinaxis Inc., Logility SCS Inc., Magaya Corp., Manhattan Associates Inc., Microsoft Corp., o9 Solutions Inc., Oracle Corp., Panasonic Holdings Corp., SAP SE, Solvoyo Co., StockIQ Technologies Inc., Webgility Inc. are a few of the key vendors in the Supply Chain Management (SCM) Software market.

North America will register the highest growth rate of 35.8% among the other regions. Therefore, the Supply Chain Management (SCM) Software market in North America is expected to garner significant business opportunities for the vendors during the forecast period.

US, Canada, Mexico, UK, Germany, France, Spain, Italy, The Netherlands, China, Japan, South Korea, India, Australia, Indonesia, Saudi Arabia, South Africa, Turkey, UAE, Israel, Brazil, Argentina, Chile

  • Strategic mainstreaming of agentic AI and autonomous decision-support systems is the driving factor this market.

The Supply Chain Management (SCM) Software market vendors should focus on grabbing business opportunities from the Application segment as it accounted for the largest market share in the base year.