Black Mass Recycling Market Analysis, Size, and Forecast 2026-2030: APAC (China, Japan, and India), Europe (Germany, UK, and France), North America (US, Canada, and Mexico), Middle East and Africa (Saudi Arabia, UAE, and South Africa), South America (Brazil, Argentina, and Colombia), and Rest of World (ROW)

Black Mass Recycling Market Analysis, Size, and Forecast 2026-2030:
APAC (China, Japan, and India), Europe (Germany, UK, and France), North America (US, Canada, and Mexico), Middle East and Africa (Saudi Arabia, UAE, and South Africa), South America (Brazil, Argentina, and Colombia), and Rest of World (ROW)

Published: Jan 2026 303 Pages SKU: IRTNTR81230

Market Overview at a Glance

$22.08 B
Market Opportunity
18.5%
CAGR 2025 - 2030
50.7%
APAC Growth
$6.96 B
Hydrometallurgy segment 2024

Black Mass Recycling Market Size 2026-2030

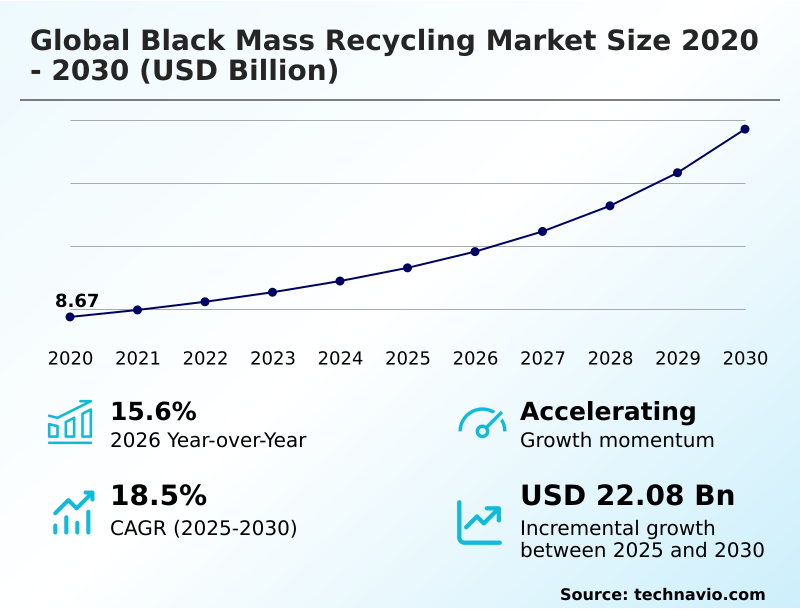
The black mass recycling market size is valued to increase by USD 22.08 billion, at a CAGR of 18.5% from 2025 to 2030. Localization of critical mineral supply chains to mitigate geopolitical risks will drive the black mass recycling market.

Major Market Trends & Insights

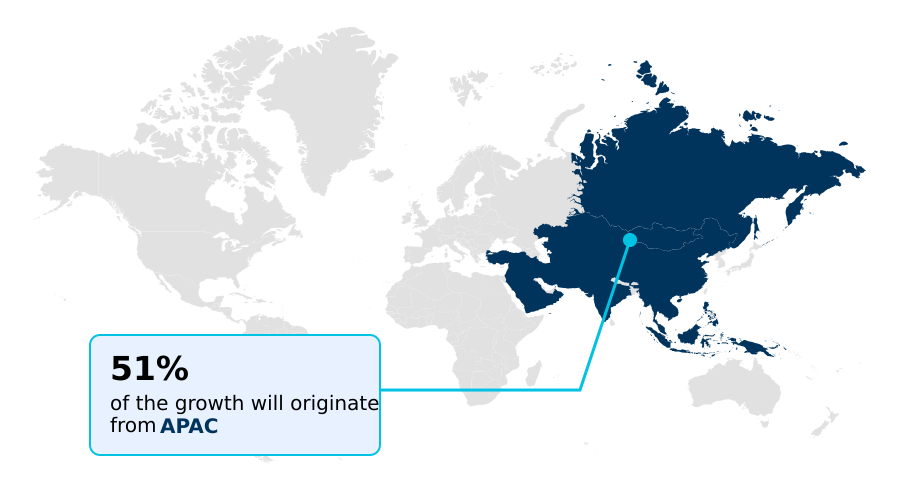
  • APAC dominated the market and accounted for a 50.7% growth during the forecast period.
  • By Technology - Hydrometallurgy segment was valued at USD 6.96 billion in 2024
  • By Material Type - Nickel segment accounted for the largest market revenue share in 2024

Market Size & Forecast

  • Market Opportunities: USD 29.88 billion
  • Market Future Opportunities: USD 22.08 billion
  • CAGR from 2025 to 2030 : 18.5%

Market Summary

  • The black mass recycling market is rapidly transitioning from a niche waste management activity into a cornerstone of the global energy transition. Driven by the need for raw material security and stringent environmental mandates, this sector focuses on the waste stream valorization of end-of-life batteries and gigafactory manufacturing scrap.
  • The industry is pivotal in creating a circular economy by recovering critical minerals and reintroducing them into the battery value chain.
  • For instance, an automotive OEM might partner with a recycler to establish a closed-loop supply chain, ensuring that the battery-grade metals from its old vehicles are processed through advanced hydrometallurgical processes to create the precursor materials for its next generation of EVs.
  • This not only mitigates supply chain volatility but also addresses challenges like feedstock heterogeneity and hazardous waste classification, turning a potential liability into a strategic asset for battery cell production. This evolution underscores the market's role in delivering sustainable metal sourcing and enhancing recycling efficiency.

What will be the Size of the Black Mass Recycling Market during the forecast period?

Get Key Insights on Market Forecast (PDF) Request Free Sample

How is the Black Mass Recycling Market Segmented?

The black mass recycling industry research report provides comprehensive data (region-wise segment analysis), with forecasts and estimates in "USD million" for the period 2026-2030, as well as historical data from 2020-2024 for the following segments.

  • Technology
    • Hydrometallurgy
    • Pyrometallurgy
    • Others
  • Material type
    • Nickel
    • Cobalt
    • Lithium
    • Copper
    • Others
  • Source
    • Automotive
    • Consumer electronics
    • Industrial and power
    • Others
  • Geography
    • APAC
      • China
      • Japan
      • India
    • Europe
      • Germany
      • UK
      • France
    • North America
      • US
      • Canada
      • Mexico
    • Middle East and Africa
      • Saudi Arabia
      • UAE
      • South Africa
    • South America
      • Brazil
      • Argentina
      • Colombia
    • Rest of World (ROW)

By Technology Insights

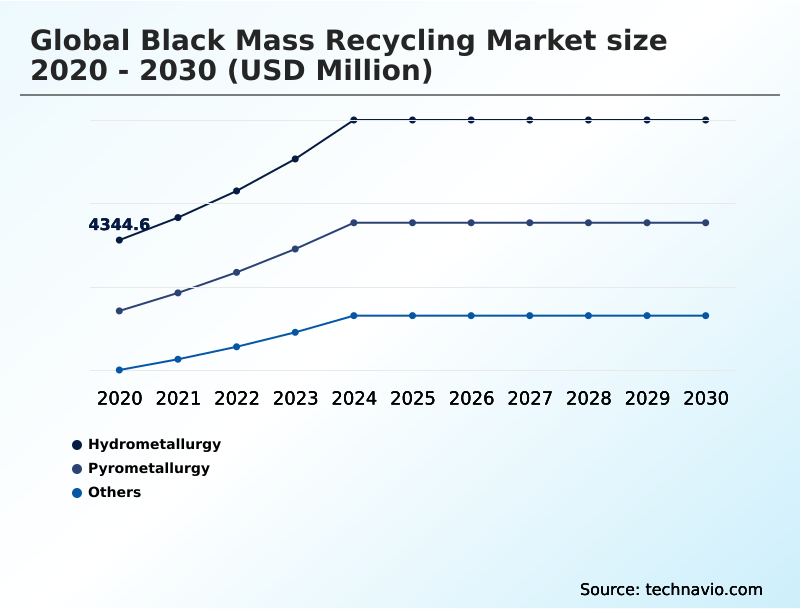
The hydrometallurgy segment is estimated to witness significant growth during the forecast period.

The market is increasingly adopting advanced hydrometallurgical processes for black mass refining, driven by the need for sustainable metal sourcing across the EV battery lifecycle.

This approach utilizes aqueous chemistry and specific chemical reagents in a controlled leaching process to achieve superior battery material recovery and recycling efficiency. Unlike smelting vs. leaching comparisons that highlight pyrometallurgy's energy use, hydrometallurgical refining operates at lower temperatures.

Through precise techniques like solvent extraction, it yields high-purity metals. This method's efficiency is notable, with metal recovery rates for critical minerals often exceeding 95%, making it pivotal for producing battery-grade metals and advancing e-waste management.

Request Free Sample

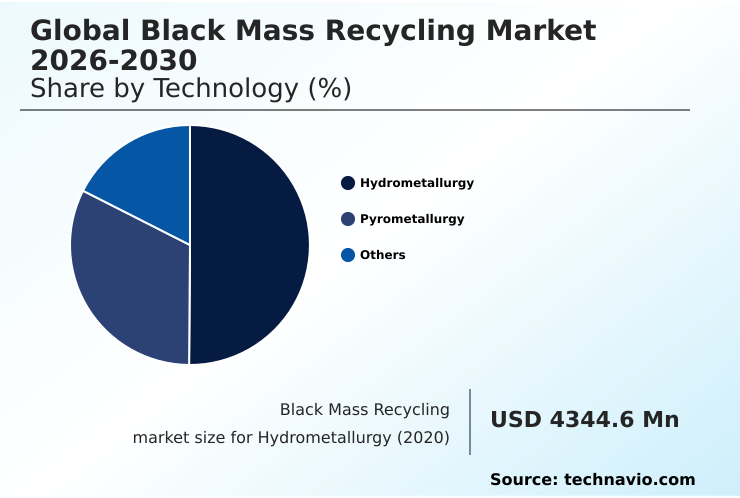
The Hydrometallurgy segment was valued at USD 6.96 billion in 2024 and showed a gradual increase during the forecast period.

Request Free Sample

Regional Analysis

APAC is estimated to contribute 50.7% to the growth of the global market during the forecast period.Technavio’s analysts have elaborately explained the regional trends and drivers that shape the market during the forecast period.

See How Black Mass Recycling Market Demand is Rising in APAC Request Free Sample

The geographic landscape is dominated by APAC, which commands over 50% of the market opportunity, driven by established infrastructure for processing gigafactory scrap and end-of-life batteries. This region excels at urban mining and waste stream valorization, achieving high recycling efficiency.

Europe's market is shaped by the Critical Raw Materials Act, which promotes closed-loop manufacturing to secure conflict-free minerals and address geopolitical risk mitigation pressures.

North America is rapidly building out its battery value chain with incentives for domestic mineral refining to produce cathode active materials.

The payables pricing mechanism remains a critical factor influencing trade flows for black mass refining between these dominant regions, which are all striving for a more circular supply chain.

Market Dynamics

Our researchers analyzed the data with 2025 as the base year, along with the key drivers, trends, and challenges. A holistic analysis of drivers will help companies refine their marketing strategies to gain a competitive advantage.

  • The economic viability of the global black mass recycling market 2026-2030 is subject to complex variables, making hydrometallurgical plant investment decisions exceptionally challenging. The impact of LFP on recycling economics is profound, as these batteries lack the high-value metals of NMC chemistries, altering the entire black mass pricing formula analysis.
  • A key industry focus is on improving lithium recovery from black mass, as traditional methods often resulted in losses. The sourcing strategies for black mass are complicated by the need for standardizing black mass quality metrics, as impurity removal techniques are costly.
  • Furthermore, the role of black mass in the circular economy is conditional upon overcoming hurdles like the high cost of black mass transportation and navigating complex regulations for shipping battery waste. The debate comparing pyrometallurgy and hydrometallurgy continues, though advanced hydrometallurgical methods can achieve recovery rates over 25% higher than smelting for certain critical metals.
  • Effective risk management in battery recycling is essential for achieving battery-grade metal purity and scaling capacity, confirming black mass as a strategic asset rather than mere waste.

What are the key market drivers leading to the rise in the adoption of Black Mass Recycling Industry?

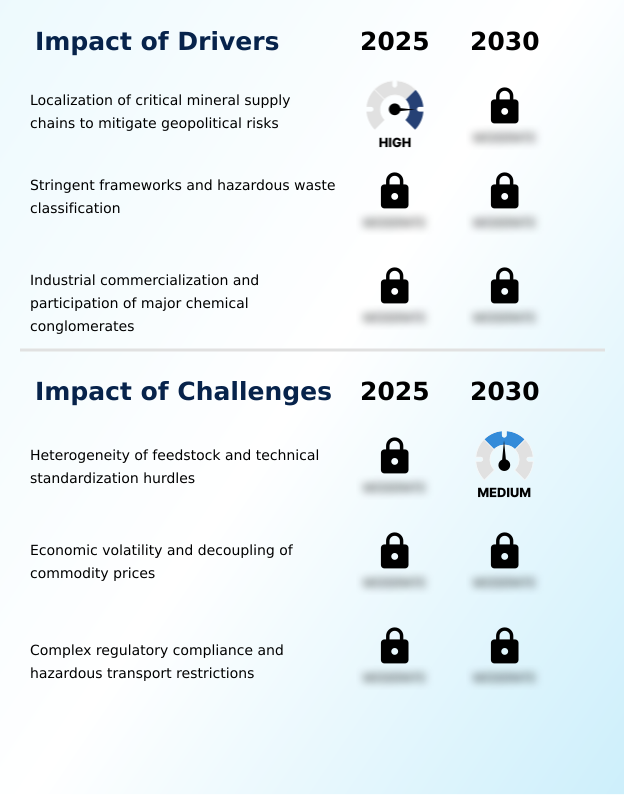
  • The imperative to localize critical mineral supply chains and mitigate geopolitical risks serves as a primary driver for the market.

  • Supply chain localization is a primary driver, as nations seek to secure domestic sources of critical minerals and reduce reliance on foreign entities.
  • This push is reinforced by recycled content mandates, which compel manufacturers to use secondary raw material from sources like gigafactory manufacturing scrap, thereby driving Scope 3 emissions reduction.
  • These regulations necessitate investment in industrial-scale refining infrastructure for both black mass refining and battery dismantling.
  • Stringent hazardous waste classification rules are also forcing a shift from export models to domestic processing, stimulating the market even when there is no significant green premium on metals from buyers.
  • Investment in domestic facilities has increased by over 200% in some regions.

What are the market trends shaping the Black Mass Recycling Industry?

  • The market is characterized by an accelerating trend toward strategic vertical integration. This movement is fostering the development of closed-loop ecosystems to enhance supply chain security.

  • A dominant trend is the formation of a closed-loop supply chain, where automakers and recyclers partner to enhance raw material security for future battery cell production. This move toward a circular economy is supported by logistical innovations like hub-and-spoke logistics, which can cut transport costs for shredded battery material by over 30%.
  • Digital tools such as battery passport systems are being implemented to track materials, aligning with the end-of-life vehicle directive. While pyrometallurgical methods are still used, emerging direct recycling technology aims to rejuvenate cathode materials directly.
  • This, combined with a focus on design for disassembly, is critical for building strategic mineral reserves from secondary sources and creating a truly circular supply chain.

What challenges does the Black Mass Recycling Industry face during its growth?

  • Significant industry growth challenges include the inherent heterogeneity of feedstock and persistent hurdles in technical standardization.

  • Feedstock heterogeneity is a major market challenge, as recyclers must handle a chaotic mix of battery types, from nickel-manganese-cobalt (NMC) to lithium iron phosphate (LFP). This variability in cathode chemistry complicates the production of consistent precursor materials. A shift in battery chemistry can alter the value of the ore-grade equivalent in black mass by over 50%.
  • The thermal runaway risk during the processing of materials from energy storage recycling requires specialized, costly protocols. Furthermore, complex regulations on transboundary waste movement restrict the flow of feedstock to large, efficient facilities, with compliance costs adding 15-20% to overall expenses, creating logistical bottlenecks.

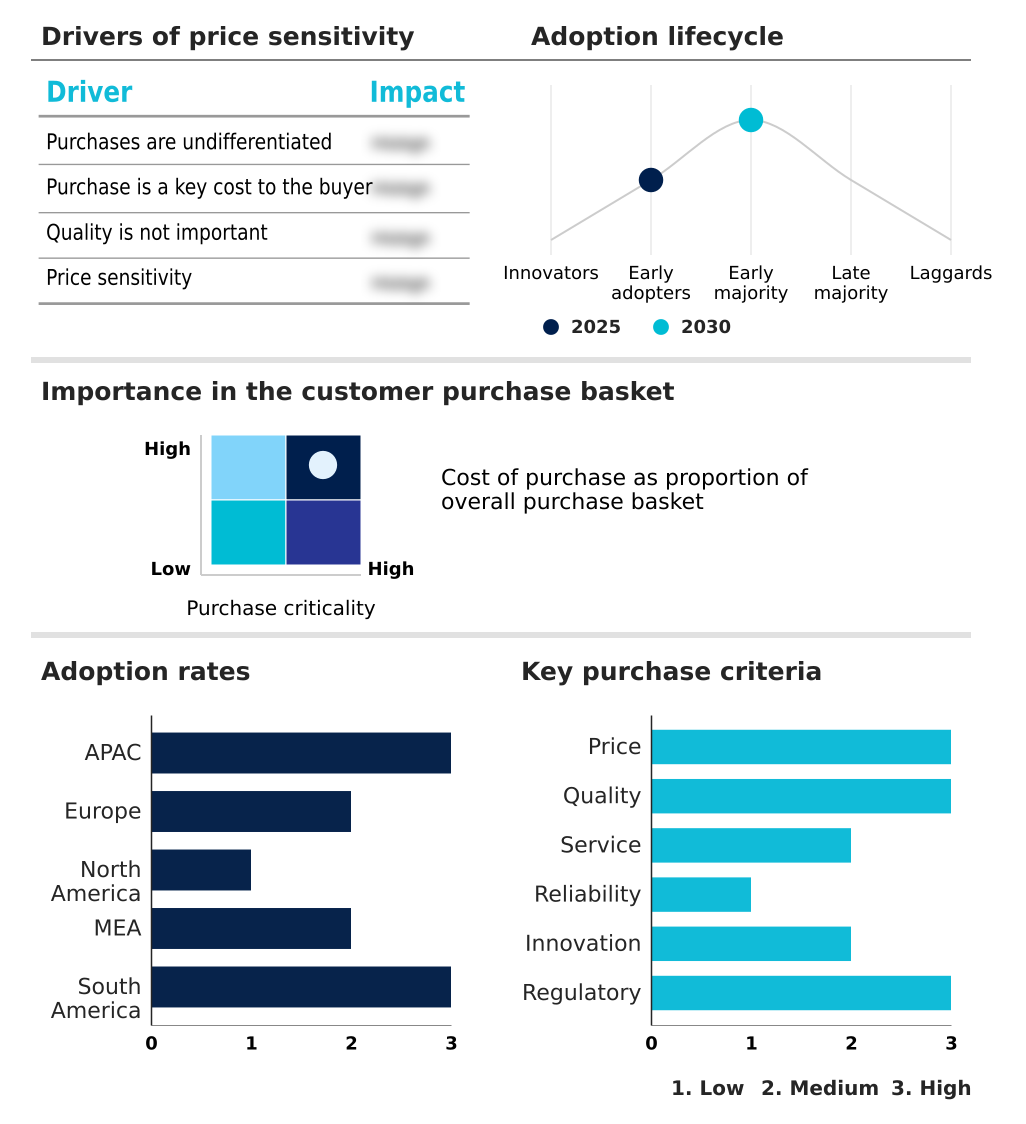
Exclusive Technavio Analysis on Customer Landscape

The black mass recycling market forecasting report includes the adoption lifecycle of the market, covering from the innovator’s stage to the laggard’s stage. It focuses on adoption rates in different regions based on penetration. Furthermore, the black mass recycling market report also includes key purchase criteria and drivers of price sensitivity to help companies evaluate and develop their market growth analysis strategies.

Customer Landscape of Black Mass Recycling Industry

Competitive Landscape

Companies are implementing various strategies, such as strategic alliances, black mass recycling market forecast, partnerships, mergers and acquisitions, geographical expansion, and product/service launches, to enhance their presence in the industry.

Akkuser Oy - Expertise centers on producing precursor and cathode active materials from recycled black mass, integrating circular economy principles into the battery value chain.

The industry research and growth report includes detailed analyses of the competitive landscape of the market and information about key companies, including:

  • Akkuser Oy
  • American Battery Technology Co.
  • Aqua Metals Inc.
  • BASF SE
  • Duesenfeld GmbH
  • Ecobat LLC
  • Fortum Oyj
  • GEM Co. Ltd.
  • Glencore Plc
  • Li Cycle Holdings Corp.
  • Neometals Ltd.
  • Primobius GmbH
  • RecycLiCo Battery Materials
  • Redwood Materials Inc.
  • SungEel Hi Tech Co. Ltd.
  • Tenova Spa
  • Umicore SA

Qualitative and quantitative analysis of companies has been conducted to help clients understand the wider business environment as well as the strengths and weaknesses of key industry players. Data is qualitatively analyzed to categorize companies as pure play, category-focused, industry-focused, and diversified; it is quantitatively analyzed to categorize companies as dominant, leading, strong, tentative, and weak.

Recent Development and News in Black mass recycling market

  • In May 2025, Northvolt announced a strategic recalibration of its Revolt recycling operations, temporarily reducing throughput rates at its hydrometallurgical facilities to retrofit filtration systems capable of handling higher-than-anticipated impurity profiles in incoming black mass.
  • In April 2025, Redwood Materials Inc. officially commenced operations at the second phase of its Battery Materials Campus near Charleston, South Carolina, significantly increasing its capacity to process end-of-life electric vehicle batteries and manufacturing scrap.
  • In March 2025, the European Commission updated the European List of Waste to formally classify black mass from lithium-ion batteries as hazardous waste, a measure intended to halt the leakage of critical raw materials to non-OECD nations.
  • In February 2025, Umicore issued an investor update revising its guidance for its battery recycling business unit, citing the sustained depression of lithium carbonate spot prices as the primary factor for delaying a final investment decision on a planned large-scale battery recycling plant in North America.

Dive into Technavio’s robust research methodology, blending expert interviews, extensive data synthesis, and validated models for unparalleled Black Mass Recycling Market insights. See full methodology.

Market Scope
Page number 303
Base year 2025
Historic period 2020-2024
Forecast period 2026-2030
Growth momentum & CAGR Accelerate at a CAGR of 18.5%
Market growth 2026-2030 USD 22075.7 million
Market structure Fragmented
YoY growth 2025-2026(%) 15.6%
Key countries China, Japan, India, South Korea, Australia, Indonesia, Germany, UK, France, Italy, The Netherlands, Spain, US, Canada, Mexico, Saudi Arabia, UAE, South Africa, Israel, Turkey, Brazil, Argentina and Colombia
Competitive landscape Leading Companies, Market Positioning of Companies, Competitive Strategies, and Industry Risks

Request Free Sample

Research Analyst Overview

  • The black mass recycling market is undergoing a fundamental re-evaluation, shifting from a waste management function to a strategic pillar of raw material security. At the boardroom level, this pivot forces a critical decision: whether to secure long-term feedstock contracts or invest heavily in proprietary direct recycling technology.
  • The sector's operational viability hinges on managing the extreme feedstock heterogeneity of shredded battery material from end-of-life batteries. For example, a mere 1% increase in certain impurities within the anode material can reduce the efficiency of the leaching process by up to 15%, disrupting the production of precursor materials. This sensitivity underscores the importance of advanced battery dismantling and sorting.
  • As the industry matures, the focus is on optimizing chemical reagents, improving the smelting process, and enhancing recycling efficiency to ensure that the recovery of critical minerals like lithium iron phosphate (LFP) creates a truly resilient and circular economy.

What are the Key Data Covered in this Black Mass Recycling Market Research and Growth Report?

  • What is the expected growth of the Black Mass Recycling Market between 2026 and 2030?

    • USD 22.08 billion, at a CAGR of 18.5%

  • What segmentation does the market report cover?

    • The report is segmented by Technology (Hydrometallurgy, Pyrometallurgy, and Others), Material Type (Nickel, Cobalt, Lithium, Copper, and Others), Source (Automotive, Consumer electronics, Industrial and power, and Others) and Geography (APAC, Europe, North America, Middle East and Africa, South America)

  • Which regions are analyzed in the report?

    • APAC, Europe, North America, Middle East and Africa and South America

  • What are the key growth drivers and market challenges?

    • Localization of critical mineral supply chains to mitigate geopolitical risks, Heterogeneity of feedstock and technical standardization hurdles

  • Who are the major players in the Black Mass Recycling Market?

    • Akkuser Oy, American Battery Technology Co., Aqua Metals Inc., BASF SE, Duesenfeld GmbH, Ecobat LLC, Fortum Oyj, GEM Co. Ltd., Glencore Plc, Li Cycle Holdings Corp., Neometals Ltd., Primobius GmbH, RecycLiCo Battery Materials, Redwood Materials Inc., SungEel Hi Tech Co. Ltd., Tenova Spa and Umicore SA

Market Research Insights

  • Market dynamics are shaped by a complex interplay of economic and regulatory factors. While advanced hydrometallurgical refining processes can achieve battery material recovery rates exceeding 95%, buyers often exhibit high price sensitivity, benchmarking recycled materials against volatile virgin-mined equivalents. This creates a challenging environment where the green premium on metals is not always realized.
  • Recycled content mandates and the critical raw materials act are creating locked-in demand, forcing supply chain localization and investment in industrial-scale refining. However, the payables pricing mechanism for feedstock remains a key variable, influencing profitability. Firms are adopting hub-and-spoke logistics models to manage costs associated with transboundary waste movement and mitigate geopolitical risk, establishing a more resilient circular supply chain.

We can help! Our analysts can customize this black mass recycling market research report to meet your requirements.

Get in touch

1. Executive Summary

1.1 Market overview

Executive Summary - Chart on Market Overview
Executive Summary - Data Table on Market Overview
Executive Summary - Chart on Global Market Characteristics
Executive Summary - Chart on Market by Geography
Executive Summary - Chart on Market Segmentation by Technology
Executive Summary - Chart on Market Segmentation by Material Type
Executive Summary - Chart on Market Segmentation by Source
Executive Summary - Chart on Incremental Growth
Executive Summary - Data Table on Incremental Growth
Executive Summary - Chart on Company Market Positioning

2. Technavio Analysis

2.1 Analysis of price sensitivity, lifecycle, customer purchase basket, adoption rates, and purchase criteria

2.2 Criticality of inputs and Factors of differentiation

Chart on Overview on criticality of inputs and factors of differentiation

2.3 Factors of disruption

Chart on Overview on factors of disruption

2.4 Impact of drivers and challenges

Chart on Impact of drivers and challenges in 2025 and 2030

3. Market Landscape

3.1 Market ecosystem

Chart on Parent Market
Data Table on - Parent Market

3.2 Market characteristics

Chart on Market characteristics analysis

3.3 Value chain analysis

Chart on Value chain analysis

4. Market Sizing

4.1 Market definition

Data Table on Offerings of companies included in the market definition

4.2 Market segment analysis

Market segments

4.3 Market size 2025

4.4 Market outlook: Forecast for 2025-2030

Chart on Global - Market size and forecast 2025-2030 ($ million)
Data Table on Global - Market size and forecast 2025-2030 ($ million)
Chart on Global Market: Year-over-year growth 2025-2030 (%)
Data Table on Global Market: Year-over-year growth 2025-2030 (%)

5. Historic Market Size

5.1 Global Black Mass Recycling Market 2020 - 2024

Historic Market Size - Data Table on Global Black Mass Recycling Market 2020 - 2024 ($ million)

5.2 Technology segment analysis 2020 - 2024

Historic Market Size - Technology Segment 2020 - 2024 ($ million)

5.3 Material Type segment analysis 2020 - 2024

Historic Market Size - Material Type Segment 2020 - 2024 ($ million)

5.4 Source segment analysis 2020 - 2024

Historic Market Size - Source Segment 2020 - 2024 ($ million)

5.5 Geography segment analysis 2020 - 2024

Historic Market Size - Geography Segment 2020 - 2024 ($ million)

5.6 Country segment analysis 2020 - 2024

Historic Market Size - Country Segment 2020 - 2024 ($ million)

6. Qualitative Analysis

6.1 The AI impact on global black mass recycling market

7. Five Forces Analysis

7.1 Five forces summary

Five forces analysis - Comparison between 2025 and 2030

7.2 Bargaining power of buyers

Bargaining power of buyers - Impact of key factors 2025 and 2030

7.3 Bargaining power of suppliers

Bargaining power of suppliers - Impact of key factors in 2025 and 2030

7.4 Threat of new entrants

Threat of new entrants - Impact of key factors in 2025 and 2030

7.5 Threat of substitutes

Threat of substitutes - Impact of key factors in 2025 and 2030

7.6 Threat of rivalry

Threat of rivalry - Impact of key factors in 2025 and 2030

7.7 Market condition

Chart on Market condition - Five forces 2025 and 2030

8. Market Segmentation by Technology

8.1 Market segments

Chart on Technology - Market share 2025-2030 (%)
Data Table on Technology - Market share 2025-2030 (%)

8.2 Comparison by Technology

Chart on Comparison by Technology
Data Table on Comparison by Technology

8.3 Hydrometallurgy - Market size and forecast 2025-2030

Chart on Hydrometallurgy - Market size and forecast 2025-2030 ($ million)
Data Table on Hydrometallurgy - Market size and forecast 2025-2030 ($ million)
Chart on Hydrometallurgy - Year-over-year growth 2025-2030 (%)
Data Table on Hydrometallurgy - Year-over-year growth 2025-2030 (%)

8.4 Pyrometallurgy - Market size and forecast 2025-2030

Chart on Pyrometallurgy - Market size and forecast 2025-2030 ($ million)
Data Table on Pyrometallurgy - Market size and forecast 2025-2030 ($ million)
Chart on Pyrometallurgy - Year-over-year growth 2025-2030 (%)
Data Table on Pyrometallurgy - Year-over-year growth 2025-2030 (%)

8.5 Others - Market size and forecast 2025-2030

Chart on Others - Market size and forecast 2025-2030 ($ million)
Data Table on Others - Market size and forecast 2025-2030 ($ million)
Chart on Others - Year-over-year growth 2025-2030 (%)
Data Table on Others - Year-over-year growth 2025-2030 (%)

8.6 Market opportunity by Technology

Market opportunity by Technology ($ million)
Data Table on Market opportunity by Technology ($ million)

9. Market Segmentation by Material Type

9.1 Market segments

Chart on Market Segmentation by Material Type - Market share 2025-2030 (%)
Data Table on Market Segmentation by Material Type - Market share 2025-2030 (%)

9.2 Comparison by Market Segmentation by Material Type

Chart on Comparison by Market Segmentation by Material Type
Data Table on Comparison by Market Segmentation by Material Type

9.3 Nickel - Market size and forecast 2025-2030

Chart on Nickel - Market size and forecast 2025-2030 ($ million)
Data Table on Nickel - Market size and forecast 2025-2030 ($ million)
Chart on Nickel - Year-over-year growth 2025-2030 (%)
Data Table on Nickel - Year-over-year growth 2025-2030 (%)

9.4 Cobalt - Market size and forecast 2025-2030

Chart on Cobalt - Market size and forecast 2025-2030 ($ million)
Data Table on Cobalt - Market size and forecast 2025-2030 ($ million)
Chart on Cobalt - Year-over-year growth 2025-2030 (%)
Data Table on Cobalt - Year-over-year growth 2025-2030 (%)

9.5 Lithium - Market size and forecast 2025-2030

Chart on Lithium - Market size and forecast 2025-2030 ($ million)
Data Table on Lithium - Market size and forecast 2025-2030 ($ million)
Chart on Lithium - Year-over-year growth 2025-2030 (%)
Data Table on Lithium - Year-over-year growth 2025-2030 (%)

9.6 Copper - Market size and forecast 2025-2030

Chart on Copper - Market size and forecast 2025-2030 ($ million)
Data Table on Copper - Market size and forecast 2025-2030 ($ million)
Chart on Copper - Year-over-year growth 2025-2030 (%)
Data Table on Copper - Year-over-year growth 2025-2030 (%)

9.7 Others - Market size and forecast 2025-2030

Chart on Others - Market size and forecast 2025-2030 ($ million)
Data Table on Others - Market size and forecast 2025-2030 ($ million)
Chart on Others - Year-over-year growth 2025-2030 (%)
Data Table on Others - Year-over-year growth 2025-2030 (%)

9.8 Market opportunity by Market Segmentation by Material Type

Market opportunity by Market Segmentation by Material Type ($ million)
Data Table on Market opportunity by Market Segmentation by Material Type ($ million)

10. Market Segmentation by Source

10.1 Market segments

Chart on Source - Market share 2025-2030 (%)
Data Table on Source - Market share 2025-2030 (%)

10.2 Comparison by Source

Chart on Comparison by Source
Data Table on Comparison by Source

10.3 Automotive - Market size and forecast 2025-2030

Chart on Automotive - Market size and forecast 2025-2030 ($ million)
Data Table on Automotive - Market size and forecast 2025-2030 ($ million)
Chart on Automotive - Year-over-year growth 2025-2030 (%)
Data Table on Automotive - Year-over-year growth 2025-2030 (%)

10.4 Consumer electronics - Market size and forecast 2025-2030

Chart on Consumer electronics - Market size and forecast 2025-2030 ($ million)
Data Table on Consumer electronics - Market size and forecast 2025-2030 ($ million)
Chart on Consumer electronics - Year-over-year growth 2025-2030 (%)
Data Table on Consumer electronics - Year-over-year growth 2025-2030 (%)

10.5 Industrial and power - Market size and forecast 2025-2030

Chart on Industrial and power - Market size and forecast 2025-2030 ($ million)
Data Table on Industrial and power - Market size and forecast 2025-2030 ($ million)
Chart on Industrial and power - Year-over-year growth 2025-2030 (%)
Data Table on Industrial and power - Year-over-year growth 2025-2030 (%)

10.6 Others - Market size and forecast 2025-2030

Chart on Others - Market size and forecast 2025-2030 ($ million)
Data Table on Others - Market size and forecast 2025-2030 ($ million)
Chart on Others - Year-over-year growth 2025-2030 (%)
Data Table on Others - Year-over-year growth 2025-2030 (%)

10.7 Market opportunity by Source

Market opportunity by Source ($ million)
Data Table on Market opportunity by Source ($ million)

11. Customer Landscape

11.1 Customer landscape overview

Analysis of price sensitivity, lifecycle, customer purchase basket, adoption rates, and purchase criteria

12. Geographic Landscape

12.1 Geographic segmentation

Chart on Market share by geography 2025-2030 (%)
Data Table on Market share by geography 2025-2030 (%)

12.2 Geographic comparison

Chart on Geographic comparison
Data Table on Geographic comparison

12.3 APAC - Market size and forecast 2025-2030

Chart on APAC - Market size and forecast 2025-2030 ($ million)
Data Table on APAC - Market size and forecast 2025-2030 ($ million)
Chart on APAC - Year-over-year growth 2025-2030 (%)
Data Table on APAC - Year-over-year growth 2025-2030 (%)
Chart on Regional Comparison - APAC
Data Table on Regional Comparison - APAC

12.3.1 China - Market size and forecast 2025-2030

Chart on China - Market size and forecast 2025-2030 ($ million)
Data Table on China - Market size and forecast 2025-2030 ($ million)
Chart on China - Year-over-year growth 2025-2030 (%)
Data Table on China - Year-over-year growth 2025-2030 (%)

12.3.2 Japan - Market size and forecast 2025-2030

Chart on Japan - Market size and forecast 2025-2030 ($ million)
Data Table on Japan - Market size and forecast 2025-2030 ($ million)
Chart on Japan - Year-over-year growth 2025-2030 (%)
Data Table on Japan - Year-over-year growth 2025-2030 (%)

12.3.3 India - Market size and forecast 2025-2030

Chart on India - Market size and forecast 2025-2030 ($ million)
Data Table on India - Market size and forecast 2025-2030 ($ million)
Chart on India - Year-over-year growth 2025-2030 (%)
Data Table on India - Year-over-year growth 2025-2030 (%)

12.3.4 South Korea - Market size and forecast 2025-2030

Chart on South Korea - Market size and forecast 2025-2030 ($ million)
Data Table on South Korea - Market size and forecast 2025-2030 ($ million)
Chart on South Korea - Year-over-year growth 2025-2030 (%)
Data Table on South Korea - Year-over-year growth 2025-2030 (%)

12.3.5 Australia - Market size and forecast 2025-2030

Chart on Australia - Market size and forecast 2025-2030 ($ million)
Data Table on Australia - Market size and forecast 2025-2030 ($ million)
Chart on Australia - Year-over-year growth 2025-2030 (%)
Data Table on Australia - Year-over-year growth 2025-2030 (%)

12.3.6 Indonesia - Market size and forecast 2025-2030

Chart on Indonesia - Market size and forecast 2025-2030 ($ million)
Data Table on Indonesia - Market size and forecast 2025-2030 ($ million)
Chart on Indonesia - Year-over-year growth 2025-2030 (%)
Data Table on Indonesia - Year-over-year growth 2025-2030 (%)

12.4 Europe - Market size and forecast 2025-2030

Chart on Europe - Market size and forecast 2025-2030 ($ million)
Data Table on Europe - Market size and forecast 2025-2030 ($ million)
Chart on Europe - Year-over-year growth 2025-2030 (%)
Data Table on Europe - Year-over-year growth 2025-2030 (%)
Chart on Regional Comparison - Europe
Data Table on Regional Comparison - Europe

12.4.1 Germany - Market size and forecast 2025-2030

Chart on Germany - Market size and forecast 2025-2030 ($ million)
Data Table on Germany - Market size and forecast 2025-2030 ($ million)
Chart on Germany - Year-over-year growth 2025-2030 (%)
Data Table on Germany - Year-over-year growth 2025-2030 (%)

12.4.2 UK - Market size and forecast 2025-2030

Chart on UK - Market size and forecast 2025-2030 ($ million)
Data Table on UK - Market size and forecast 2025-2030 ($ million)
Chart on UK - Year-over-year growth 2025-2030 (%)
Data Table on UK - Year-over-year growth 2025-2030 (%)

12.4.3 France - Market size and forecast 2025-2030

Chart on France - Market size and forecast 2025-2030 ($ million)
Data Table on France - Market size and forecast 2025-2030 ($ million)
Chart on France - Year-over-year growth 2025-2030 (%)
Data Table on France - Year-over-year growth 2025-2030 (%)

12.4.4 Italy - Market size and forecast 2025-2030

Chart on Italy - Market size and forecast 2025-2030 ($ million)
Data Table on Italy - Market size and forecast 2025-2030 ($ million)
Chart on Italy - Year-over-year growth 2025-2030 (%)
Data Table on Italy - Year-over-year growth 2025-2030 (%)

12.4.5 The Netherlands - Market size and forecast 2025-2030

Chart on The Netherlands - Market size and forecast 2025-2030 ($ million)
Data Table on The Netherlands - Market size and forecast 2025-2030 ($ million)
Chart on The Netherlands - Year-over-year growth 2025-2030 (%)
Data Table on The Netherlands - Year-over-year growth 2025-2030 (%)

12.4.6 Spain - Market size and forecast 2025-2030

Chart on Spain - Market size and forecast 2025-2030 ($ million)
Data Table on Spain - Market size and forecast 2025-2030 ($ million)
Chart on Spain - Year-over-year growth 2025-2030 (%)
Data Table on Spain - Year-over-year growth 2025-2030 (%)

12.5 North America - Market size and forecast 2025-2030

Chart on North America - Market size and forecast 2025-2030 ($ million)
Data Table on North America - Market size and forecast 2025-2030 ($ million)
Chart on North America - Year-over-year growth 2025-2030 (%)
Data Table on North America - Year-over-year growth 2025-2030 (%)
Chart on Regional Comparison - North America
Data Table on Regional Comparison - North America

12.5.1 US - Market size and forecast 2025-2030

Chart on US - Market size and forecast 2025-2030 ($ million)
Data Table on US - Market size and forecast 2025-2030 ($ million)
Chart on US - Year-over-year growth 2025-2030 (%)
Data Table on US - Year-over-year growth 2025-2030 (%)

12.5.2 Canada - Market size and forecast 2025-2030

Chart on Canada - Market size and forecast 2025-2030 ($ million)
Data Table on Canada - Market size and forecast 2025-2030 ($ million)
Chart on Canada - Year-over-year growth 2025-2030 (%)
Data Table on Canada - Year-over-year growth 2025-2030 (%)

12.5.3 Mexico - Market size and forecast 2025-2030

Chart on Mexico - Market size and forecast 2025-2030 ($ million)
Data Table on Mexico - Market size and forecast 2025-2030 ($ million)
Chart on Mexico - Year-over-year growth 2025-2030 (%)
Data Table on Mexico - Year-over-year growth 2025-2030 (%)

12.6 Middle East and Africa - Market size and forecast 2025-2030

Chart on Middle East and Africa - Market size and forecast 2025-2030 ($ million)
Data Table on Middle East and Africa - Market size and forecast 2025-2030 ($ million)
Chart on Middle East and Africa - Year-over-year growth 2025-2030 (%)
Data Table on Middle East and Africa - Year-over-year growth 2025-2030 (%)
Chart on Regional Comparison - Middle East and Africa
Data Table on Regional Comparison - Middle East and Africa

12.6.1 Saudi Arabia - Market size and forecast 2025-2030

Chart on Saudi Arabia - Market size and forecast 2025-2030 ($ million)
Data Table on Saudi Arabia - Market size and forecast 2025-2030 ($ million)
Chart on Saudi Arabia - Year-over-year growth 2025-2030 (%)
Data Table on Saudi Arabia - Year-over-year growth 2025-2030 (%)

12.6.2 UAE - Market size and forecast 2025-2030

Chart on UAE - Market size and forecast 2025-2030 ($ million)
Data Table on UAE - Market size and forecast 2025-2030 ($ million)
Chart on UAE - Year-over-year growth 2025-2030 (%)
Data Table on UAE - Year-over-year growth 2025-2030 (%)

12.6.3 South Africa - Market size and forecast 2025-2030

Chart on South Africa - Market size and forecast 2025-2030 ($ million)
Data Table on South Africa - Market size and forecast 2025-2030 ($ million)
Chart on South Africa - Year-over-year growth 2025-2030 (%)
Data Table on South Africa - Year-over-year growth 2025-2030 (%)

12.6.4 Israel - Market size and forecast 2025-2030

Chart on Israel - Market size and forecast 2025-2030 ($ million)
Data Table on Israel - Market size and forecast 2025-2030 ($ million)
Chart on Israel - Year-over-year growth 2025-2030 (%)
Data Table on Israel - Year-over-year growth 2025-2030 (%)

12.6.5 Turkey - Market size and forecast 2025-2030

Chart on Turkey - Market size and forecast 2025-2030 ($ million)
Data Table on Turkey - Market size and forecast 2025-2030 ($ million)
Chart on Turkey - Year-over-year growth 2025-2030 (%)
Data Table on Turkey - Year-over-year growth 2025-2030 (%)

12.7 South America - Market size and forecast 2025-2030

Chart on South America - Market size and forecast 2025-2030 ($ million)
Data Table on South America - Market size and forecast 2025-2030 ($ million)
Chart on South America - Year-over-year growth 2025-2030 (%)
Data Table on South America - Year-over-year growth 2025-2030 (%)
Chart on Regional Comparison - South America
Data Table on Regional Comparison - South America

12.7.1 Brazil - Market size and forecast 2025-2030

Chart on Brazil - Market size and forecast 2025-2030 ($ million)
Data Table on Brazil - Market size and forecast 2025-2030 ($ million)
Chart on Brazil - Year-over-year growth 2025-2030 (%)
Data Table on Brazil - Year-over-year growth 2025-2030 (%)

12.7.2 Argentina - Market size and forecast 2025-2030

Chart on Argentina - Market size and forecast 2025-2030 ($ million)
Data Table on Argentina - Market size and forecast 2025-2030 ($ million)
Chart on Argentina - Year-over-year growth 2025-2030 (%)
Data Table on Argentina - Year-over-year growth 2025-2030 (%)

12.7.3 Colombia - Market size and forecast 2025-2030

Chart on Colombia - Market size and forecast 2025-2030 ($ million)
Data Table on Colombia - Market size and forecast 2025-2030 ($ million)
Chart on Colombia - Year-over-year growth 2025-2030 (%)
Data Table on Colombia - Year-over-year growth 2025-2030 (%)

12.8 Market opportunity by geography

Market opportunity by geography ($ million)
Data Tables on Market opportunity by geography ($ million)

13. Drivers, Challenges, and Opportunity

13.1 Market drivers

Localization of critical mineral supply chains to mitigate geopolitical risks
Stringent frameworks and hazardous waste classification
Industrial commercialization and participation of major chemical conglomerates

13.2 Market challenges

Heterogeneity of feedstock and technical standardization hurdles
Economic volatility and decoupling of commodity prices
Complex regulatory compliance and hazardous transport restrictions

13.3 Impact of drivers and challenges

Impact of drivers and challenges in 2025 and 2030

13.4 Market opportunities

Acceleration of strategic vertical integration and closed-loop ecosystems
Technological shift from pyrometallurgy to advanced hydrometallurgy
Standardization of hub-and-spoke logistical model

14. Competitive Landscape

14.1 Overview

14.2

Overview on criticality of inputs and factors of differentiation

14.3 Landscape disruption

Overview on factors of disruption

14.4 Industry risks

Impact of key risks on business

15. Competitive Analysis

15.1 Companies profiled

Companies covered

15.2 Company ranking index

15.3 Market positioning of companies

Matrix on companies position and classification

15.4 Akkuser Oy

Akkuser Oy - Overview
Akkuser Oy - Product / Service
Akkuser Oy - Key offerings
SWOT

15.5 American Battery Technology Co.

American Battery Technology Co. - Overview
American Battery Technology Co. - Product / Service
American Battery Technology Co. - Key offerings
SWOT

15.6 Aqua Metals Inc.

Aqua Metals Inc. - Overview
Aqua Metals Inc. - Product / Service
Aqua Metals Inc. - Key offerings
SWOT

15.7 BASF SE

BASF SE - Overview
BASF SE - Business segments
BASF SE - Key news
BASF SE - Key offerings
BASF SE - Segment focus
SWOT

15.8 Duesenfeld GmbH

Duesenfeld GmbH - Overview
Duesenfeld GmbH - Product / Service
Duesenfeld GmbH - Key offerings
SWOT

15.9 Ecobat LLC

Ecobat LLC - Overview
Ecobat LLC - Product / Service
Ecobat LLC - Key news
Ecobat LLC - Key offerings
SWOT

15.10 Fortum Oyj

Fortum Oyj - Overview
Fortum Oyj - Business segments
Fortum Oyj - Key offerings
Fortum Oyj - Segment focus
SWOT

15.11 GEM Co. Ltd.

GEM Co. Ltd. - Overview
GEM Co. Ltd. - Product / Service
GEM Co. Ltd. - Key news
GEM Co. Ltd. - Key offerings
SWOT

15.12 Glencore Plc

Glencore Plc - Overview
Glencore Plc - Business segments
Glencore Plc - Key news
Glencore Plc - Key offerings
Glencore Plc - Segment focus
SWOT

15.13 Li Cycle Holdings Corp.

Li Cycle Holdings Corp. - Overview
Li Cycle Holdings Corp. - Product / Service
Li Cycle Holdings Corp. - Key news
Li Cycle Holdings Corp. - Key offerings
SWOT

15.14 Neometals Ltd.

Neometals Ltd. - Overview
Neometals Ltd. - Product / Service
Neometals Ltd. - Key offerings
SWOT

15.15 RecycLiCo Battery Materials

RecycLiCo Battery Materials - Overview
RecycLiCo Battery Materials - Product / Service
RecycLiCo Battery Materials - Key offerings
SWOT

15.16 Redwood Materials Inc.

Redwood Materials Inc. - Overview
Redwood Materials Inc. - Product / Service
Redwood Materials Inc. - Key offerings
SWOT

15.17 Tenova Spa

Tenova Spa - Overview
Tenova Spa - Product / Service
Tenova Spa - Key offerings
SWOT

15.18 Umicore SA

Umicore SA - Overview
Umicore SA - Business segments
Umicore SA - Key news
Umicore SA - Key offerings
Umicore SA - Segment focus
SWOT

16. Appendix

16.1 Scope of the report

Market definition
Objectives
Notes and caveats

16.2 Inclusions and exclusions checklist

Inclusions checklist
Exclusions checklist

16.3 Currency conversion rates for US$

16.4 Research methodology

16.5 Data procurement

Information sources

16.6 Data validation

16.7 Validation techniques employed for market sizing

16.8 Data synthesis

16.9 360 degree market analysis

16.10 List of abbreviations

Research Methodology

Technavio presents a detailed picture of the market by way of study, synthesis, and summation of data from multiple sources. The analysts have presented the various facets of the market with a particular focus on identifying the key industry influencers. The data thus presented is comprehensive, reliable, and the result of extensive research, both primary and secondary.

INFORMATION SOURCES

Primary sources

  • Manufacturers and suppliers
  • Channel partners
  • Industry experts
  • Strategic decision makers

Secondary sources

  • Industry journals and periodicals
  • Government data
  • Financial reports of key industry players
  • Historical data
  • Press releases

DATA ANALYSIS

Data Synthesis

  • Collation of data
  • Estimation of key figures
  • Analysis of derived insights

Data Validation

  • Triangulation with data models
  • Reference against proprietary databases
  • Corroboration with industry experts

REPORT WRITING

Qualitative

  • Market drivers
  • Market challenges
  • Market trends
  • Five forces analysis

Quantitative

  • Market size and forecast
  • Market segmentation
  • Geographical insights
  • Competitive landscape

Interested in this report?

Get your sample now to see our research methodology and insights!

Download Now

Frequently Asked Questions

Black Mass Recycling market growth will increase by USD 22075.7 million during 2026-2030 .

The Black Mass Recycling market is expected to grow at a CAGR of 18.5% during 2026-2030 .

Black Mass Recycling market is segmented by Technology (Hydrometallurgy, Pyrometallurgy, Others) Material type (Nickel, Cobalt, Lithium, Copper, Others) Source (Automotive, Consumer electronics, Industrial and power, Others)

Akkuser Oy, American Battery Technology Co., Aqua Metals Inc., BASF SE, Duesenfeld GmbH, Ecobat LLC, Fortum Oyj, GEM Co. Ltd., Glencore Plc, Li Cycle Holdings Corp., Neometals Ltd., Primobius GmbH, RecycLiCo Battery Materials, Redwood Materials Inc., SungEel Hi Tech Co. Ltd., Tenova Spa, Umicore SA are a few of the key vendors in the Black Mass Recycling market.

APAC will register the highest growth rate of 50.7% among the other regions. Therefore, the Black Mass Recycling market in APAC is expected to garner significant business opportunities for the vendors during the forecast period.

China, Japan, India, South Korea, Australia, Indonesia, Germany, UK, France, Italy, The Netherlands, Spain, US, Canada, Mexico, Saudi Arabia, UAE, South Africa, Israel, Turkey, Brazil, Argentina, Colombia

  • Localization of critical mineral supply chains to mitigate geopolitical risks is the driving factor this market.

The Black Mass Recycling market vendors should focus on grabbing business opportunities from the Technology segment as it accounted for the largest market share in the base year.