
Blood Bank Refrigerators Market Size 2026-2030
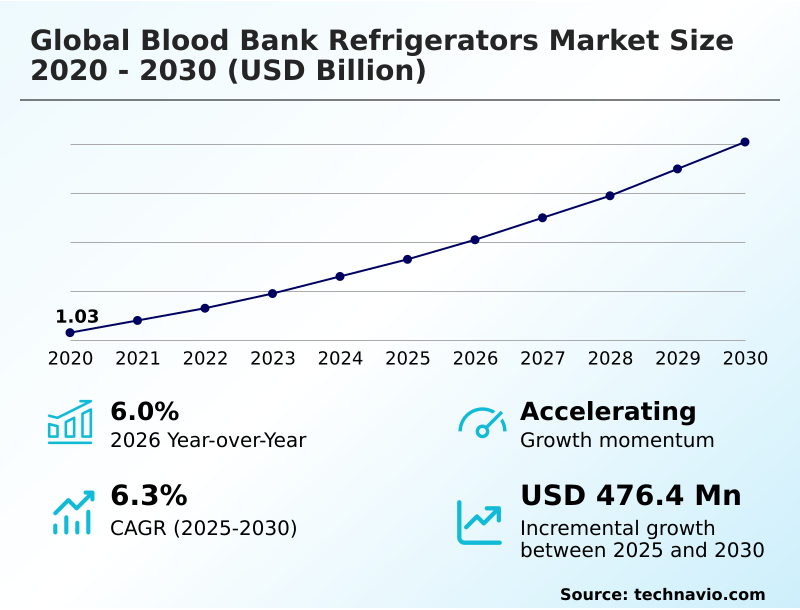
The blood bank refrigerators market size is valued to increase by USD 476.4 million, at a CAGR of 6.3% from 2025 to 2030. Rise in number of road accidents and sports injuries will drive the blood bank refrigerators market.
Major Market Trends & Insights
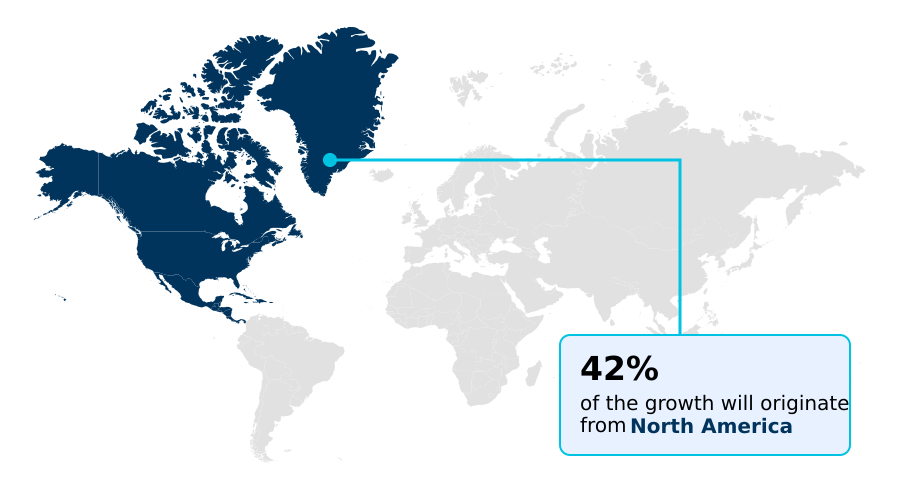
- North America dominated the market and accounted for a 42.4% growth during the forecast period.
- By Product - Standard electric refrigerators segment was valued at USD 731.9 million in 2024
- By End-user - Hospitals and diagnostic centers segment accounted for the largest market revenue share in 2024
Market Size & Forecast
- Market Opportunities: USD 780 million
- Market Future Opportunities: USD 476.4 million
- CAGR from 2025 to 2030 : 6.3%
Market Summary
- The blood bank refrigerators market is defined by the critical need for precise, reliable, and compliant cold storage solutions. This demand is amplified by a growing number of surgical procedures and an expanding healthcare infrastructure focused on blood safety.
- A key market dynamic is the rapid integration of advanced technologies, such as IoT capabilities and cloud-based monitoring, which provide enhanced temperature uniformity and automated data logging for stringent AABB compliance.
- For instance, a large hospital network might implement smart refrigeration units to achieve real-time inventory management, which not inly streamlines laboratory workflow optimization but also provides an auditable chain of custody logging. This shift toward intelligent systems helps mitigate risks associated with temperature excursions.
- However, the high cost of these energy-efficient units and complex validation processes for GMP compliant refrigeration systems present considerable adoption hurdles, particularly in resource-constrained settings. The industry's trajectory is shaped by a balance between technological innovation in areas like cryopreservation technology and the practical need for affordable, robust solutions for whole blood preservation.
What will be the Size of the Blood Bank Refrigerators Market during the forecast period?
Get Key Insights on Market Forecast (PDF) Get Free Sample
How is the Blood Bank Refrigerators Market Segmented?
The blood bank refrigerators industry research report provides comprehensive data (region-wise segment analysis), with forecasts and estimates in "USD million" for the period 2026-2030, as well as historical data from 2020-2024 for the following segments.
- Product
- Standard electric refrigerators
- Solar-powered refrigerators
- Ice-lined refrigerators
- End-user
- Hospitals and diagnostic centers
- Stand-alone blood bank centers
- Others
- Type
- Non-connected
- Wi-Fi enabled
- Bluetooth enabled
- GSM and GPRS enabled
- Geography
- North America
- US
- Canada
- Mexico
- Europe
- Germany
- UK
- France
- Asia
- Rest of World (ROW)
- North America
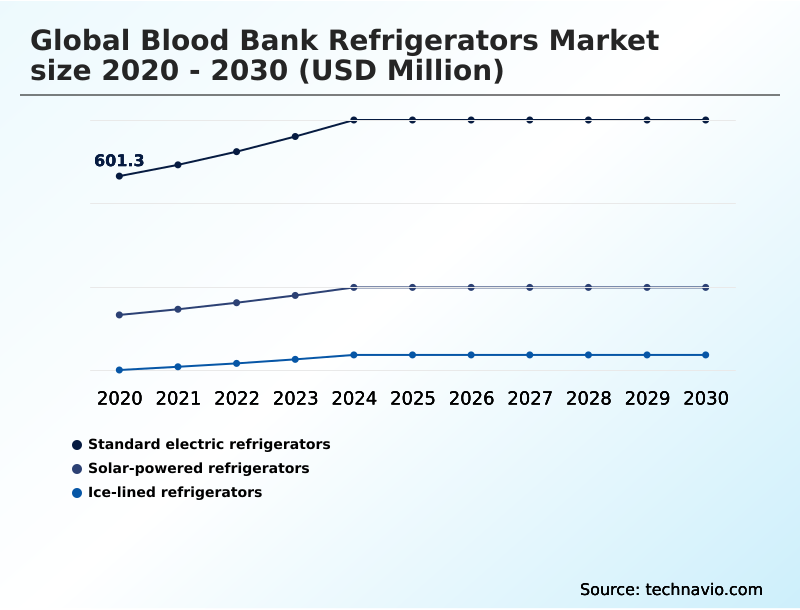
By Product Insights
The standard electric refrigerators segment is estimated to witness significant growth during the forecast period.
The standard electric refrigerators segment remains foundational to the market, driven by its established reliability in maintaining precise temperature control for blood component storage. These units are critical for transfusion medicine equipment in hospitals and blood processing centers.
Innovations focus on enhancing temperature uniformity and integrating features for AABB compliance, with some models improving temperature stability by up to 15%.
The demand for these systems is sustained by upgrades in existing healthcare infrastructure and the need for dependable whole blood preservation. Advanced insulation and specialized compressors are becoming standard, ensuring consistent performance.
As facilities prioritize regulatory-compliant refrigerators and biologics integrity management, this segment evolves by adopting technologies that ensure blood product viability and support laboratory workflow optimization.
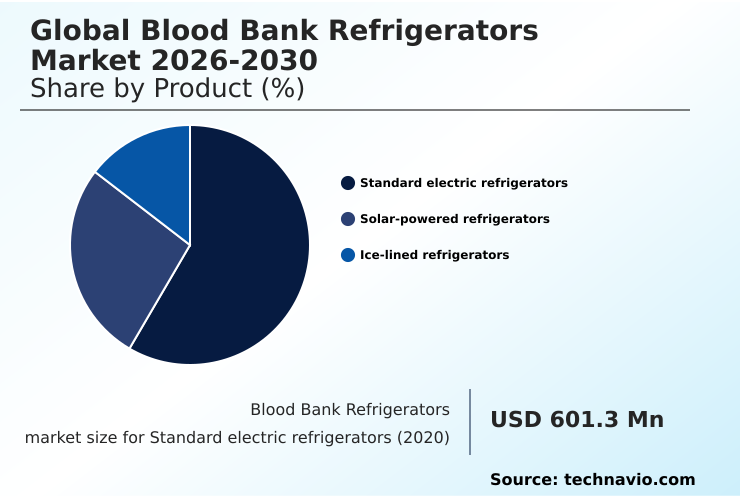
The Standard electric refrigerators segment was valued at USD 731.9 million in 2024 and showed a gradual increase during the forecast period.
Regional Analysis
North America is estimated to contribute 42.4% to the growth of the global market during the forecast period.Technavio’s analysts have elaborately explained the regional trends and drivers that shape the market during the forecast period.
See How Blood Bank Refrigerators Market Demand is Rising in North America Get Free Sample
The geographic landscape of the market is characterized by varied regional dynamics, with North America leading incremental growth, accounting for over 42% of the market's expansion. This is driven by stringent regulatory standards and high investment in advanced healthcare infrastructure.
In Europe, the focus is on upgrading to energy-efficient units with natural refrigerants. The market in Asia is expanding due to rising healthcare expenditure and the development of new blood processing centers.
In all regions, the adoption of digital monitoring is a key trend; facilities using this technology report a 20% improvement in compliance documentation efficiency. This shift supports better management of temperature-sensitive biologics and enhances laboratory cold storage practices.
Aseptic blood storage and reagent storage solutions remain a priority globally.
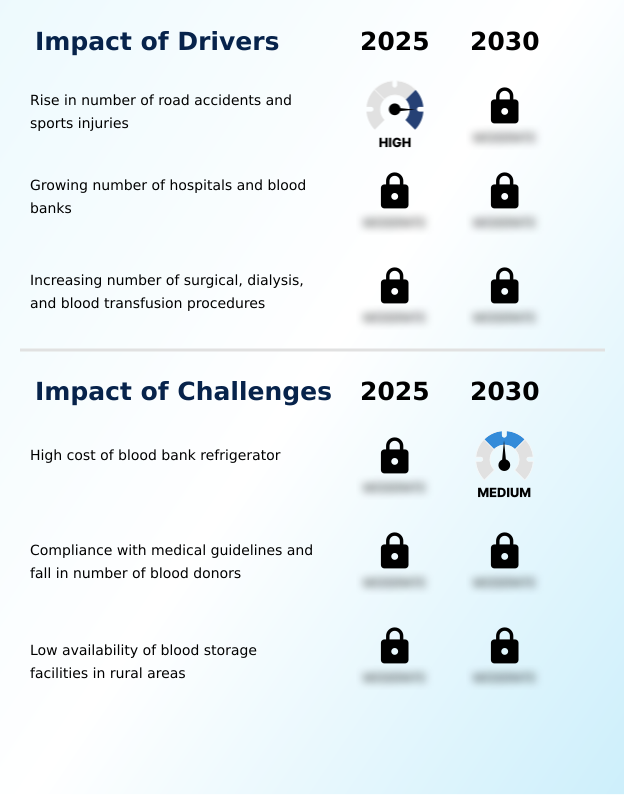
Market Dynamics
Our researchers analyzed the data with 2025 as the base year, along with the key drivers, trends, and challenges. A holistic analysis of drivers will help companies refine their marketing strategies to gain a competitive advantage.
- Navigating the complexities of the global blood bank refrigerators market 2026-2030 requires a focus on specific operational and compliance metrics. Implementing a robust blood bank refrigerator validation protocol is no longer optional; it is fundamental for ensuring blood component viability during storage and achieving compliance for blood bank refrigerators.
- A critical aspect of this is blood bank refrigerator temperature mapping, which verifies that all areas within a unit maintain the required temperature range, thereby preventing temperature excursions in blood banks. Advanced systems now incorporate sophisticated blood bank refrigerator alarm systems and provide comprehensive data logging for blood bank refrigerators, simplifying audits.
- The trend toward smart blood bank inventory management is gaining traction, with IoT enabled blood bank refrigerators offering remote temperature monitoring for blood banks. This technology is particularly vital for blood storage units for remote clinics and mobile donation units, where maintaining the cold chain for blood products is challenging.
- As organizations assess the total cost of blood bank refrigerators, the value of an energy efficient blood bank refrigerator becomes clear, especially for reducing blood product wastage rates. Furthermore, specific requirements, such as blood plasma freezer temperature requirements, are driving demand for specialized units.
- Adherence to AABB guidelines for blood storage and validating blood bank refrigerator performance are the ultimate benchmarks for success. Facilities with validated systems show significantly fewer temperature deviations than those without, directly impacting patient safety.
What are the key market drivers leading to the rise in the adoption of Blood Bank Refrigerators Industry?
- A key market driver is the rising incidence of road accidents and sports injuries, which increases the demand for blood transfusions and associated surgical procedures.
- Market growth is fundamentally driven by the expanding needs of the global healthcare system. A rising volume of surgical procedures, which increases demand for blood products by over 5% annually in major regions, necessitates greater storage capacity.
- Concurrently, the growth of biopharmaceutical research fuels demand for specialized biopharmaceutical cold storage and research lab refrigerators. Modernizing healthcare facilities to include platelet agitators and advanced plasma freezers helps reduce blood product wastage rates by nearly 10%.
- This investment in clinical refrigeration and transfusion medicine equipment is critical for supporting diagnostic laboratory equipment and ensuring the availability of life-saving treatments. The market for sterile storage environments is expanding as a result of這些驅動因素。
What are the market trends shaping the Blood Bank Refrigerators Industry?
- The market is observing a prominent trend toward the integration of value-added software and hardware. These systems provide enhanced data monitoring and operational efficiency for blood storage.
- Key market trends are centered on technological integration to enhance efficiency and compliance. The adoption of smart systems featuring real-time inventory management and wireless monitoring is a significant development, with facilities reporting up to a 30% reduction in manual tracking errors.
- There is also a strong push towards sustainability with energy-efficient units utilizing hydrocarbon refrigerants, which can lower operational electricity costs by over 20%. The presence of high-precision temperature control, enhanced by cascade cooling systems and advanced insulation, ensures superior performance.
- For clinical trial sample storage and cord blood banking, the need for validated storage with detailed temperature mapping is driving demand for more sophisticated laboratory refrigerators, optimizing the entire medical cold chain solutions.
What challenges does the Blood Bank Refrigerators Industry face during its growth?
- The high acquisition and maintenance costs associated with advanced blood bank refrigerators pose a significant challenge to market adoption, especially for smaller healthcare facilities.
- The primary market challenge is the significant financial investment required, as the total cost of ownership for GMP compliant refrigeration can be up to three times the initial purchase price over its lifecycle. This high cost acts as a barrier, especially for smaller pathology lab equipment budgets.
- Furthermore, achieving and maintaining regulatory compliance is a complex hurdle; non-compliance fines can be 150% higher than the cost of upgrading to compliant equipment. The technical demands of cryopreservation technology and hypothermic storage introduce additional complexity and expense.
- Even for standard equipment like platelet incubators and plasma storage units, the need for consistent performance and low failure rates places immense pressure on manufacturers and end-users, affecting both purchasing decisions and operational budgets within cellular therapy logistics.
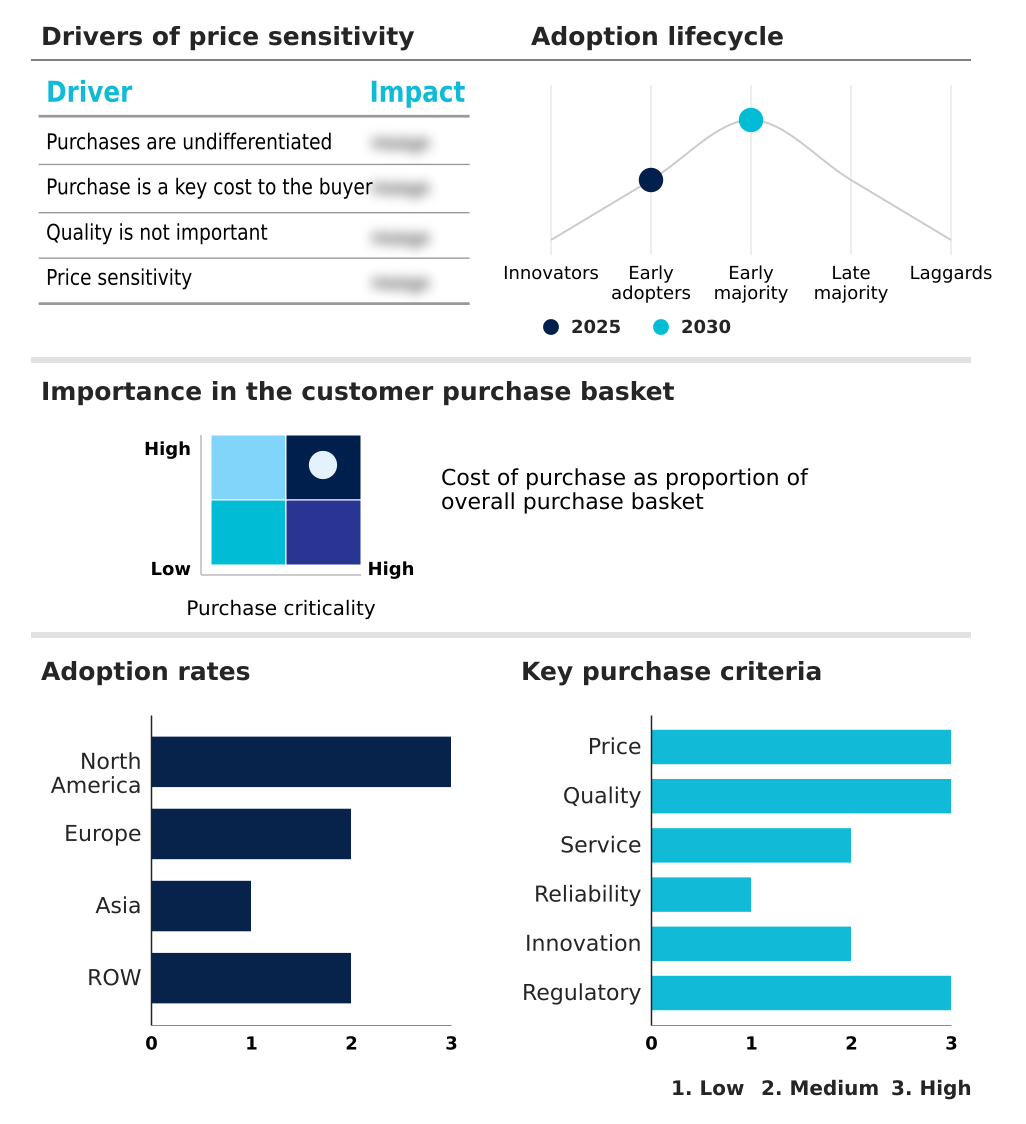
Exclusive Technavio Analysis on Customer Landscape
The blood bank refrigerators market forecasting report includes the adoption lifecycle of the market, covering from the innovator’s stage to the laggard’s stage. It focuses on adoption rates in different regions based on penetration. Furthermore, the blood bank refrigerators market report also includes key purchase criteria and drivers of price sensitivity to help companies evaluate and develop their market growth analysis strategies.
Customer Landscape of Blood Bank Refrigerators Industry
Competitive Landscape
Companies are implementing various strategies, such as strategic alliances, blood bank refrigerators market forecast, partnerships, mergers and acquisitions, geographical expansion, and product/service launches, to enhance their presence in the industry.
ARCTIKO AS - Offerings center on specialized refrigeration for blood components, emphasizing precise temperature control, regulatory compliance, and integrated data management to ensure product integrity in clinical settings.
The industry research and growth report includes detailed analyses of the competitive landscape of the market and information about key companies, including:
- ARCTIKO AS
- Azenta US Inc.
- B Medical Systems Sarl
- Calibre Scientific Inc.
- Cardinal Health Inc.
- Eppendorf SE
- Follett LLC
- Haier
- Helmer Scientific Inc.
- Labcold Ltd.
- LabRepCo LLC
- Migali Industries Inc.
- PHC Holdings Corp.
- Philipp Kirsch GmbH
- So Low Equipment Co. Inc.
- Stericox India Pvt. Ltd.
- The Middleby Corp.
- Thermo Fisher Scientific Inc.
- Trane Technologies Plc
Qualitative and quantitative analysis of companies has been conducted to help clients understand the wider business environment as well as the strengths and weaknesses of key industry players. Data is qualitatively analyzed to categorize companies as pure play, category-focused, industry-focused, and diversified; it is quantitatively analyzed to categorize companies as dominant, leading, strong, tentative, and weak.
Recent Development and News in Blood bank refrigerators market
- In September, 2024, B Medical Systems Sarl announced the launch of its new 'Precision-T' line of blood bank refrigerators, which feature advanced predictive maintenance algorithms and enhanced cloud-based monitoring to ensure full AABB compliance.
- In November, 2024, Helmer Scientific Inc. formed a strategic partnership with a leading healthcare IT firm to seamlessly integrate its i.Series refrigerators into hospital information systems, enabling automated, real-time inventory management.
- In February, 2025, Thermo Fisher Scientific Inc. received expanded FDA clearance for its TSX Series refrigerators, now approved for the storage of next-generation cell and gene therapy products, broadening their application in biopharmaceutical cold storage.
- In May, 2025, Trane Technologies Plc reported it secured a major contract with a national hospital network to replace existing cold storage units with new, energy-efficient models that utilize sustainable hydrocarbon refrigerants.
Dive into Technavio’s robust research methodology, blending expert interviews, extensive data synthesis, and validated models for unparalleled Blood Bank Refrigerators Market insights. See full methodology.
| Market Scope | |
|---|---|
| Page number | 287 |
| Base year | 2025 |
| Historic period | 2020-2024 |
| Forecast period | 2026-2030 |
| Growth momentum & CAGR | Accelerate at a CAGR of 6.3% |
| Market growth 2026-2030 | USD 476.4 million |
| Market structure | Fragmented |
| YoY growth 2025-2026(%) | 6.0% |
| Key countries | US, Canada, Mexico, Germany, UK, France, Italy, Spain, The Netherlands, China, Japan, India, South Korea, Indonesia, Thailand, Brazil, South Africa, Saudi Arabia, UAE, Turkey, Argentina, Israel and Colombia |
| Competitive landscape | Leading Companies, Market Positioning of Companies, Competitive Strategies, and Industry Risks |
Research Analyst Overview
- The blood bank refrigerators market is evolving beyond simple cold storage into an ecosystem of integrated, intelligent systems designed for absolute reliability. The core function remains ensuring temperature stability for sensitive biologics, but the emphasis has shifted to proactive management through advanced technology.
- A key development is the integration of predictive maintenance algorithms, which leverage data from specialized compressors and cascade cooling systems. This allows facilities to anticipate and prevent equipment failure, with some achieving a 40% reduction in unexpected downtime. This capability is paramount for maintaining AABB compliance and ensuring the integrity of cell and gene therapy storage.
- The adoption of biomedical freezers with forced-air circulation and superior thermal insulation is standard, while features like remote access, wireless monitoring, and automated data logging are becoming differentiators. Decisions around investing in GMP compliant refrigeration with validated storage and comprehensive chain of custody logging are now boardroom-level discussions, directly tied to risk management and operational continuity.
What are the Key Data Covered in this Blood Bank Refrigerators Market Research and Growth Report?
-
What is the expected growth of the Blood Bank Refrigerators Market between 2026 and 2030?
-
USD 476.4 million, at a CAGR of 6.3%
-
-
What segmentation does the market report cover?
-
The report is segmented by Product (Standard electric refrigerators, Solar-powered refrigerators, and Ice-lined refrigerators), End-user (Hospitals and diagnostic centers, Stand-alone blood bank centers, and Others), Type (Non-connected, Wi-Fi enabled, Bluetooth enabled, and GSM and GPRS enabled) and Geography (North America, Europe, Asia, Rest of World (ROW))
-
-
Which regions are analyzed in the report?
-
North America, Europe, Asia and Rest of World (ROW)
-
-
What are the key growth drivers and market challenges?
-
Rise in number of road accidents and sports injuries, High cost of blood bank refrigerator
-
-
Who are the major players in the Blood Bank Refrigerators Market?
-
ARCTIKO AS, Azenta US Inc., B Medical Systems Sarl, Calibre Scientific Inc., Cardinal Health Inc., Eppendorf SE, Follett LLC, Haier, Helmer Scientific Inc., Labcold Ltd., LabRepCo LLC, Migali Industries Inc., PHC Holdings Corp., Philipp Kirsch GmbH, So Low Equipment Co. Inc., Stericox India Pvt. Ltd., The Middleby Corp., Thermo Fisher Scientific Inc. and Trane Technologies Plc
-
Market Research Insights
- The market's dynamic landscape is shaped by the push for operational excellence in clinical and research environments. The adoption of certified blood storage solutions integrating medical device integration has resulted in a 25% reduction in manual data entry errors.
- Furthermore, facilities leveraging regulatory-compliant refrigerators for clinical trial sample storage report a 15% improvement in sample retrieval times, directly impacting research timelines. These advancements in transfusion medicine equipment and organ transplantation logistics are becoming central to purchasing decisions. Demand is steady for specialized plasma storage units and platelet incubators that ensure blood product viability.
- Investment in robust healthcare infrastructure and modern blood processing centers continues, highlighting the role of these units as critical healthcare assets.
We can help! Our analysts can customize this blood bank refrigerators market research report to meet your requirements.
 RIA -
RIA - 
