
Blood Collection Tubes Market Size 2025-2029
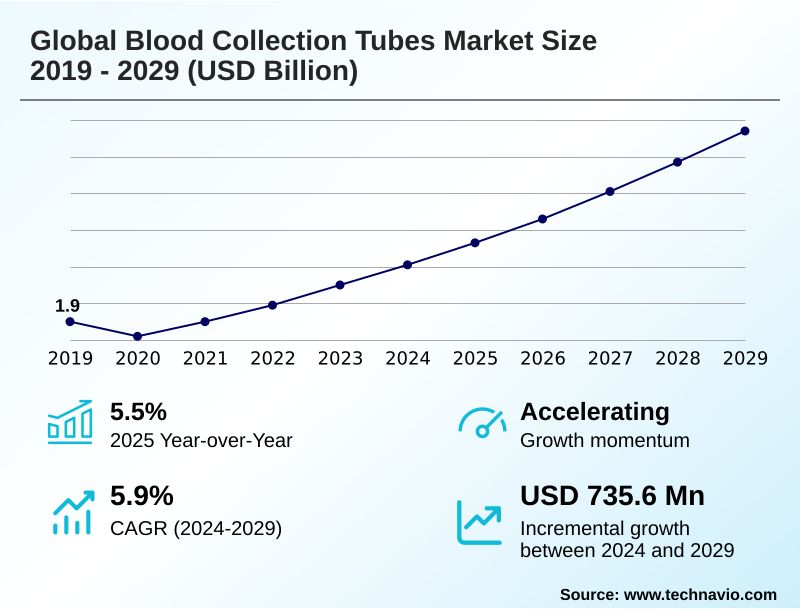
The blood collection tubes market size is valued to increase by USD 735.6 million, at a CAGR of 5.9% from 2024 to 2029. Increasing prevalence of chronic conditions will drive the blood collection tubes market.
Major Market Trends & Insights
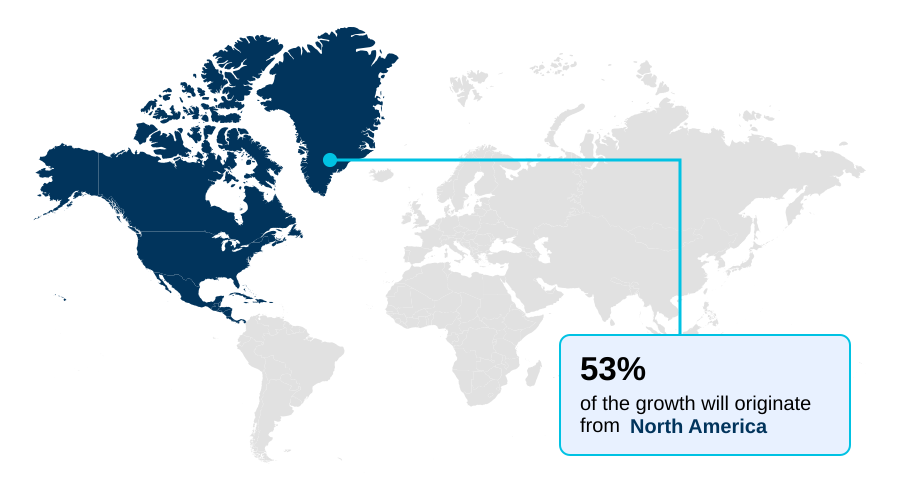
- North America dominated the market and accounted for a 53.3% growth during the forecast period.
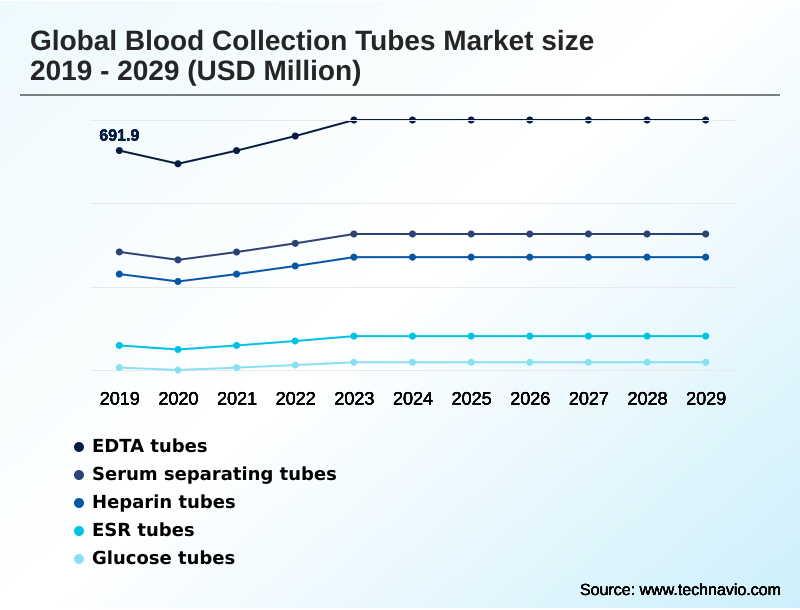
- By Product - EDTA tubes segment was valued at USD 766.7 million in 2023
- By End-user - Healthcare centers segment accounted for the largest market revenue share in 2023
Market Size & Forecast
- Market Opportunities: USD 1.04 billion
- Market Future Opportunities: USD 735.6 million
- CAGR from 2024 to 2029 : 5.9%
Market Summary
- The Blood Collection Tubes Market is fundamentally shaped by the increasing demand for reliable and standardized diagnostic testing. A key driver is the rising incidence of chronic diseases, which necessitates frequent monitoring and accurate analysis of blood samples.
- This has spurred a significant trend toward the adoption of vacuum blood collection tubes, which enhance safety by minimizing contamination risks and accidental exposures. These systems use various additives, such as those found in EDTA tubes and serum separating tubes, for effective analyte preservation and sample stability.
- Innovations in material science have led to a preference for plastic tubes over glass tubes due to improved durability and compatibility with automated laboratory systems. For instance, a large diagnostic center can optimize its pre-analytical laboratory processes by integrating safety-engineered devices with robotic handlers, reducing manual errors in sample collection methods and improving turnaround times.
- However, the market's expansion is constrained by a lack of trained professionals, especially in emerging regions, which can compromise the quality of hematological testing and other in-vitro diagnostics, impacting the reliability of results from procedures like blood cell count and platelet count.
What will be the Size of the Blood Collection Tubes Market during the forecast period?
Get Key Insights on Market Forecast (PDF) Get Free Sample
How is the Blood Collection Tubes Market Segmented?
The blood collection tubes industry research report provides comprehensive data (region-wise segment analysis), with forecasts and estimates in "USD million" for the period 2025-2029, as well as historical data from 2019-2023 for the following segments.
- Product
- EDTA tubes
- Serum separating tubes
- Heparin tubes
- ESR tubes
- Glucose tubes
- End-user
- Healthcare centers
- Diagnostic centers
- Material type
- Plastic
- Glass
- Geography
- North America
- US
- Canada
- Mexico
- Europe
- UK
- Germany
- France
- Asia
- Rest of World (ROW)
- North America
By Product Insights
The edta tubes segment is estimated to witness significant growth during the forecast period.
EDTA tubes are pivotal in the market, driven by high demand for hematological testing, including precise blood cell count and platelet count assessments. The anticoagulant property of EDTA is critical as it prevents blood coagulation, preserving samples for accurate analysis.
These tubes are indispensable for clinical research, especially in oncology and infectious disease studies where reliable sample handling is paramount. As laboratories expand globally, the need for standardized specimen collection systems grows, reinforcing this segment's importance.
Effective quality control protocols ensure diagnostic precision, while optimized supply chain management helps reduce turnaround times by up to 15%, meeting the efficiency demands of modern healthcare providers and supporting overall market expansion.
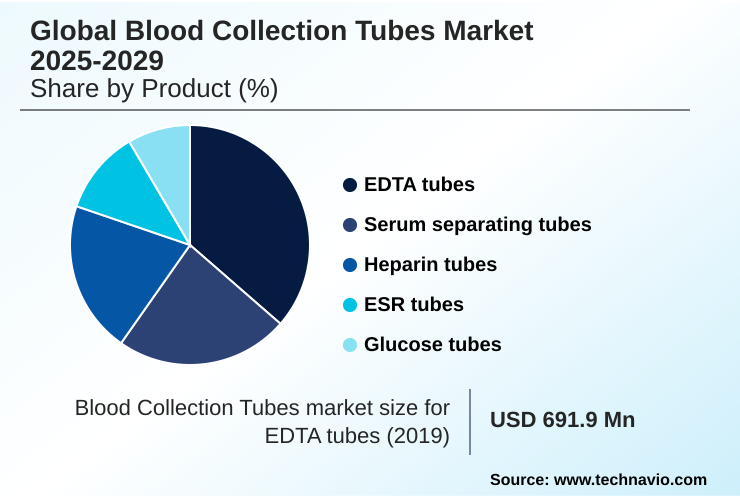
The EDTA tubes segment was valued at USD 766.7 million in 2023 and showed a gradual increase during the forecast period.
Regional Analysis
North America is estimated to contribute 53.3% to the growth of the global market during the forecast period.Technavio’s analysts have elaborately explained the regional trends and drivers that shape the market during the forecast period.
See How Blood Collection Tubes Market Demand is Rising in North America Get Free Sample
The geographic landscape is dominated by North America, attributed to its advanced healthcare infrastructure and high volume of diagnostic procedures.
The region's emphasis on regulatory compliance has accelerated the adoption of advanced plastic tubes, which offer superior safety over traditional glass tubes in pre-analytical laboratory processes.
Europe is a mature market focusing on efficiency gains through robotic phlebotomy and improved specimen transport logistics, which can reduce turnaround times by up to 25%.
The Asia region presents high growth potential, driven by expanding healthcare access and rising investments. Demand for specialized tubes for applications like liquid biopsies and efficient plasma separation and serum separation is growing.
In these emerging markets, proper patient sample identification systems are crucial for managing large-scale phlebotomy services. A shift towards eco-friendly materials is also a developing global theme, influencing manufacturing strategies across all regions.
Market Dynamics
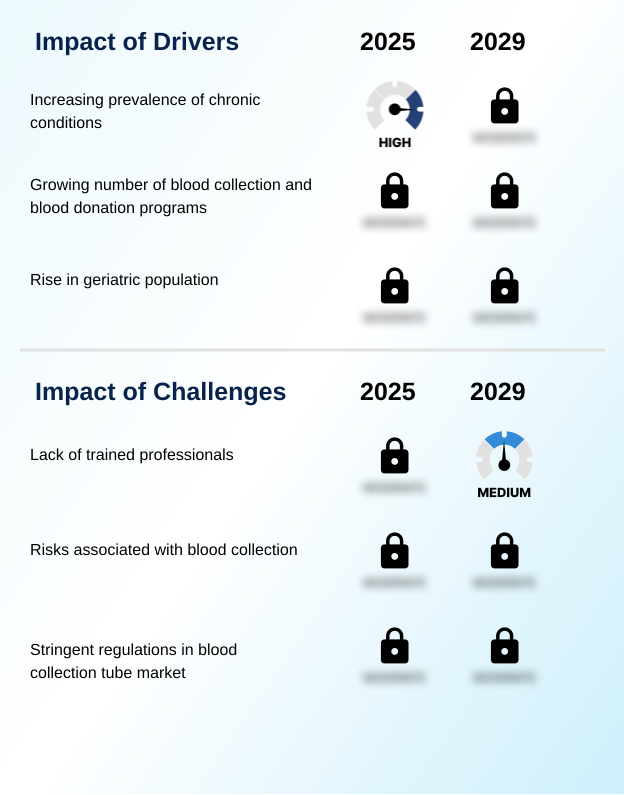
Our researchers analyzed the data with 2024 as the base year, along with the key drivers, trends, and challenges. A holistic analysis of drivers will help companies refine their marketing strategies to gain a competitive advantage.
- Strategic decision-making in the diagnostics sector increasingly revolves around advancements in vacuum blood collection technology and understanding the critical role of additives in blood sample preservation. The debate over plastic versus glass tubes for diagnostics continues, though safety and automation compatibility often favor plastic.
- For specialized applications, the focus is on blood collection tubes for molecular diagnostics and specialized tubes for liquid biopsy analysis, which require exceptional sample integrity. A key operational challenge involves preventing hemolysis during blood collection, a factor directly tied to the impact of pre-analytical variables on testing. Best practices for maintaining specimen integrity are therefore paramount.
- The integration of technology is evident in trends like integrating collection tubes with automated analyzers and developing robust at-home blood collection kit reliability. From a procedural standpoint, improving safety in phlebotomy procedures remains a priority, supported by color-coded systems for tube identification. As healthcare decentralizes, blood collection systems for point-of-care testing are becoming more prevalent.
- However, challenges in pediatric blood sample collection demand specialized product designs. The entire ecosystem is governed by strict regulatory standards for class II medical devices. For instance, facilities that adopt advanced transport and storage of whole blood samples protocols report a 20% lower rate of sample rejection compared to those with basic systems, directly impacting operational efficiency.
- Key products like EDTA tubes for advanced hematology applications and serum separating tubes in clinical chemistry are evolving to meet these demands, while industry-wide efforts aim at reducing contamination risk in blood sampling and adopting sustainable materials for blood collection tubes.
What are the key market drivers leading to the rise in the adoption of Blood Collection Tubes Industry?
- The rising global prevalence of chronic diseases is a primary driver fueling the demand for diagnostic testing and, consequently, blood collection tubes.
- A primary driver is the rising global prevalence of chronic conditions, escalating the demand for routine diagnostic testing. This includes a high volume of hematological testing and advanced molecular diagnostics, which are essential for chronic disease monitoring.
- The reliability of these tests hinges on maintaining specimen integrity and sample stability throughout the pre-analytical phase. As a result, there is a strong focus on products that guarantee analyte preservation and diagnostic precision.
- Growth in biomarker research and large-scale epidemiological studies further amplifies this need. Effective patient sample identification systems are critical, as their implementation can reduce sample mix-ups by over 95%.
- This focus on quality and accuracy in clinical research is propelling innovation across the market.
What are the market trends shaping the Blood Collection Tubes Industry?
- The increasing adoption of vacuum blood collection tubes is a significant market trend, driven by their advantages in safety and operational efficiency over conventional methods.
- A defining trend is the rapid adoption of vacuum blood collection tubes, driven by superior biosafety and efficiency. The integration of safety engineered devices has become standard, reducing occupational hazards and improving workflow management.
- This trend extends to decentralized diagnostics, with a growing market for at-home laboratory testing kits and point of care testing systems that rely on user-friendly sample collection methods. Innovations in additive formulations are enhancing the reliability of in-vitro diagnostics.
- The preference for shatter-resistant plastic in disposable medical devices, often featuring color-coded caps for quick identification, supports both safety and laboratory automation. Facilities adopting these advanced systems report up to a 20% improvement in sample processing efficiency compared to manual methods.
What challenges does the Blood Collection Tubes Industry face during its growth?
- A significant challenge impacting market growth is the shortage of skilled professionals trained to handle advanced diagnostic equipment and perform blood collection procedures accurately.
- A significant challenge is the complexity of ensuring error-free blood sample collection and sample handling. Issues such as improper technique can lead to sample rejection, with some facilities reporting rates as high as 5% due to hemolysis. Proper hemolysis prevention and management of blood coagulation are critical.
- Inconsistencies in pre-analytical laboratory processes across different phlebotomy services pose risks to data quality. Furthermore, stringent regulatory compliance for specimen collection systems adds complexity to manufacturing and supply chain management, while the risk of needlestick injuries remains a persistent concern. Adhering to strict quality control protocols during steps like centrifugation is essential but can be difficult to standardize.
- The push for eco-friendly materials also creates design and cost challenges for manufacturers.
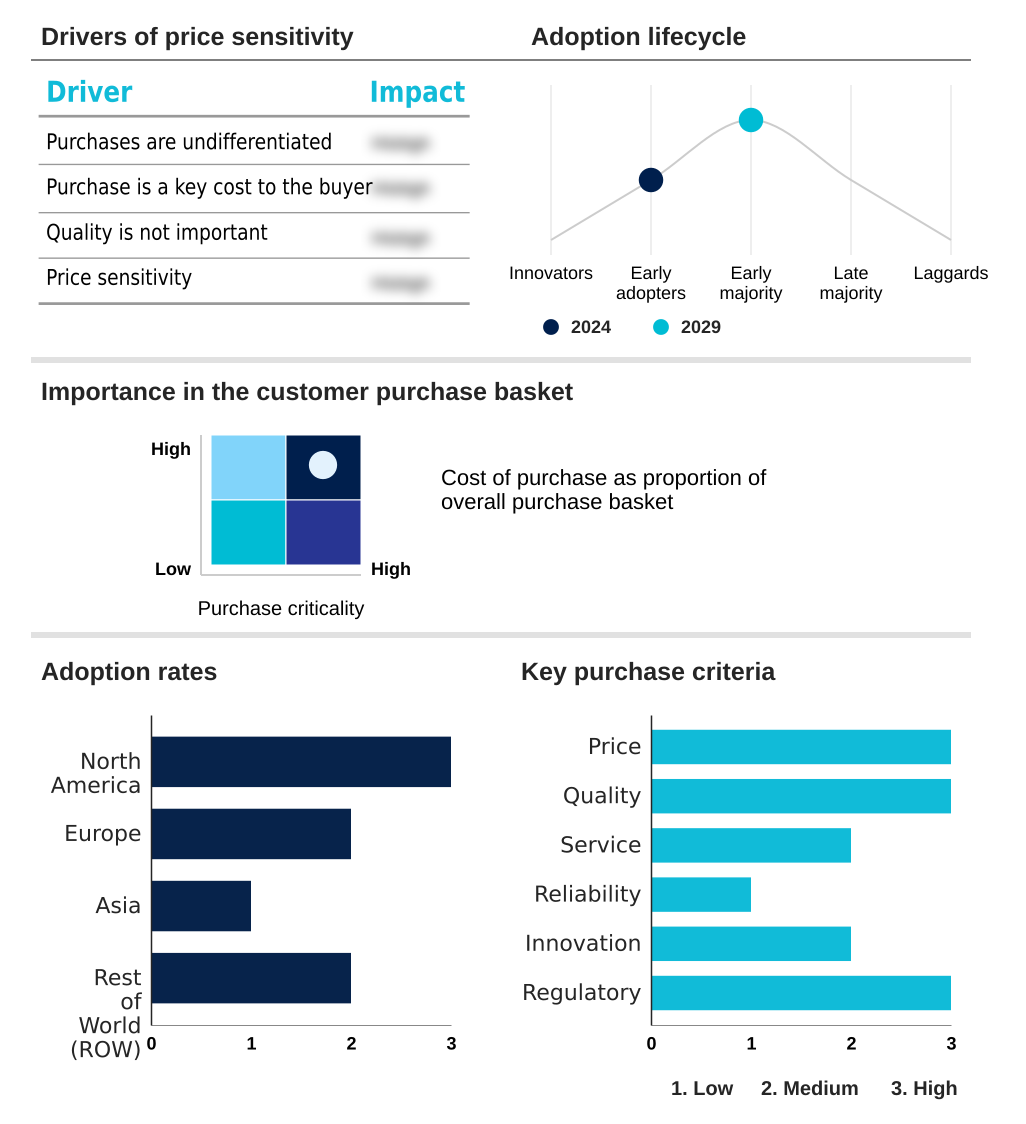
Exclusive Technavio Analysis on Customer Landscape
The blood collection tubes market forecasting report includes the adoption lifecycle of the market, covering from the innovator’s stage to the laggard’s stage. It focuses on adoption rates in different regions based on penetration. Furthermore, the blood collection tubes market report also includes key purchase criteria and drivers of price sensitivity to help companies evaluate and develop their market growth analysis strategies.
Customer Landscape of Blood Collection Tubes Industry
Competitive Landscape
Companies are implementing various strategies, such as strategic alliances, blood collection tubes market forecast, partnerships, mergers and acquisitions, geographical expansion, and product/service launches, to enhance their presence in the industry.
AdvaCare Pharma - The portfolio includes a broad range of diagnostic devices and medical consumables, focused on delivering affordable and high-quality healthcare solutions.
The industry research and growth report includes detailed analyses of the competitive landscape of the market and information about key companies, including:
- AdvaCare Pharma
- Becton Dickinson and Co.
- Biosigma SpA
- Bio X
- Cardinal Health Inc.
- CML Biotech Pvt. Ltd.
- F. Hoffmann La Roche Ltd.
- FL MEDICAL srl Unipersonale
- Greiner AG
- Hebei Xinle Sci and Tech Co. Ltd.
- Hindustan Med Devices Ltd.
- Labtech Disposables
- Medtronic Plc
- Narang Medical Ltd.
- QIAGEN N.V.
- SARSTEDT AG and Co. KG
Qualitative and quantitative analysis of companies has been conducted to help clients understand the wider business environment as well as the strengths and weaknesses of key industry players. Data is qualitatively analyzed to categorize companies as pure play, category-focused, industry-focused, and diversified; it is quantitatively analyzed to categorize companies as dominant, leading, strong, tentative, and weak.
Recent Development and News in Blood collection tubes market
- In August, 2024, Greiner AG announced the launch of a new line of VACUETTE blood collection tubes made from 30% recycled PET, advancing its sustainability initiatives in medical disposables.
- In November, 2024, Becton Dickinson and Co. completed the acquisition of a robotics startup, integrating advanced AI-powered sorting capabilities into its pre-analytical workflow solutions for high-volume laboratories.
- In February, 2025, QIAGEN N.V. received regulatory approval in Europe for its new PAXgene Blood ccfDNA Tube, designed to enhance the stability of circulating cell-free DNA for liquid biopsy applications.
- In May, 2025, SARSTEDT AG & Co. KG entered into a strategic partnership with a leading laboratory information systems provider to create a fully integrated sample tracking solution from collection to analysis.
Dive into Technavio’s robust research methodology, blending expert interviews, extensive data synthesis, and validated models for unparalleled Blood Collection Tubes Market insights. See full methodology.
| Market Scope | |
|---|---|
| Page number | 283 |
| Base year | 2024 |
| Historic period | 2019-2023 |
| Forecast period | 2025-2029 |
| Growth momentum & CAGR | Accelerate at a CAGR of 5.9% |
| Market growth 2025-2029 | USD 735.6 million |
| Market structure | Fragmented |
| YoY growth 2024-2025(%) | 5.5% |
| Key countries | US, Canada, Mexico, UK, Germany, France, Italy, The Netherlands, Spain, China, Japan, India, South Korea, Indonesia, Australia, Brazil, Argentina, Colombia, Saudi Arabia, UAE, South Africa, Israel and Turkey |
| Competitive landscape | Leading Companies, Market Positioning of Companies, Competitive Strategies, and Industry Risks |
Research Analyst Overview
- The blood collection tubes market is driven by the necessity for accurate diagnostic testing across healthcare. The choice between EDTA tubes, serum separating tubes, heparin tubes, and glucose tubes is dictated by specific pre-analytical laboratory processes.
- A major trend is the shift from glass tubes to plastic tubes for better safety and durability, minimizing risks like needlestick injuries from bloodborne pathogens. Vacuum blood collection tubes are now the standard for ensuring specimen integrity and correct blood sample collection.
- These devices are crucial for everything from basic hematological testing, such as blood cell count and platelet count, to advanced molecular diagnostics and liquid biopsies. The market is also adapting to decentralized healthcare models with products for point of care testing and at home laboratory testing.
- For boardroom consideration, integrating safety engineered devices and automated laboratory systems can enhance efficiency; some labs have reported a 40% reduction in pre-analytical phase errors. The anticoagulant property of additives is vital for preventing blood coagulation, ensuring sample stability for plasma separation and serum separation.
- Innovations in additive formulations continue to improve analyte preservation and support the reliability of in-vitro diagnostics and various sample collection methods.
What are the Key Data Covered in this Blood Collection Tubes Market Research and Growth Report?
-
What is the expected growth of the Blood Collection Tubes Market between 2025 and 2029?
-
USD 735.6 million, at a CAGR of 5.9%
-
-
What segmentation does the market report cover?
-
The report is segmented by Product (EDTA tubes, Serum separating tubes, Heparin tubes, ESR tubes, Glucose tubes), End-user (Healthcare centers, Diagnostic centers), Material Type (Plastic, Glass) and Geography (North America, Europe, Asia, Rest of World (ROW))
-
-
Which regions are analyzed in the report?
-
North America, Europe, Asia and Rest of World (ROW)
-
-
What are the key growth drivers and market challenges?
-
Increasing prevalence of chronic conditions, Lack of trained professionals
-
-
Who are the major players in the Blood Collection Tubes Market?
-
AdvaCare Pharma, Becton Dickinson and Co., Biosigma SpA, Bio X, Cardinal Health Inc., CML Biotech Pvt. Ltd., F. Hoffmann La Roche Ltd., FL MEDICAL srl Unipersonale, Greiner AG, Hebei Xinle Sci and Tech Co. Ltd., Hindustan Med Devices Ltd., Labtech Disposables, Medtronic Plc, Narang Medical Ltd., QIAGEN N.V. and SARSTEDT AG and Co. KG
-
Market Research Insights
- The market's dynamics are heavily influenced by the push for greater efficiency and biosafety in clinical settings. The adoption of laboratory automation, for example, has been shown to improve workflow management and reduce sample handling errors by over 30%. This drives demand for tubes with standardized features like barcoding and color-coded caps for enhanced traceability.
- Furthermore, a focus on diagnostic precision necessitates superior volume calibration and vacuum control to ensure sample quality. In high-throughput environments, implementing systems that support rapid centrifugation and specimen transport can decrease overall turnaround times by 15%, a critical metric for both patient care and operational profitability.
- As clinical research expands, the need for reliable specimen collection systems that support complex immunoassays and clinical chemistry also shapes product development.
We can help! Our analysts can customize this blood collection tubes market research report to meet your requirements.
 RIA -
RIA - 
