Blueberry Market Analysis, Size, and Forecast 2026-2030: North America (US, Canada, and Mexico), Europe (Germany, UK, and Spain), APAC (China, Japan, and South Korea), South America (Brazil), Middle East and Africa (UAE, South Africa, and Saudi Arabia), and Rest of World (ROW)

Blueberry Market Analysis, Size, and Forecast 2026-2030:
North America (US, Canada, and Mexico), Europe (Germany, UK, and Spain), APAC (China, Japan, and South Korea), South America (Brazil), Middle East and Africa (UAE, South Africa, and Saudi Arabia), and Rest of World (ROW)

Published: Mar 2026 279 Pages SKU: IRTNTR74756

Market Overview at a Glance

$3.15 B
Market Opportunity
6.9%
CAGR 2025 - 2030
30.6%
Europe Growth
$5.42 B
Food and beverages segment 2024

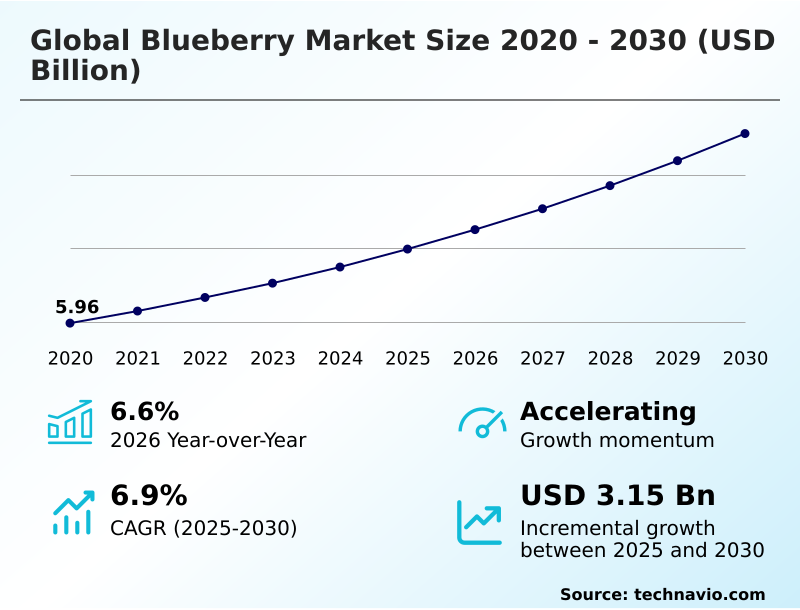
Blueberry Market Size 2026-2030

The blueberry market size is valued to increase by USD 3.15 billion, at a CAGR of 6.9% from 2025 to 2030. Rising health awareness and demand for antioxidant rich superfoods will drive the blueberry market.

Major Market Trends & Insights

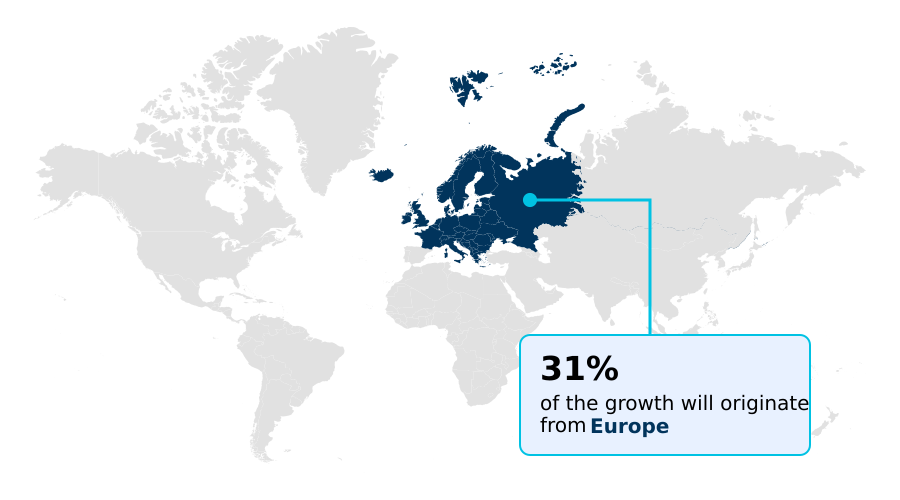
  • Europe dominated the market and accounted for a 30.6% growth during the forecast period.
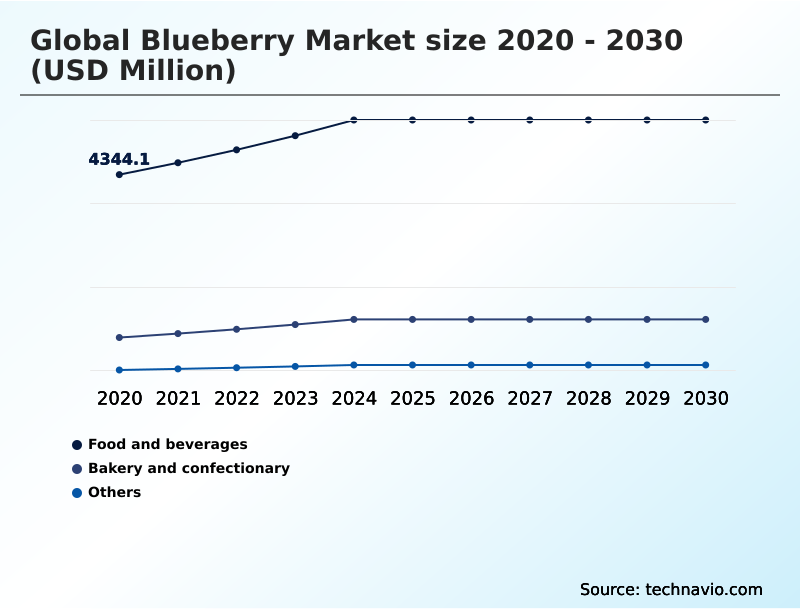
  • By Application - Food and beverages segment was valued at USD 5.42 billion in 2024
  • By Type - Organic segment accounted for the largest market revenue share in 2024

Market Size & Forecast

  • Market Opportunities: USD 5.17 billion
  • Market Future Opportunities: USD 3.15 billion
  • CAGR from 2025 to 2030 : 6.9%

Market Summary

  • The blueberry market is undergoing a significant evolution, driven by a convergence of consumer health consciousness and agricultural innovation. Demand is shifting from a commodity focus to a preference for premium fruit with specific attributes like enhanced sweetness, size, and texture. This transition is compelling growers to invest in advanced genetics and varietal renewal programs.
  • As a result, the supply chain is adapting to handle these higher-value products, with an emphasis on technologies that preserve freshness from farm to retail. For instance, a distributor may implement a dynamic cold chain management system that uses real-time data to adjust temperature and humidity, reducing spoilage by up to 15% on long-haul shipments.
  • The industry is also expanding its geographic footprint to ensure year-round availability, with new cultivation projects in previously untapped climates. Concurrently, the use of blueberries as a functional ingredient in processed foods and beverages is growing, further diversifying revenue streams.
  • Navigating challenges such as climate volatility and labor costs requires a commitment to technological adoption and sustainable practices, which are becoming standard operating principles for competitive players.

What will be the Size of the Blueberry Market during the forecast period?

Get Key Insights on Market Forecast (PDF) Request Free Sample

How is the Blueberry Market Segmented?

The blueberry industry research report provides comprehensive data (region-wise segment analysis), with forecasts and estimates in "USD million" for the period 2026-2030, as well as historical data from 2020-2024 for the following segments.

  • Application
    • Food and beverages
    • Bakery and confectionary
    • Others
  • Type
    • Organic
    • Conventional
  • Product
    • Fresh
    • Frozen
    • Dried
  • Geography
    • North America
      • US
      • Canada
      • Mexico
    • Europe
      • Germany
      • UK
      • Spain
    • APAC
      • China
      • Japan
      • South Korea
    • South America
      • Brazil
    • Middle East and Africa
      • UAE
      • South Africa
      • Saudi Arabia
    • Rest of World (ROW)

By Application Insights

The food and beverages segment is estimated to witness significant growth during the forecast period.

The food and beverages segment is expanding as the demand for functional nutrition shapes consumer preferences. The use of blueberries as key food and beverage ingredients is rising, driven by the clean label movement.

Manufacturers are incorporating the fruit in various forms, including processed fruit products, valuing its sensory profile and nutritional benefits. Innovations in aseptic processing allow for shelf-stable liquid applications, while freeze-dried blueberry powders are used in health-focused snacks.

Advanced brix level measurement ensures consistent sweetness, and maintaining fruit firmness is critical for quality perception. This focus on premium inputs has led to a 15% increase in the adoption of specialized blueberry formats for gourmet beverage preparations.

Request Free Sample

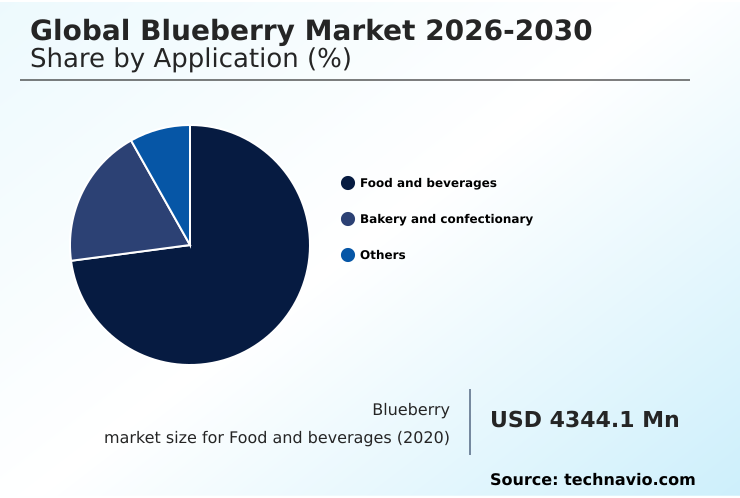
The Food and beverages segment was valued at USD 5.42 billion in 2024 and showed a gradual increase during the forecast period.

Request Free Sample

Regional Analysis

Europe is estimated to contribute 30.6% to the growth of the global market during the forecast period.Technavio’s analysts have elaborately explained the regional trends and drivers that shape the market during the forecast period.

See How Blueberry Market Demand is Rising in Europe Request Free Sample

The market's geographic landscape is diversifying to ensure supply chain optimization and meet global demand. North America remains a primary consumption hub, while South American countries are key suppliers, leveraging counter-seasonal harvests.

Europe represents the largest opportunity, projected to contribute over 30% of the market's incremental growth. Meanwhile, APAC is the fastest-growing region, with a projected growth rate of 8.3%, driven by rising incomes and health awareness.

Effective cold chain logistics are critical for maintaining post-harvest quality and enabling the export of fresh and IQF (Individually Quick Frozen) blueberries from key growing regions.

Innovations in cryogenic freezing technology are also helping producers in emerging markets meet stringent blueberry export standards, expanding their global reach.

Market Dynamics

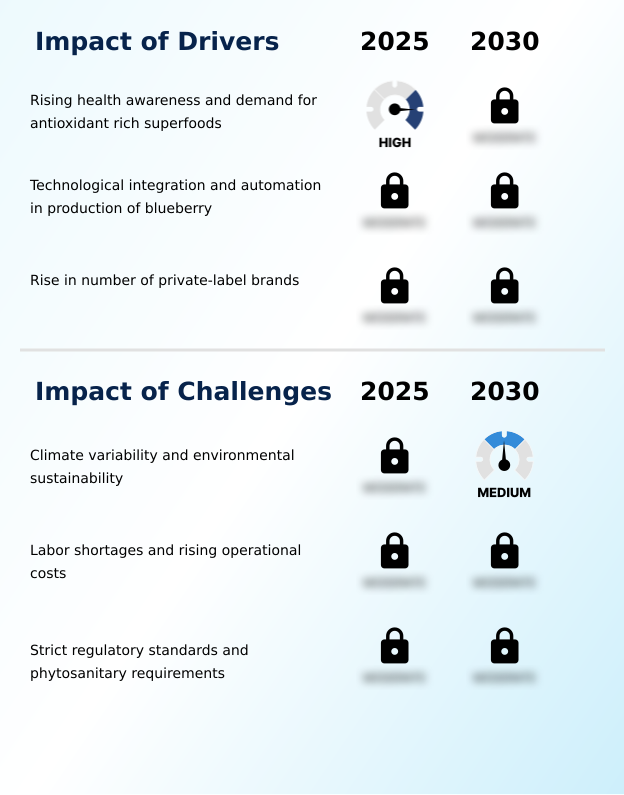
Our researchers analyzed the data with 2025 as the base year, along with the key drivers, trends, and challenges. A holistic analysis of drivers will help companies refine their marketing strategies to gain a competitive advantage.

  • The industry is navigating a complex set of factors that influence production and profitability. A primary concern is the impact of climate change on blueberry yield, which is compelling growers to explore controlled-environment agriculture and climate-resilient cultivars. This directly connects to strategies for year-round blueberry supply, which rely on a global network of farms operating in different seasonal windows.
  • The benefits of proprietary blueberry varieties are central to this strategy, as they offer improved firmness, flavor, and transportability, addressing key challenges in global blueberry logistics. These advanced genetics are crucial for increasing the shelf life of fresh blueberries.
  • Concurrently, the adoption of technologies for mechanical blueberry harvesting is accelerating to counter labor shortages and rising operational costs, with some systems demonstrating a 40% improvement in picking efficiency over manual methods. The consumer preference for large size blueberries continues to shape cultivation priorities.
  • On the processing side, the use of blueberries in functional beverages is a significant growth area, leveraging the role of antioxidants in blueberry health claims. Furthermore, growers are increasingly adopting organic blueberry farming best practices to meet demand from health-conscious consumers and gain access to premium market segments.

What are the key market drivers leading to the rise in the adoption of Blueberry Industry?

  • The market is primarily driven by rising health awareness and strong consumer demand for blueberries, recognized as an antioxidant-rich superfood.

  • Heightened consumer focus on blueberry health benefits and nutritional value is a primary market driver. As a key component of superfood trends, the fruit's high antioxidant content and rich concentration of phytonutrients are heavily marketed.
  • The demand for products with verifiable health claims has pushed the functional food market forward. Scientific validation of bioactive compounds and high polyphenol concentration supports its status as a wellness ingredient.
  • The expansion of organic blueberry production, which now accounts for over 25% of new plantings in some regions, directly addresses consumer demand for chemical-free options.
  • Products fortified with blueberry extracts have demonstrated a 10% higher repeat purchase rate compared to conventional alternatives.

What are the market trends shaping the Blueberry Industry?

  • A key market trend is the 'blue renaissance,' characterized by strategic varietal renewal programs. This industry-wide shift prioritizes fruit quality, consistency, and premium attributes over sheer production volume.

  • The industry is undergoing a transformation driven by a focus on premium fruit attributes and varietal renewal. The development of new blueberry cultivar options is a central strategy, with a clear market preference for jumbo sized berries that command higher retail prices. This shift supports the goal of a year-round blueberry supply.
  • Through genetic advancement, producers are achieving significant shelf life extension, reducing spoilage rates by up to 20%. This innovation is critical for retail fruit marketing and meeting evolving consumer dietary habits. For instance, new varieties offer a 15% improvement in resilience to transit-related damage, ensuring a consistent high-quality product reaches global consumers.

What challenges does the Blueberry Industry face during its growth?

  • A primary challenge affecting industry growth is increasing climate variability, which intensifies the need for more advanced environmental sustainability practices across production.

  • Producers face significant operational hurdles from climate variability and rising operational costs. The adoption of agritech solutions is crucial for developing climate-resilient crops and ensuring stable yields. Investments in controlled environment agriculture and precision agriculture technologies are increasing, with some farms reporting a 30% reduction in water usage.
  • However, the high capital cost of mechanical harvesting equipment remains a barrier, despite its potential to reduce labor cost dependency by over 50%. Furthermore, adhering to stringent food safety regulations and phytosanitary measures adds complexity to global trade. Effective crop protection strategies that align with sustainable farming practices are essential for market access and long-term viability.

Exclusive Technavio Analysis on Customer Landscape

The blueberry market forecasting report includes the adoption lifecycle of the market, covering from the innovator’s stage to the laggard’s stage. It focuses on adoption rates in different regions based on penetration. Furthermore, the blueberry market report also includes key purchase criteria and drivers of price sensitivity to help companies evaluate and develop their market growth analysis strategies.

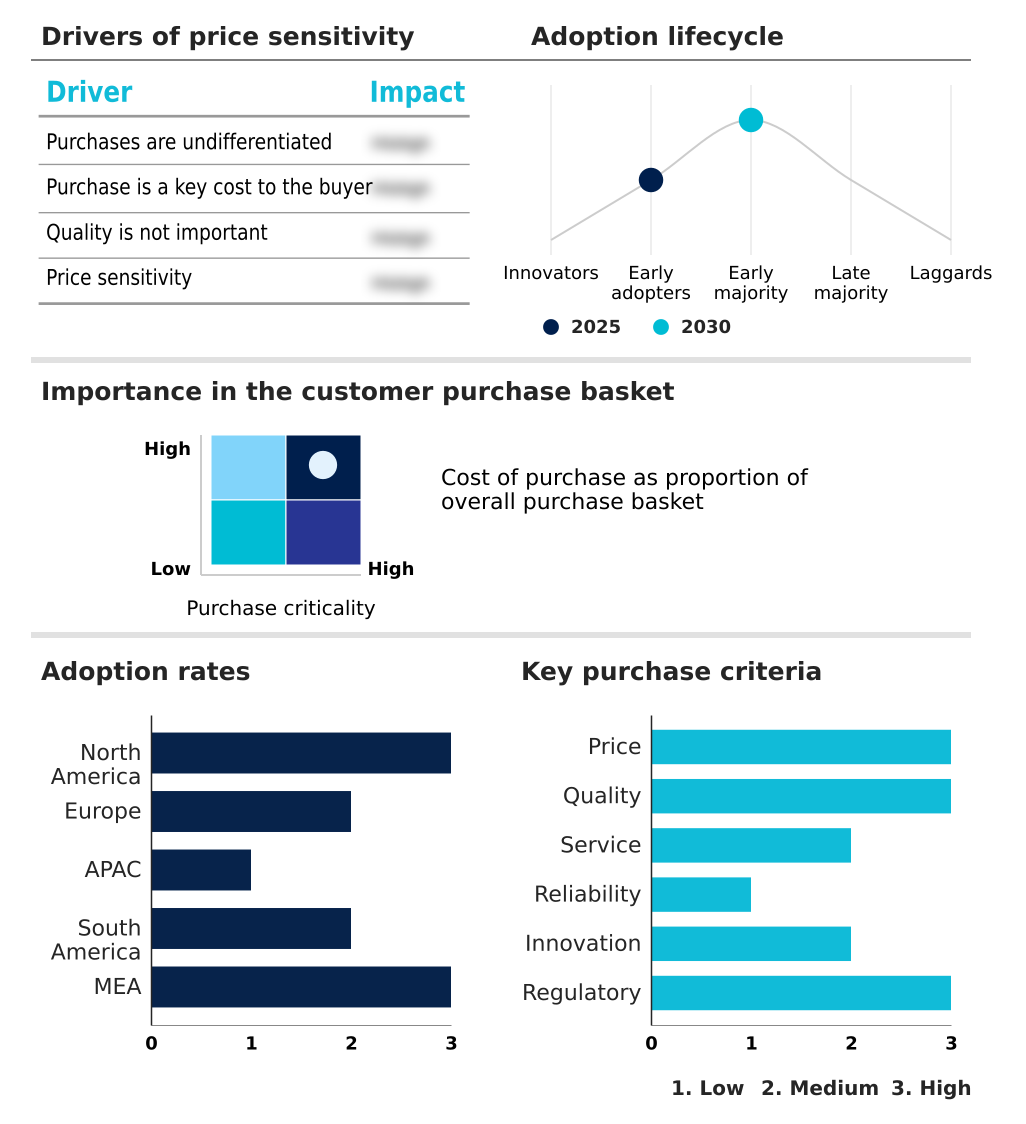
Customer Landscape of Blueberry Industry

Competitive Landscape

Companies are implementing various strategies, such as strategic alliances, blueberry market forecast, partnerships, mergers and acquisitions, geographical expansion, and product/service launches, to enhance their presence in the industry.

AGRANA Beteiligungs AG - Specializing in value-added fruit preparations and blueberry concentrates for industrial food applications, enhancing product formulation and quality.

The industry research and growth report includes detailed analyses of the competitive landscape of the market and information about key companies, including:

  • AGRANA Beteiligungs AG
  • Arctic Flavors
  • Ardo NV
  • BerryWorld Group
  • Betec
  • Dole plc
  • Driscolls Inc.
  • Earthbound Farm
  • Hortifrut SA
  • Jones Family Farms
  • Joy Wing Mau Group
  • JR Simplot Co.
  • Kenburn Orchards
  • MBG Marketing
  • Naturipe Farms LLC
  • Scenic Fruit Co.
  • SunOpta Inc.
  • Van Drunen Farms
  • World Variety Produce Inc.

Qualitative and quantitative analysis of companies has been conducted to help clients understand the wider business environment as well as the strengths and weaknesses of key industry players. Data is qualitatively analyzed to categorize companies as pure play, category-focused, industry-focused, and diversified; it is quantitatively analyzed to categorize companies as dominant, leading, strong, tentative, and weak.

Recent Development and News in Blueberry market

  • In May 2025, Naturipe Farms announced the launch of its exclusive proprietary varieties, including Envoy and Keepsake, tailored for the New Jersey and Michigan growing regions to enhance firmness, size, and flavor.
  • In March 2025, Costa Group launched the first 17-hectare stage of its blueberry farm in Laos, aiming to extend the production season for the Asian market with plans to expand to 200 hectares.
  • In February 2025, Driscoll's announced the launch of its premium Sweetest Batch blueberry range in Germany and the Middle East, introducing high-brix proprietary varieties to meet international demand for superior fresh fruit.
  • In January 2025, Naturipe Farms reported a significant increase in organic blueberry volumes from its South American operations, achieving record yields to ensure a consistent year-round supply for retailers.

Dive into Technavio’s robust research methodology, blending expert interviews, extensive data synthesis, and validated models for unparalleled Blueberry Market insights. See full methodology.

Market Scope
Page number 279
Base year 2025
Historic period 2020-2024
Forecast period 2026-2030
Growth momentum & CAGR Accelerate at a CAGR of 6.9%
Market growth 2026-2030 USD 3152.7 million
Market structure Fragmented
YoY growth 2025-2026(%) 6.6%
Key countries US, Canada, Mexico, Germany, UK, Poland, Spain, France, Italy, China, Japan, South Korea, India, Australia, Indonesia, Peru, Chile, Brazil, UAE, South Africa, Saudi Arabia, Egypt and Morocco
Competitive landscape Leading Companies, Market Positioning of Companies, Competitive Strategies, and Industry Risks

Request Free Sample

Research Analyst Overview

  • The blueberry market is defined by a push for operational excellence through technological and genetic advancement. A central theme is varietal renewal, where producers are replacing older blueberry cultivar options with new ones that offer superior fruit firmness and an enhanced sensory profile. This focus on post-harvest quality is critical for boardroom decisions on brand positioning and pricing strategy.
  • Investment in advanced cold chain logistics is non-negotiable for maintaining the integrity of fresh and IQF (Individually Quick Frozen) blueberries across global supply routes. To improve efficiency, the adoption of mechanical harvesting is increasing, while precision agriculture and controlled environment agriculture offer solutions to climate-related risks.
  • For instance, implementing sustainable farming practices combined with targeted crop protection has been shown to improve marketable yield by over 12%. The industry's evolution is also visible in processing, with growth in freeze-dried blueberry formats and products highlighting high polyphenol concentration, antioxidant content, and other bioactive compounds and phytonutrients, all driven by consumer health trends.

What are the Key Data Covered in this Blueberry Market Research and Growth Report?

  • What is the expected growth of the Blueberry Market between 2026 and 2030?

    • USD 3.15 billion, at a CAGR of 6.9%

  • What segmentation does the market report cover?

    • The report is segmented by Application (Food and beverages, Bakery and confectionary, and Others), Type (Organic, and Conventional), Product (Fresh, Frozen, and Dried) and Geography (North America, Europe, APAC, South America, Middle East and Africa)

  • Which regions are analyzed in the report?

    • North America, Europe, APAC, South America and Middle East and Africa

  • What are the key growth drivers and market challenges?

    • Rising health awareness and demand for antioxidant rich superfoods, Climate variability and environmental sustainability

  • Who are the major players in the Blueberry Market?

    • AGRANA Beteiligungs AG, Arctic Flavors, Ardo NV, BerryWorld Group, Betec, Dole plc, Driscolls Inc., Earthbound Farm, Hortifrut SA, Jones Family Farms, Joy Wing Mau Group, JR Simplot Co., Kenburn Orchards, MBG Marketing, Naturipe Farms LLC, Scenic Fruit Co., SunOpta Inc., Van Drunen Farms and World Variety Produce Inc.

Market Research Insights

  • Market dynamics are shaped by a strategic push toward supply chain optimization and delivering premium fruit attributes. The goal of a year-round blueberry supply is driving geographic diversification into new blueberry growing regions and investment in agritech solutions.
  • This focus on quality is reflected in retail fruit marketing, where premium branding has led to a 15% price premium compared to standard offerings. Furthermore, alignment with consumer dietary habits, such as the clean label movement, has resulted in a 20% increase in the use of blueberries as natural food and beverage ingredients.
  • Producers are leveraging these trends to differentiate their offerings, navigating complex food safety regulations while aiming for improved operational efficiencies.

We can help! Our analysts can customize this blueberry market research report to meet your requirements.

Get in touch

1. Executive Summary

1.1 Market overview

Executive Summary - Chart on Market Overview
Executive Summary - Data Table on Market Overview
Executive Summary - Chart on Global Market Characteristics
Executive Summary - Chart on Market by Geography
Executive Summary - Chart on Market Segmentation by Application
Executive Summary - Chart on Market Segmentation by Type
Executive Summary - Chart on Market Segmentation by Product
Executive Summary - Chart on Incremental Growth
Executive Summary - Data Table on Incremental Growth
Executive Summary - Chart on Company Market Positioning

2. Technavio Analysis

2.1 Analysis of price sensitivity, lifecycle, customer purchase basket, adoption rates, and purchase criteria

2.2 Criticality of inputs and Factors of differentiation

Chart on Overview on criticality of inputs and factors of differentiation

2.3 Factors of disruption

Chart on Overview on factors of disruption

2.4 Impact of drivers and challenges

Chart on Impact of drivers and challenges in 2025 and 2030

3. Market Landscape

3.1 Market ecosystem

Chart on Parent Market
Data Table on - Parent Market

3.2 Market characteristics

Chart on Market characteristics analysis

3.3 Value chain analysis

Chart on Value chain analysis

4. Market Sizing

4.1 Market definition

Data Table on Offerings of companies included in the market definition

4.2 Market segment analysis

Market segments

4.3 Market size 2025

4.4 Market outlook: Forecast for 2025-2030

Chart on Global - Market size and forecast 2025-2030 ($ million)
Data Table on Global - Market size and forecast 2025-2030 ($ million)
Chart on Global Market: Year-over-year growth 2025-2030 (%)
Data Table on Global Market: Year-over-year growth 2025-2030 (%)

5. Historic Market Size

5.1 Global Blueberry Market 2020 - 2024

Historic Market Size - Data Table on Global Blueberry Market 2020 - 2024 ($ million)

5.2 Application segment analysis 2020 - 2024

Historic Market Size - Application Segment 2020 - 2024 ($ million)

5.3 Type segment analysis 2020 - 2024

Historic Market Size - Type Segment 2020 - 2024 ($ million)

5.4 Product segment analysis 2020 - 2024

Historic Market Size - Product Segment 2020 - 2024 ($ million)

5.5 Geography segment analysis 2020 - 2024

Historic Market Size - Geography Segment 2020 - 2024 ($ million)

5.6 Country segment analysis 2020 - 2024

Historic Market Size - Country Segment 2020 - 2024 ($ million)

6. Qualitative Analysis

6.1 Impact of AI on Global Blueberry Market

7. Five Forces Analysis

7.1 Five forces summary

Five forces analysis - Comparison between 2025 and 2030

7.2 Bargaining power of buyers

Bargaining power of buyers - Impact of key factors 2025 and 2030

7.3 Bargaining power of suppliers

Bargaining power of suppliers - Impact of key factors in 2025 and 2030

7.4 Threat of new entrants

Threat of new entrants - Impact of key factors in 2025 and 2030

7.5 Threat of substitutes

Threat of substitutes - Impact of key factors in 2025 and 2030

7.6 Threat of rivalry

Threat of rivalry - Impact of key factors in 2025 and 2030

7.7 Market condition

Chart on Market condition - Five forces 2025 and 2030

8. Market Segmentation by Application

8.1 Market segments

Chart on Application - Market share 2025-2030 (%)
Data Table on Application - Market share 2025-2030 (%)

8.2 Comparison by Application

Chart on Comparison by Application
Data Table on Comparison by Application

8.3 Food and beverages - Market size and forecast 2025-2030

Chart on Food and beverages - Market size and forecast 2025-2030 ($ million)
Data Table on Food and beverages - Market size and forecast 2025-2030 ($ million)
Chart on Food and beverages - Year-over-year growth 2025-2030 (%)
Data Table on Food and beverages - Year-over-year growth 2025-2030 (%)

8.4 Bakery and confectionary - Market size and forecast 2025-2030

Chart on Bakery and confectionary - Market size and forecast 2025-2030 ($ million)
Data Table on Bakery and confectionary - Market size and forecast 2025-2030 ($ million)
Chart on Bakery and confectionary - Year-over-year growth 2025-2030 (%)
Data Table on Bakery and confectionary - Year-over-year growth 2025-2030 (%)

8.5 Others - Market size and forecast 2025-2030

Chart on Others - Market size and forecast 2025-2030 ($ million)
Data Table on Others - Market size and forecast 2025-2030 ($ million)
Chart on Others - Year-over-year growth 2025-2030 (%)
Data Table on Others - Year-over-year growth 2025-2030 (%)

8.6 Market opportunity by Application

Market opportunity by Application ($ million)
Data Table on Market opportunity by Application ($ million)

9. Market Segmentation by Type

9.1 Market segments

Chart on Type - Market share 2025-2030 (%)
Data Table on Type - Market share 2025-2030 (%)

9.2 Comparison by Type

Chart on Comparison by Type
Data Table on Comparison by Type

9.3 Organic - Market size and forecast 2025-2030

Chart on Organic - Market size and forecast 2025-2030 ($ million)
Data Table on Organic - Market size and forecast 2025-2030 ($ million)
Chart on Organic - Year-over-year growth 2025-2030 (%)
Data Table on Organic - Year-over-year growth 2025-2030 (%)

9.4 Conventional - Market size and forecast 2025-2030

Chart on Conventional - Market size and forecast 2025-2030 ($ million)
Data Table on Conventional - Market size and forecast 2025-2030 ($ million)
Chart on Conventional - Year-over-year growth 2025-2030 (%)
Data Table on Conventional - Year-over-year growth 2025-2030 (%)

9.5 Market opportunity by Type

Market opportunity by Type ($ million)
Data Table on Market opportunity by Type ($ million)

10. Market Segmentation by Product

10.1 Market segments

Chart on Product - Market share 2025-2030 (%)
Data Table on Product - Market share 2025-2030 (%)

10.2 Comparison by Product

Chart on Comparison by Product
Data Table on Comparison by Product

10.3 Fresh - Market size and forecast 2025-2030

Chart on Fresh - Market size and forecast 2025-2030 ($ million)
Data Table on Fresh - Market size and forecast 2025-2030 ($ million)
Chart on Fresh - Year-over-year growth 2025-2030 (%)
Data Table on Fresh - Year-over-year growth 2025-2030 (%)

10.4 Frozen - Market size and forecast 2025-2030

Chart on Frozen - Market size and forecast 2025-2030 ($ million)
Data Table on Frozen - Market size and forecast 2025-2030 ($ million)
Chart on Frozen - Year-over-year growth 2025-2030 (%)
Data Table on Frozen - Year-over-year growth 2025-2030 (%)

10.5 Dried - Market size and forecast 2025-2030

Chart on Dried - Market size and forecast 2025-2030 ($ million)
Data Table on Dried - Market size and forecast 2025-2030 ($ million)
Chart on Dried - Year-over-year growth 2025-2030 (%)
Data Table on Dried - Year-over-year growth 2025-2030 (%)

10.6 Market opportunity by Product

Market opportunity by Product ($ million)
Data Table on Market opportunity by Product ($ million)

11. Customer Landscape

11.1 Customer landscape overview

Analysis of price sensitivity, lifecycle, customer purchase basket, adoption rates, and purchase criteria

12. Geographic Landscape

12.1 Geographic segmentation

Chart on Market share by geography 2025-2030 (%)
Data Table on Market share by geography 2025-2030 (%)

12.2 Geographic comparison

Chart on Geographic comparison
Data Table on Geographic comparison

12.3 North America - Market size and forecast 2025-2030

Chart on North America - Market size and forecast 2025-2030 ($ million)
Data Table on North America - Market size and forecast 2025-2030 ($ million)
Chart on North America - Year-over-year growth 2025-2030 (%)
Data Table on North America - Year-over-year growth 2025-2030 (%)
Chart on Regional Comparison - North America
Data Table on Regional Comparison - North America

12.3.1 US - Market size and forecast 2025-2030

Chart on US - Market size and forecast 2025-2030 ($ million)
Data Table on US - Market size and forecast 2025-2030 ($ million)
Chart on US - Year-over-year growth 2025-2030 (%)
Data Table on US - Year-over-year growth 2025-2030 (%)

12.3.2 Canada - Market size and forecast 2025-2030

Chart on Canada - Market size and forecast 2025-2030 ($ million)
Data Table on Canada - Market size and forecast 2025-2030 ($ million)
Chart on Canada - Year-over-year growth 2025-2030 (%)
Data Table on Canada - Year-over-year growth 2025-2030 (%)

12.3.3 Mexico - Market size and forecast 2025-2030

Chart on Mexico - Market size and forecast 2025-2030 ($ million)
Data Table on Mexico - Market size and forecast 2025-2030 ($ million)
Chart on Mexico - Year-over-year growth 2025-2030 (%)
Data Table on Mexico - Year-over-year growth 2025-2030 (%)

12.4 Europe - Market size and forecast 2025-2030

Chart on Europe - Market size and forecast 2025-2030 ($ million)
Data Table on Europe - Market size and forecast 2025-2030 ($ million)
Chart on Europe - Year-over-year growth 2025-2030 (%)
Data Table on Europe - Year-over-year growth 2025-2030 (%)
Chart on Regional Comparison - Europe
Data Table on Regional Comparison - Europe

12.4.1 Germany - Market size and forecast 2025-2030

Chart on Germany - Market size and forecast 2025-2030 ($ million)
Data Table on Germany - Market size and forecast 2025-2030 ($ million)
Chart on Germany - Year-over-year growth 2025-2030 (%)
Data Table on Germany - Year-over-year growth 2025-2030 (%)

12.4.2 UK - Market size and forecast 2025-2030

Chart on UK - Market size and forecast 2025-2030 ($ million)
Data Table on UK - Market size and forecast 2025-2030 ($ million)
Chart on UK - Year-over-year growth 2025-2030 (%)
Data Table on UK - Year-over-year growth 2025-2030 (%)

12.4.3 Poland - Market size and forecast 2025-2030

Chart on Poland - Market size and forecast 2025-2030 ($ million)
Data Table on Poland - Market size and forecast 2025-2030 ($ million)
Chart on Poland - Year-over-year growth 2025-2030 (%)
Data Table on Poland - Year-over-year growth 2025-2030 (%)

12.4.4 Spain - Market size and forecast 2025-2030

Chart on Spain - Market size and forecast 2025-2030 ($ million)
Data Table on Spain - Market size and forecast 2025-2030 ($ million)
Chart on Spain - Year-over-year growth 2025-2030 (%)
Data Table on Spain - Year-over-year growth 2025-2030 (%)

12.4.5 France - Market size and forecast 2025-2030

Chart on France - Market size and forecast 2025-2030 ($ million)
Data Table on France - Market size and forecast 2025-2030 ($ million)
Chart on France - Year-over-year growth 2025-2030 (%)
Data Table on France - Year-over-year growth 2025-2030 (%)

12.4.6 Italy - Market size and forecast 2025-2030

Chart on Italy - Market size and forecast 2025-2030 ($ million)
Data Table on Italy - Market size and forecast 2025-2030 ($ million)
Chart on Italy - Year-over-year growth 2025-2030 (%)
Data Table on Italy - Year-over-year growth 2025-2030 (%)

12.5 APAC - Market size and forecast 2025-2030

Chart on APAC - Market size and forecast 2025-2030 ($ million)
Data Table on APAC - Market size and forecast 2025-2030 ($ million)
Chart on APAC - Year-over-year growth 2025-2030 (%)
Data Table on APAC - Year-over-year growth 2025-2030 (%)
Chart on Regional Comparison - APAC
Data Table on Regional Comparison - APAC

12.5.1 China - Market size and forecast 2025-2030

Chart on China - Market size and forecast 2025-2030 ($ million)
Data Table on China - Market size and forecast 2025-2030 ($ million)
Chart on China - Year-over-year growth 2025-2030 (%)
Data Table on China - Year-over-year growth 2025-2030 (%)

12.5.2 Japan - Market size and forecast 2025-2030

Chart on Japan - Market size and forecast 2025-2030 ($ million)
Data Table on Japan - Market size and forecast 2025-2030 ($ million)
Chart on Japan - Year-over-year growth 2025-2030 (%)
Data Table on Japan - Year-over-year growth 2025-2030 (%)

12.5.3 South Korea - Market size and forecast 2025-2030

Chart on South Korea - Market size and forecast 2025-2030 ($ million)
Data Table on South Korea - Market size and forecast 2025-2030 ($ million)
Chart on South Korea - Year-over-year growth 2025-2030 (%)
Data Table on South Korea - Year-over-year growth 2025-2030 (%)

12.5.4 India - Market size and forecast 2025-2030

Chart on India - Market size and forecast 2025-2030 ($ million)
Data Table on India - Market size and forecast 2025-2030 ($ million)
Chart on India - Year-over-year growth 2025-2030 (%)
Data Table on India - Year-over-year growth 2025-2030 (%)

12.5.5 Australia - Market size and forecast 2025-2030

Chart on Australia - Market size and forecast 2025-2030 ($ million)
Data Table on Australia - Market size and forecast 2025-2030 ($ million)
Chart on Australia - Year-over-year growth 2025-2030 (%)
Data Table on Australia - Year-over-year growth 2025-2030 (%)

12.5.6 Indonesia - Market size and forecast 2025-2030

Chart on Indonesia - Market size and forecast 2025-2030 ($ million)
Data Table on Indonesia - Market size and forecast 2025-2030 ($ million)
Chart on Indonesia - Year-over-year growth 2025-2030 (%)
Data Table on Indonesia - Year-over-year growth 2025-2030 (%)

12.6 South America - Market size and forecast 2025-2030

Chart on South America - Market size and forecast 2025-2030 ($ million)
Data Table on South America - Market size and forecast 2025-2030 ($ million)
Chart on South America - Year-over-year growth 2025-2030 (%)
Data Table on South America - Year-over-year growth 2025-2030 (%)
Chart on Regional Comparison - South America
Data Table on Regional Comparison - South America

12.6.1 Peru - Market size and forecast 2025-2030

Chart on Peru - Market size and forecast 2025-2030 ($ million)
Data Table on Peru - Market size and forecast 2025-2030 ($ million)
Chart on Peru - Year-over-year growth 2025-2030 (%)
Data Table on Peru - Year-over-year growth 2025-2030 (%)

12.6.2 Chile - Market size and forecast 2025-2030

Chart on Chile - Market size and forecast 2025-2030 ($ million)
Data Table on Chile - Market size and forecast 2025-2030 ($ million)
Chart on Chile - Year-over-year growth 2025-2030 (%)
Data Table on Chile - Year-over-year growth 2025-2030 (%)

12.6.3 Brazil - Market size and forecast 2025-2030

Chart on Brazil - Market size and forecast 2025-2030 ($ million)
Data Table on Brazil - Market size and forecast 2025-2030 ($ million)
Chart on Brazil - Year-over-year growth 2025-2030 (%)
Data Table on Brazil - Year-over-year growth 2025-2030 (%)

12.7 Middle East and Africa - Market size and forecast 2025-2030

Chart on Middle East and Africa - Market size and forecast 2025-2030 ($ million)
Data Table on Middle East and Africa - Market size and forecast 2025-2030 ($ million)
Chart on Middle East and Africa - Year-over-year growth 2025-2030 (%)
Data Table on Middle East and Africa - Year-over-year growth 2025-2030 (%)
Chart on Regional Comparison - Middle East and Africa
Data Table on Regional Comparison - Middle East and Africa

12.7.1 UAE - Market size and forecast 2025-2030

Chart on UAE - Market size and forecast 2025-2030 ($ million)
Data Table on UAE - Market size and forecast 2025-2030 ($ million)
Chart on UAE - Year-over-year growth 2025-2030 (%)
Data Table on UAE - Year-over-year growth 2025-2030 (%)

12.7.2 South Africa - Market size and forecast 2025-2030

Chart on South Africa - Market size and forecast 2025-2030 ($ million)
Data Table on South Africa - Market size and forecast 2025-2030 ($ million)
Chart on South Africa - Year-over-year growth 2025-2030 (%)
Data Table on South Africa - Year-over-year growth 2025-2030 (%)

12.7.3 Saudi Arabia - Market size and forecast 2025-2030

Chart on Saudi Arabia - Market size and forecast 2025-2030 ($ million)
Data Table on Saudi Arabia - Market size and forecast 2025-2030 ($ million)
Chart on Saudi Arabia - Year-over-year growth 2025-2030 (%)
Data Table on Saudi Arabia - Year-over-year growth 2025-2030 (%)

12.7.4 Egypt - Market size and forecast 2025-2030

Chart on Egypt - Market size and forecast 2025-2030 ($ million)
Data Table on Egypt - Market size and forecast 2025-2030 ($ million)
Chart on Egypt - Year-over-year growth 2025-2030 (%)
Data Table on Egypt - Year-over-year growth 2025-2030 (%)

12.7.5 Morocco - Market size and forecast 2025-2030

Chart on Morocco - Market size and forecast 2025-2030 ($ million)
Data Table on Morocco - Market size and forecast 2025-2030 ($ million)
Chart on Morocco - Year-over-year growth 2025-2030 (%)
Data Table on Morocco - Year-over-year growth 2025-2030 (%)

12.8 Market opportunity by geography

Market opportunity by geography ($ million)
Data Tables on Market opportunity by geography ($ million)

13. Drivers, Challenges, and Opportunity

13.1 Market drivers

Rising health awareness and demand for antioxidant rich superfoods
Technological integration and automation in production of blueberry
Rise in number of private-label brands

13.2 Market challenges

Climate variability and environmental sustainability
Labor shortages and rising operational costs
Strict regulatory standards and phytosanitary requirements

13.3 Impact of drivers and challenges

Impact of drivers and challenges in 2025 and 2030

13.4 Market opportunities

Blue renaissance and strategic varietal renewal programs
Increasing demand for organic blueberries
Geographic diversification and year round supply chain stability

14. Competitive Landscape

14.1 Overview

14.2

Overview on criticality of inputs and factors of differentiation

14.3 Landscape disruption

Overview on factors of disruption

14.4 Industry risks

Impact of key risks on business

15. Competitive Analysis

15.1 Companies profiled

Companies covered

15.2 Company ranking index

15.3 Market positioning of companies

Matrix on companies position and classification

15.4 AGRANA Beteiligungs AG

AGRANA Beteiligungs AG - Overview
AGRANA Beteiligungs AG - Business segments
AGRANA Beteiligungs AG - Key news
AGRANA Beteiligungs AG - Key offerings
AGRANA Beteiligungs AG - Segment focus
SWOT

15.5 Arctic Flavors

Arctic Flavors - Overview
Arctic Flavors - Product / Service
Arctic Flavors - Key offerings
SWOT

15.6 Ardo NV

Ardo NV - Overview
Ardo NV - Product / Service
Ardo NV - Key offerings
SWOT

15.7 BerryWorld Group

BerryWorld Group - Overview
BerryWorld Group - Product / Service
BerryWorld Group - Key offerings
SWOT

15.8 Dole plc

Dole plc - Overview
Dole plc - Business segments
Dole plc - Key offerings
Dole plc - Segment focus
SWOT

15.9 Driscolls Inc.

Driscolls Inc. - Overview
Driscolls Inc. - Product / Service
Driscolls Inc. - Key offerings
SWOT

15.10 Earthbound Farm

Earthbound Farm - Overview
Earthbound Farm - Product / Service
Earthbound Farm - Key offerings
SWOT

15.11 Hortifrut SA

Hortifrut SA - Overview
Hortifrut SA - Product / Service
Hortifrut SA - Key offerings
SWOT

15.12 Jones Family Farms

Jones Family Farms - Overview
Jones Family Farms - Product / Service
Jones Family Farms - Key offerings
SWOT

15.13 Joy Wing Mau Group

Joy Wing Mau Group - Overview
Joy Wing Mau Group - Product / Service
Joy Wing Mau Group - Key offerings
SWOT

15.14 JR Simplot Co.

JR Simplot Co. - Overview
JR Simplot Co. - Product / Service
JR Simplot Co. - Key offerings
SWOT

15.15 MBG Marketing

MBG Marketing - Overview
MBG Marketing - Product / Service
MBG Marketing - Key offerings
SWOT

15.16 Scenic Fruit Co.

Scenic Fruit Co. - Overview
Scenic Fruit Co. - Product / Service
Scenic Fruit Co. - Key offerings
SWOT

15.17 SunOpta Inc.

SunOpta Inc. - Overview
SunOpta Inc. - Product / Service
SunOpta Inc. - Key news
SunOpta Inc. - Key offerings
SWOT

15.18 Van Drunen Farms

Van Drunen Farms - Overview
Van Drunen Farms - Product / Service
Van Drunen Farms - Key offerings
SWOT

16. Appendix

16.1 Scope of the report

Market definition
Objectives
Notes and caveats

16.2 Inclusions and exclusions checklist

Inclusions checklist
Exclusions checklist

16.3 Currency conversion rates for US$

16.4 Research methodology

16.5 Data procurement

Information sources

16.6 Data validation

16.7 Validation techniques employed for market sizing

16.8 Data synthesis

16.9 360 degree market analysis

16.10 List of abbreviations

Research Methodology

Technavio presents a detailed picture of the market by way of study, synthesis, and summation of data from multiple sources. The analysts have presented the various facets of the market with a particular focus on identifying the key industry influencers. The data thus presented is comprehensive, reliable, and the result of extensive research, both primary and secondary.

INFORMATION SOURCES

Primary sources

  • Manufacturers and suppliers
  • Channel partners
  • Industry experts
  • Strategic decision makers

Secondary sources

  • Industry journals and periodicals
  • Government data
  • Financial reports of key industry players
  • Historical data
  • Press releases

DATA ANALYSIS

Data Synthesis

  • Collation of data
  • Estimation of key figures
  • Analysis of derived insights

Data Validation

  • Triangulation with data models
  • Reference against proprietary databases
  • Corroboration with industry experts

REPORT WRITING

Qualitative

  • Market drivers
  • Market challenges
  • Market trends
  • Five forces analysis

Quantitative

  • Market size and forecast
  • Market segmentation
  • Geographical insights
  • Competitive landscape

Interested in this report?

Get your sample now to see our research methodology and insights!

Download Now

Frequently Asked Questions

Blueberry market growth will increase by USD 3152.7 million during 2026-2030.

The Blueberry market is expected to grow at a CAGR of 6.9% during 2026-2030.

Blueberry market is segmented by Application (Food and beverages, Bakery and confectionary, Others) Type (Organic, Conventional) Product (Fresh, Frozen, Dried)

AGRANA Beteiligungs AG, Arctic Flavors, Ardo NV, BerryWorld Group, Betec, Dole plc, Driscolls Inc., Earthbound Farm, Hortifrut SA, Jones Family Farms, Joy Wing Mau Group, JR Simplot Co., Kenburn Orchards, MBG Marketing, Naturipe Farms LLC, Scenic Fruit Co., SunOpta Inc., Van Drunen Farms, World Variety Produce Inc. are a few of the key vendors in the Blueberry market.

Europe will register the highest growth rate of 30.6% among the other regions. Therefore, the Blueberry market in Europe is expected to garner significant business opportunities for the vendors during the forecast period.

US, Canada, Mexico, Germany, UK, Poland, Spain, France, Italy, China, Japan, South Korea, India, Australia, Indonesia, Peru, Chile, Brazil, UAE, South Africa, Saudi Arabia, Egypt, Morocco

  • Rising health awareness and demand for antioxidant rich superfoods is the driving factor this market.

The Blueberry market vendors should focus on grabbing business opportunities from the Application segment as it accounted for the largest market share in the base year.
RIA - Research AI Assistant
Ask RIA