Bounce House Market Analysis North America, APAC, Europe, South America, Middle East and Africa - US, Canada, China, Germany, UK - Size and Forecast 2024-2028

Bounce House Market Analysis North America, APAC, Europe, South America, Middle East and Africa - US, Canada, China, Germany, UK - Size and Forecast 2024-2028

Published: Jan 2024 146 Pages SKU: IRTNTR77214

Market Overview at a Glance

$810.16 Mn
Market Opportunity
5.81%
CAGR
4.82
YoY growth 2023-2024(%)

Bounce House Market Size 2024-2028

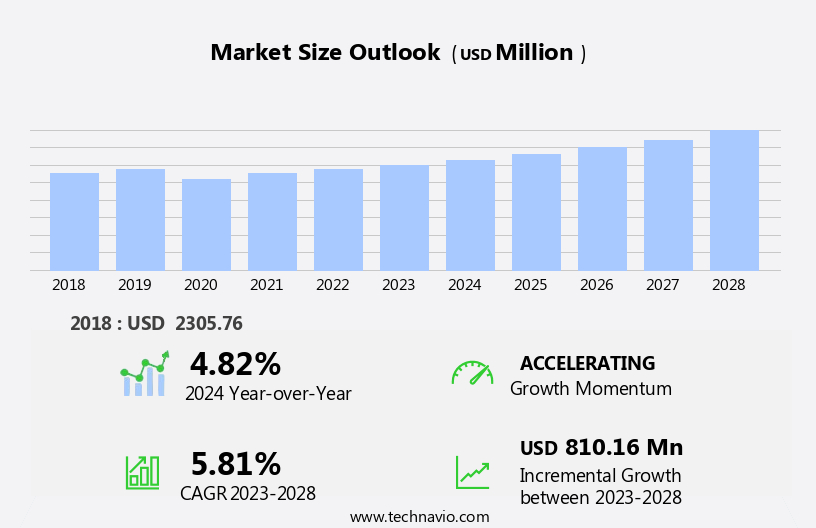
The bounce house market size is forecast to increase by USD 810.16 million at a CAGR of 5.81% between 2023 and 2028.

  • The market is experiencing significant growth, driven by the increasing demand for commercial use of these inflatable structures at events and parties. The market is further fueled by the trend towards themed bounce houses, which offer unique and engaging experiences for children and adults alike. However, the market is not without challenges. The high maintenance requirements associated with bounce houses can pose operational difficulties for businesses, including regular inspections, repairs, and replacement of worn-out components. To capitalize on market opportunities and navigate these challenges effectively, companies must focus on offering reliable and durable bounce houses, as well as providing excellent customer service and support.
  • Additionally, partnerships with event organizers and party rental companies can help expand market reach and increase revenue streams. Overall, the market presents a compelling investment opportunity for businesses seeking to cater to the growing demand for inflatable structures at various events and celebrations.

What will be the Size of the Bounce House Market during the forecast period?

Bounce House Market Size

 Request Free Sample

  • The events industry continues to evolve, with inflatable structures like bounce houses becoming increasingly popular for parties and commercial functions. Nylon and PVC materials are commonly used due to their durability and safety standards. Customization options allow brands to create unique experiences for children and adults alike. Investment in this market is on the rise, driven by the portability and versatility of these structures. Safety regulations play a crucial role in the market, ensuring the structures meet commercial standards. Sales of these inflatables have seen consistent growth due to their ability to provide a fun and engaging experience.
  • Distribution channels have expanded, making it easier for businesses to rent these structures for various events. Brand recognition is another factor fueling the market's growth, as companies seek to differentiate themselves through customized and innovative designs. The focus on safety and durability ensures that these structures remain a popular choice for events, providing a reliable and cost-effective solution for businesses.

How is this Bounce House Industry segmented?

The bounce house industry research report provides comprehensive data (region-wise segment analysis), with forecasts and estimates in "USD million" for the period 2024-2028, as well as historical data from 2018-2022 for the following segments.
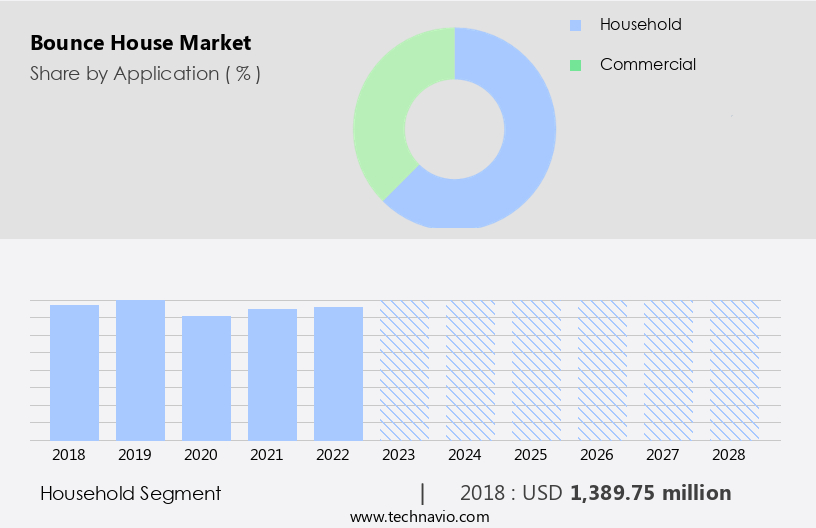
  • Application
    • Household
    • Commercial
  • Type
    • Dry bounce house
    • Dry and wet bounce house
    • Wet bounce house
  • Geography
    • North America
      • US
      • Canada
    • APAC
      • China
    • Europe
      • Germany
      • UK
    • South America
      • Middle East and Africa

      By Application Insights

      The household segment is estimated to witness significant growth during the forecast period.

      The market experiences significant growth as more families prioritize at-home entertainment solutions, particularly residential bounce houses. These inflatable structures offer a safe and controlled environment for children to enjoy fun activities, addressing health and safety concerns that come with commercial facilities. The investment in a residential bounce house is cost-effective in the long run, eliminating the need for recurring expenses on entry fees. The market caters to diverse consumer preferences with various themes, sizes, and customization options. Brands provide after-sales service, warranties, and maintenance packages to ensure customer loyalty and satisfaction. Social media and influencer promotions contribute to the market's expansion, making bounce houses an increasingly popular choice for parties and events.

      Regulations and safety standards ensure the quality and durability of bounce houses, providing peace of mind for parents. The market's evolution includes the integration of e-commerce platforms for online sales, logistics, and distribution, as well as the expansion into commercial applications such as carnivals, theme parks, and indoor facilities. The market continues to adapt to consumer demands, offering a range of solutions for various budgets, events, and entertainment needs.

      Bounce House Market Size

      Get a glance at the market report of share of various segments Request Free Sample

      The Household segment was valued at USD 1389.75 million in 2018 and showed a gradual increase during the forecast period.

      Regional Analysis

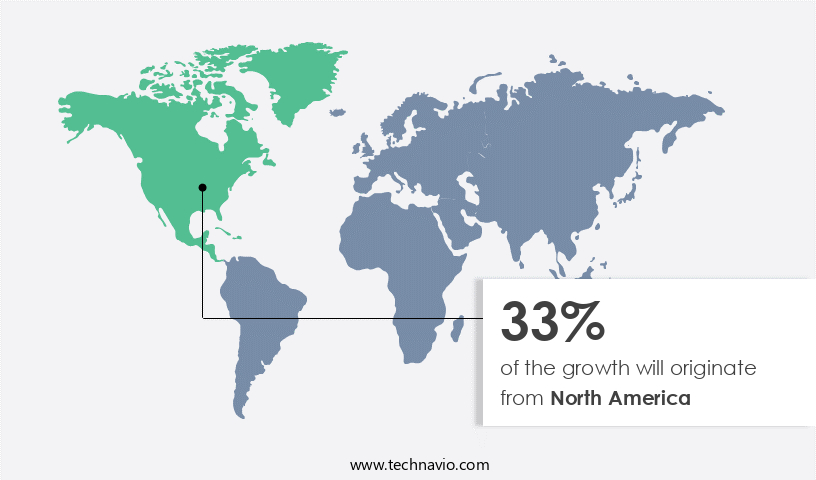
      North America is estimated to contribute 33% to the growth of the global market during the forecast period.Technavio’s analysts have elaborately explained the regional trends and drivers that shape the market during the forecast period.

      Bounce House Market Share by Geography

      For more insights on the market size of various regions, Request Free Sample

      In North America, the market experiences consistent demand due to their popularity as entertainment solutions for parties, events, and family gatherings. The region's tradition of celebrating milestones and community events with inflatable attractions, such as bounce houses, fosters a thriving entrepreneurial environment. Many businesses invest in this sector, recognizing the potential for steady returns. Bounce houses cater to family-oriented activities, offering a safe and enjoyable experience for children at various events. Effective marketing strategies, both online and offline, have boosted their visibility and appeal to consumers. Nylon and PVC materials ensure durability and longevity, while various sizes and customizable designs cater to diverse consumer preferences.

      Social media platforms and influencer collaborations have significantly contributed to the market's growth. Maintenance and repair services ensure the attractions remain in top condition, while adherence to safety regulations maintains consumer trust. The market's focus on sustainability and e-commerce platforms has expanded accessibility and convenience for consumers. Budget-friendly pricing and after-sales services further enhance the consumer experience. Brands invest in warranties and loyalty programs to retain customers and build long-term relationships. The market's focus on safety, entertainment, and customer satisfaction continues to drive its growth in the North American market.

      Market Dynamics

      Our researchers analyzed the data with 2023 as the base year, along with the key drivers, trends, and challenges. A holistic analysis of drivers will help companies refine their marketing strategies to gain a competitive advantage.

      What are the key market drivers leading to the rise in the adoption of Bounce House Industry?

      • Increasing demand for commercial bounce houses is the key driver of the market. 

      • Commercial bounce houses are a popular choice for various sectors, including rental businesses, event planning companies, amusement parks, and recreational facilities, due to their ability to provide engaging entertainment for heavy and frequent use. Constructed with high-quality materials, such as heavy-duty PVC vinyl or nylon, reinforced seams, and industrial-grade stitching, these inflatables can withstand continuous use and varying weather conditions. The increasing demand for unique and exciting entertainment options at events, parties, and gatherings across various industries has fueled the growth of the commercial the market.
      • Event planners and rental companies often turn to bounce houses to enhance their offerings and meet the needs of their clients. The popularity of these inflatables has led to the emergence of specialized rental businesses dedicated to providing high-quality bounce houses for various occasions.

      What are the market trends shaping the Bounce House Industry?

      • demand for themed bounce houses is the upcoming market trend. 

      • The market for bounce houses experiences continuous growth due to the increasing demand for personalized and themed inflatables. Customers prefer unique designs, such as character or movie-themed bounce houses, which add an extra element of excitement and engagement to events. These custom-designed bounce houses have become a focal point at various gatherings, including birthday parties, corporate events, festivals, and community functions.
      • In today's social media-driven culture, visually appealing and unique elements, like themed bounce houses, tend to attract significant attention. The addition of a well-themed bounce house enhances the overall ambiance and makes the occasion more memorable.

      What challenges does the Bounce House Industry face during its growth?

      • High maintenance associated with bounce houses is a key challenge affecting the industry growth. 

      • Proper maintenance is a crucial aspect of the market, ensuring both the longevity and safety of these inflatables. Regular upkeep, including cleaning, patching, inspecting seams, and checking for air leaks, incurs costs but significantly reduces long-term expenses related to replacements. Customers value high-quality, durable bounce houses that are well-maintained, making it essential for rental companies and owners to invest in their upkeep.
      • By consistently maintaining and replacing worn-out units, businesses can attract more customers due to their reliability and commitment to safety. As safety standards and customer expectations continue to evolve, meeting these demands is crucial for sustaining and growing a customer base in the market.

      Exclusive Customer Landscape

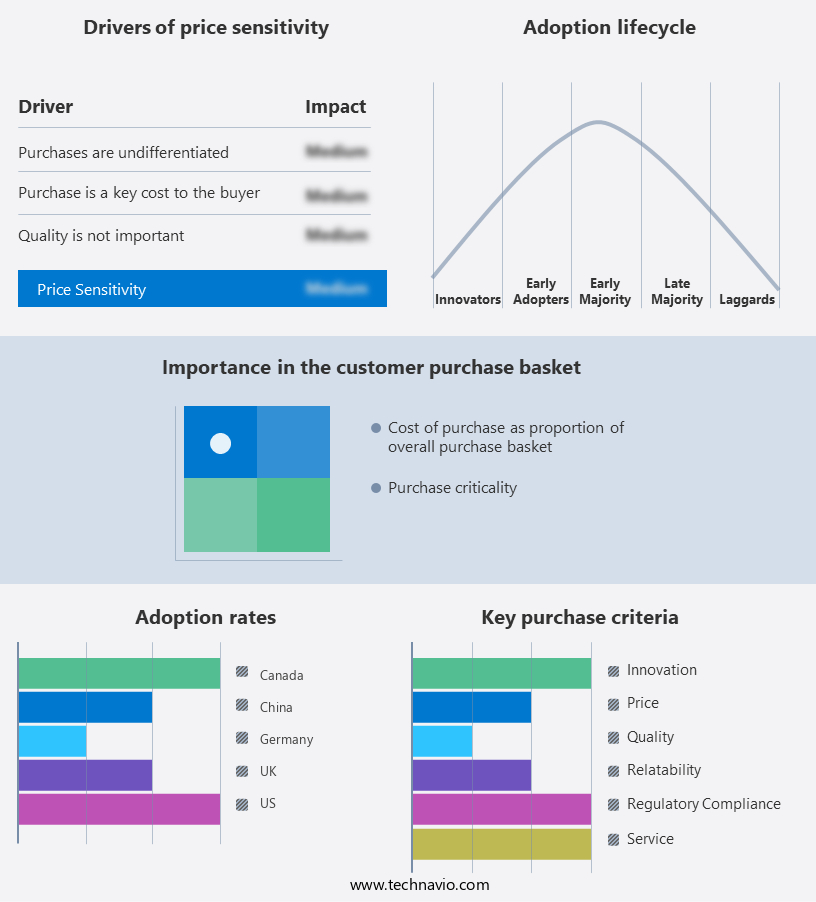
      The bounce house market forecasting report includes the adoption lifecycle of the market, covering from the innovator’s stage to the laggard’s stage. It focuses on adoption rates in different regions based on penetration. Furthermore, the bounce house market report also includes key purchase criteria and drivers of price sensitivity to help companies evaluate and develop their market growth analysis strategies.

      Bounce House Market Share by Geography

       Customer Landscape

      Key Companies & Market Insights

      Companies are implementing various strategies, such as strategic alliances, bounce house market forecast, partnerships, mergers and acquisitions, geographical expansion, and product/service launches, to enhance their presence in the industry.

      ActionAir Global - The company provides a range of high-quality bounce houses, including the Action Air Toddler Bounce House with Slide, Action Air Balloon Jumping Castle with Slide, and Action Air Princess Jumping Castle with Slide for girls. These inflatable structures offer fun and excitement for children, with the added convenience of integrated slides. By prioritizing safety and durability, our offerings ensure a memorable experience for all.

      The industry research and growth report includes detailed analyses of the competitive landscape of the market and information about key companies, including:

      • ActionAir Global
      • Aqua Sports Technology Inc.
      • Baileys Bouncies
      • Bounce House
      • Bounceland Fun
      • Bouncy Trampolines
      • Happy Jump Inc.
      • i2kCo
      • Intex Development Co. Ltd
      • JumpKing International LLP
      • KidWise Outdoor Products Inc.
      • Lowes Co. Inc.
      • Magic Jump Inc.
      • PicassoTiles
      • Strouse Entertainment LLC
      • TentandTable
      • The Home Depot Inc.
      • Blast Zone
      • LIttle Tikes
      • NinjaJump

      Qualitative and quantitative analysis of companies has been conducted to help clients understand the wider business environment as well as the strengths and weaknesses of key industry players. Data is qualitatively analyzed to categorize companies as pure play, category-focused, industry-focused, and diversified; it is quantitatively analyzed to categorize companies as dominant, leading, strong, tentative, and weak.

      Research Analyst Overview

      The market continues to experience significant growth, driven by the increasing popularity of inflatable structures as a form of entertainment for children and commercial events. The demand for these structures is influenced by various factors, including purchasing trends, consumer preferences, and market dynamics. Nylon and PVC are the primary materials used in the production of bounce houses. The choice of material depends on several factors, including durability, cost, and size. Nylon offers superior strength and flexibility, making it an ideal choice for larger and more complex designs. PVC, on the other hand, is more cost-effective and is commonly used for smaller, simpler structures.

      The purchasing process for bounce houses involves various stages, from researching and selecting the right product to making the purchase and arranging for delivery or pick-up. Reviews and recommendations from influencers and past customers play a crucial role in the decision-making process. Social media platforms and online marketplaces have made it easier for consumers to access a wide range of options and compare prices and features. Maintenance and after-sales service are essential components of the market. Regular maintenance ensures the longevity and safety of the structures, while effective after-sales service can help build brand loyalty and positive customer reviews.

      The market is not limited to commercial applications. Many consumers opt for residential purchases for their children's parties and personal use. E-commerce platforms and brick-and-mortar stores offer various options for purchasing, with some offering customization services for unique designs and themes. Logistics and distribution are critical aspects of the market, particularly for commercial applications. Efficient and reliable distribution networks ensure timely delivery and minimize the risk of damage during transportation. Regulations and safety standards also play a significant role in the market. Strict safety regulations are in place to ensure the structures are safe for use and meet specific design and manufacturing requirements.

      Compliance with these regulations is essential for operators and manufacturers to maintain a positive reputation and avoid potential legal issues. The market is highly competitive, with various brands vying for market share. Pricing strategies, product design, and after-sales service are key differentiators for brands looking to stand out in the market. Sustainability is becoming an increasingly important consideration in the market. Many manufacturers are exploring eco-friendly materials and production processes to reduce their environmental impact and appeal to environmentally-conscious consumers. In , the market is a dynamic and evolving industry, driven by consumer preferences, market trends, and regulatory requirements.

      The use of nylon and PVC materials, purchasing trends, maintenance and after-sales service, logistics and distribution, regulations and safety standards, pricing strategies, and sustainability are all essential factors shaping the market's growth and development.

      Market Scope

      Report Coverage

      Details

      Page number

      146

      Base year

      2023

      Historic period

      2018-2022

      Forecast period

      2024-2028

      Growth momentum & CAGR

      Accelerate at a CAGR of 5.81%

      Market growth 2024-2028

      USD 810.16 million

      Market structure

      Fragmented

      YoY growth 2023-2024(%)

      4.82

      Key countries

      US, Canada, China, Germany, and UK

      Competitive landscape

      Leading Companies, Market Positioning of Companies, Competitive Strategies, and Industry Risks

      Request Free Sample

      What are the Key Data Covered in this Bounce House Market Research and Growth Report?

      • CAGR of the Bounce House industry during the forecast period
      • Detailed information on factors that will drive the growth and forecasting between 2024 and 2028
      • Precise estimation of the size of the market and its contribution of the industry in focus to the parent market
      • Accurate predictions about upcoming growth and trends and changes in consumer behaviour
      • Growth of the market across North America, APAC, Europe, South America, and Middle East and Africa
      • Thorough analysis of the market’s competitive landscape and detailed information about companies
      • Comprehensive analysis of factors that will challenge the bounce house market growth of industry companies

      We can help! Our analysts can customize this bounce house market research report to meet your requirements.

      Get in touch


      1 Executive Summary

      • 1.1 Market overview
        • Exhibit 01: Executive Summary – Chart on Market Overview
        • Exhibit 02: Executive Summary – Data Table on Market Overview
        • Exhibit 03: Executive Summary – Chart on Global Market Characteristics
        • Exhibit 04: Executive Summary – Chart on Market by Geography
        • Exhibit 05: Executive Summary – Chart on Market Segmentation by Application
        • Exhibit 06: Executive Summary – Chart on Market Segmentation by Type
        • Exhibit 07: Executive Summary – Chart on Incremental Growth
        • Exhibit 08: Executive Summary – Data Table on Incremental Growth
        • Exhibit 09: Executive Summary – Chart on Vendor Market Positioning

      2 Market Landscape

      • 2.1 Market ecosystem
        • Exhibit 10: Parent market
        • Exhibit 11: Market Characteristics

      3 Market Sizing

      • 3.1 Market definition
        • Exhibit 12: Offerings of vendors included in the market definition
      • 3.2 Market segment analysis
        • Exhibit 13: Market segments
      • 3.3 Market size 2023
        • 3.4 Market outlook: Forecast for 2023-2028
          • Exhibit 14: Chart on Global - Market size and forecast 2023-2028 ($ million)
          • Exhibit 15: Data Table on Global - Market size and forecast 2023-2028 ($ million)
          • Exhibit 16: Chart on Global Market: Year-over-year growth 2023-2028 (%)
          • Exhibit 17: Data Table on Global Market: Year-over-year growth 2023-2028 (%)

        4 Historic Market Size

        • 4.1 Global bounce house market 2018 - 2022
          • Exhibit 18: Historic Market Size – Data Table on global bounce house market 2018 - 2022 ($ million)
        • 4.2 Application Segment Analysis 2018 - 2022
          • Exhibit 19: Historic Market Size – Application Segment 2018 - 2022 ($ million)
        • 4.3 Type Segment Analysis 2018 - 2022
          • Exhibit 20: Historic Market Size – Type Segment 2018 - 2022 ($ million)
        • 4.4 Geography Segment Analysis 2018 - 2022
          • Exhibit 21: Historic Market Size – Geography Segment 2018 - 2022 ($ million)
        • 4.5 Country Segment Analysis 2018 - 2022
          • Exhibit 22: Historic Market Size – Country Segment 2018 - 2022 ($ million)

        5 Five Forces Analysis

        • 5.1 Five forces summary
          • Exhibit 23: Five forces analysis - Comparison between 2023 and 2028
        • 5.2 Bargaining power of buyers
          • Exhibit 24: Chart on Bargaining power of buyers – Impact of key factors 2023 and 2028
        • 5.3 Bargaining power of suppliers
          • Exhibit 25: Bargaining power of suppliers – Impact of key factors in 2023 and 2028
        • 5.4 Threat of new entrants
          • Exhibit 26: Threat of new entrants – Impact of key factors in 2023 and 2028
        • 5.5 Threat of substitutes
          • Exhibit 27: Threat of substitutes – Impact of key factors in 2023 and 2028
        • 5.6 Threat of rivalry
          • Exhibit 28: Threat of rivalry – Impact of key factors in 2023 and 2028
        • 5.7 Market condition
          • Exhibit 29: Chart on Market condition - Five forces 2023 and 2028

        6 Market Segmentation by Application

        • 6.1 Market segments
          • Exhibit 30: Chart on Application - Market share 2023-2028 (%)
          • Exhibit 31: Data Table on Application - Market share 2023-2028 (%)
        • 6.2 Comparison by Application
          • Exhibit 32: Chart on Comparison by Application
          • Exhibit 33: Data Table on Comparison by Application
        • 6.3 Household - Market size and forecast 2023-2028
          • Exhibit 34: Chart on Household - Market size and forecast 2023-2028 ($ million)
          • Exhibit 35: Data Table on Household - Market size and forecast 2023-2028 ($ million)
          • Exhibit 36: Chart on Household - Year-over-year growth 2023-2028 (%)
          • Exhibit 37: Data Table on Household - Year-over-year growth 2023-2028 (%)
        • 6.4 Commercial - Market size and forecast 2023-2028
          • Exhibit 38: Chart on Commercial - Market size and forecast 2023-2028 ($ million)
          • Exhibit 39: Data Table on Commercial - Market size and forecast 2023-2028 ($ million)
          • Exhibit 40: Chart on Commercial - Year-over-year growth 2023-2028 (%)
          • Exhibit 41: Data Table on Commercial - Year-over-year growth 2023-2028 (%)
        • 6.5 Market opportunity by Application
          • Exhibit 42: Market opportunity by Application ($ million)
          • Exhibit 43: Data Table on Market opportunity by Application ($ million)

        7 Market Segmentation by Type

        • 7.1 Market segments
          • Exhibit 44: Chart on Type - Market share 2023-2028 (%)
          • Exhibit 45: Data Table on Type - Market share 2023-2028 (%)
        • 7.2 Comparison by Type
          • Exhibit 46: Chart on Comparison by Type
          • Exhibit 47: Data Table on Comparison by Type
        • 7.3 Dry bounce house - Market size and forecast 2023-2028
          • Exhibit 48: Chart on Dry bounce house - Market size and forecast 2023-2028 ($ million)
          • Exhibit 49: Data Table on Dry bounce house - Market size and forecast 2023-2028 ($ million)
          • Exhibit 50: Chart on Dry bounce house - Year-over-year growth 2023-2028 (%)
          • Exhibit 51: Data Table on Dry bounce house - Year-over-year growth 2023-2028 (%)
        • 7.4 Dry and wet bounce house - Market size and forecast 2023-2028
          • Exhibit 52: Chart on Dry and wet bounce house - Market size and forecast 2023-2028 ($ million)
          • Exhibit 53: Data Table on Dry and wet bounce house - Market size and forecast 2023-2028 ($ million)
          • Exhibit 54: Chart on Dry and wet bounce house - Year-over-year growth 2023-2028 (%)
          • Exhibit 55: Data Table on Dry and wet bounce house - Year-over-year growth 2023-2028 (%)
        • 7.5 Wet bounce house - Market size and forecast 2023-2028
          • Exhibit 56: Chart on Wet bounce house - Market size and forecast 2023-2028 ($ million)
          • Exhibit 57: Data Table on Wet bounce house - Market size and forecast 2023-2028 ($ million)
          • Exhibit 58: Chart on Wet bounce house - Year-over-year growth 2023-2028 (%)
          • Exhibit 59: Data Table on Wet bounce house - Year-over-year growth 2023-2028 (%)
        • 7.6 Market opportunity by Type
          • Exhibit 60: Market opportunity by Type ($ million)
          • Exhibit 61: Data Table on Market opportunity by Type ($ million)

        8 Customer Landscape

        • 8.1 Customer landscape overview
          • Exhibit 62: Analysis of price sensitivity, lifecycle, customer purchase basket, adoption rates, and purchase criteria

        9 Geographic Landscape

        • 9.1 Geographic segmentation
          • Exhibit 63: Chart on Market share by geography 2023-2028 (%)
          • Exhibit 64: Data Table on Market share by geography 2023-2028 (%)
        • 9.2 Geographic comparison
          • Exhibit 65: Chart on Geographic comparison
          • Exhibit 66: Data Table on Geographic comparison
        • 9.3 North America - Market size and forecast 2023-2028
          • Exhibit 67: Chart on North America - Market size and forecast 2023-2028 ($ million)
          • Exhibit 68: Data Table on North America - Market size and forecast 2023-2028 ($ million)
          • Exhibit 69: Chart on North America - Year-over-year growth 2023-2028 (%)
          • Exhibit 70: Data Table on North America - Year-over-year growth 2023-2028 (%)
        • 9.4 APAC - Market size and forecast 2023-2028
          • Exhibit 71: Chart on APAC - Market size and forecast 2023-2028 ($ million)
          • Exhibit 72: Data Table on APAC - Market size and forecast 2023-2028 ($ million)
          • Exhibit 73: Chart on APAC - Year-over-year growth 2023-2028 (%)
          • Exhibit 74: Data Table on APAC - Year-over-year growth 2023-2028 (%)
        • 9.5 Europe - Market size and forecast 2023-2028
          • Exhibit 75: Chart on Europe - Market size and forecast 2023-2028 ($ million)
          • Exhibit 76: Data Table on Europe - Market size and forecast 2023-2028 ($ million)
          • Exhibit 77: Chart on Europe - Year-over-year growth 2023-2028 (%)
          • Exhibit 78: Data Table on Europe - Year-over-year growth 2023-2028 (%)
        • 9.6 South America - Market size and forecast 2023-2028
          • Exhibit 79: Chart on South America - Market size and forecast 2023-2028 ($ million)
          • Exhibit 80: Data Table on South America - Market size and forecast 2023-2028 ($ million)
          • Exhibit 81: Chart on South America - Year-over-year growth 2023-2028 (%)
          • Exhibit 82: Data Table on South America - Year-over-year growth 2023-2028 (%)
        • 9.7 Middle East and Africa - Market size and forecast 2023-2028
          • Exhibit 83: Chart on Middle East and Africa - Market size and forecast 2023-2028 ($ million)
          • Exhibit 84: Data Table on Middle East and Africa - Market size and forecast 2023-2028 ($ million)
          • Exhibit 85: Chart on Middle East and Africa - Year-over-year growth 2023-2028 (%)
          • Exhibit 86: Data Table on Middle East and Africa - Year-over-year growth 2023-2028 (%)
        • 9.8 US - Market size and forecast 2023-2028
          • Exhibit 87: Chart on US - Market size and forecast 2023-2028 ($ million)
          • Exhibit 88: Data Table on US - Market size and forecast 2023-2028 ($ million)
          • Exhibit 89: Chart on US - Year-over-year growth 2023-2028 (%)
          • Exhibit 90: Data Table on US - Year-over-year growth 2023-2028 (%)
        • 9.9 China - Market size and forecast 2023-2028
          • Exhibit 91: Chart on China - Market size and forecast 2023-2028 ($ million)
          • Exhibit 92: Data Table on China - Market size and forecast 2023-2028 ($ million)
          • Exhibit 93: Chart on China - Year-over-year growth 2023-2028 (%)
          • Exhibit 94: Data Table on China - Year-over-year growth 2023-2028 (%)
        • 9.10 Germany - Market size and forecast 2023-2028
          • Exhibit 95: Chart on Germany - Market size and forecast 2023-2028 ($ million)
          • Exhibit 96: Data Table on Germany - Market size and forecast 2023-2028 ($ million)
          • Exhibit 97: Chart on Germany - Year-over-year growth 2023-2028 (%)
          • Exhibit 98: Data Table on Germany - Year-over-year growth 2023-2028 (%)
        • 9.11 Canada - Market size and forecast 2023-2028
          • Exhibit 99: Chart on Canada - Market size and forecast 2023-2028 ($ million)
          • Exhibit 100: Data Table on Canada - Market size and forecast 2023-2028 ($ million)
          • Exhibit 101: Chart on Canada - Year-over-year growth 2023-2028 (%)
          • Exhibit 102: Data Table on Canada - Year-over-year growth 2023-2028 (%)
        • 9.12 UK - Market size and forecast 2023-2028
          • Exhibit 103: Chart on UK - Market size and forecast 2023-2028 ($ million)
          • Exhibit 104: Data Table on UK - Market size and forecast 2023-2028 ($ million)
          • Exhibit 105: Chart on UK - Year-over-year growth 2023-2028 (%)
          • Exhibit 106: Data Table on UK - Year-over-year growth 2023-2028 (%)
        • 9.13 Market opportunity by geography
          • Exhibit 107: Market opportunity by geography ($ million)
          • Exhibit 108: Data Tables on Market opportunity by geography ($ million)

        10 Drivers, Challenges, and Trends

        • 10.1 Market drivers
          • 10.2 Market challenges
            • 10.3 Impact of drivers and challenges
              • Exhibit 109: Impact of drivers and challenges in 2023 and 2028
            • 10.4 Market trends

              11 Vendor Landscape

              • 11.1 Overview
                • 11.2 Vendor landscape
                  • Exhibit 110: Overview on Criticality of inputs and Factors of differentiation
                • 11.3 Landscape disruption
                  • Exhibit 111: Overview on factors of disruption
                • 11.4 Industry risks
                  • Exhibit 112: Impact of key risks on business

                12 Vendor Analysis

                • 12.1 Vendors covered
                  • Exhibit 113: Vendors covered
                • 12.2 Market positioning of vendors
                  • Exhibit 114: Matrix on vendor position and classification
                • 12.3 ActionAir Global
                  • Exhibit 115: ActionAir Global - Overview
                  • Exhibit 116: ActionAir Global - Product / Service
                  • Exhibit 117: ActionAir Global - Key offerings
                • 12.4 Aqua Sports Technology Inc.
                  • Exhibit 118: Aqua Sports Technology Inc. - Overview
                  • Exhibit 119: Aqua Sports Technology Inc. - Product / Service
                  • Exhibit 120: Aqua Sports Technology Inc. - Key offerings
                • 12.5 Bounce House
                  • Exhibit 121: Bounce House - Overview
                  • Exhibit 122: Bounce House - Product / Service
                  • Exhibit 123: Bounce House - Key offerings
                • 12.6 Bounceland Fun
                  • Exhibit 124: Bounceland Fun - Overview
                  • Exhibit 125: Bounceland Fun - Product / Service
                  • Exhibit 126: Bounceland Fun - Key offerings
                • 12.7 Bouncy Trampolines
                  • Exhibit 127: Bouncy Trampolines - Overview
                  • Exhibit 128: Bouncy Trampolines - Product / Service
                  • Exhibit 129: Bouncy Trampolines - Key offerings
                • 12.8 Happy Jump Inc.
                  • Exhibit 130: Happy Jump Inc. - Overview
                  • Exhibit 131: Happy Jump Inc. - Product / Service
                  • Exhibit 132: Happy Jump Inc. - Key offerings
                • 12.9 i2kCo
                  • Exhibit 133: i2kCo - Overview
                  • Exhibit 134: i2kCo - Product / Service
                  • Exhibit 135: i2kCo - Key offerings
                • 12.10 Intex Development Co. Ltd
                  • Exhibit 136: Intex Development Co. Ltd - Overview
                  • Exhibit 137: Intex Development Co. Ltd - Product / Service
                  • Exhibit 138: Intex Development Co. Ltd - Key offerings
                • 12.11 JumpKing International LLP
                  • Exhibit 139: JumpKing International LLP - Overview
                  • Exhibit 140: JumpKing International LLP - Key offerings
                • 12.12 KidWise Outdoor Products Inc.
                  • Exhibit 141: KidWise Outdoor Products Inc. - Overview
                  • Exhibit 142: KidWise Outdoor Products Inc. - Product / Service
                  • Exhibit 143: KidWise Outdoor Products Inc. - Key offerings
                • 12.13 LIttle Tikes
                  • Exhibit 144: LIttle Tikes - Overview
                  • Exhibit 145: LIttle Tikes - Product / Service
                  • Exhibit 146: LIttle Tikes - Key offerings
                • 12.14 Lowes Co. Inc.
                  • Exhibit 147: Lowes Co. Inc. - Overview
                  • Exhibit 148: Lowes Co. Inc. - Product / Service
                  • Exhibit 149: Lowes Co. Inc. - Key offerings
                • 12.15 Magic Jump Inc.
                  • Exhibit 150: Magic Jump Inc. - Overview
                  • Exhibit 151: Magic Jump Inc. - Product / Service
                  • Exhibit 152: Magic Jump Inc. - Key offerings
                • 12.16 NinjaJump
                  • Exhibit 153: NinjaJump - Overview
                  • Exhibit 154: NinjaJump - Product / Service
                  • Exhibit 155: NinjaJump - Key offerings
                • 12.17 Strouse Entertainment LLC
                  • Exhibit 156: Strouse Entertainment LLC - Overview
                  • Exhibit 157: Strouse Entertainment LLC - Product / Service
                  • Exhibit 158: Strouse Entertainment LLC - Key offerings

                13 Appendix

                • 13.1 Scope of the report
                  • 13.2 Inclusions and exclusions checklist
                    • Exhibit 159: Inclusions checklist
                    • Exhibit 160: Exclusions checklist
                  • 13.3 Currency conversion rates for US$
                    • Exhibit 161: Currency conversion rates for US$
                  • 13.4 Research methodology
                    • Exhibit 162: Research methodology
                    • Exhibit 163: Validation techniques employed for market sizing
                    • Exhibit 164: Information sources
                  • 13.5 List of abbreviations
                    • Exhibit 165: List of abbreviations

                  Research Methodology

                  Technavio presents a detailed picture of the market by way of study, synthesis, and summation of data from multiple sources. The analysts have presented the various facets of the market with a particular focus on identifying the key industry influencers. The data thus presented is comprehensive, reliable, and the result of extensive research, both primary and secondary.

                  INFORMATION SOURCES

                  Primary sources

                  • Manufacturers and suppliers
                  • Channel partners
                  • Industry experts
                  • Strategic decision makers

                  Secondary sources

                  • Industry journals and periodicals
                  • Government data
                  • Financial reports of key industry players
                  • Historical data
                  • Press releases

                  DATA ANALYSIS

                  Data Synthesis

                  • Collation of data
                  • Estimation of key figures
                  • Analysis of derived insights

                  Data Validation

                  • Triangulation with data models
                  • Reference against proprietary databases
                  • Corroboration with industry experts

                  REPORT WRITING

                  Qualitative

                  • Market drivers
                  • Market challenges
                  • Market trends
                  • Five forces analysis

                  Quantitative

                  • Market size and forecast
                  • Market segmentation
                  • Geographical insights
                  • Competitive landscape

                  Interested in this report?

                  Get your sample now to see our research methodology and insights!

                  Download Now

                  Frequently Asked Questions

                  Bounce House market growth will increase by $ 810.16 mn during 2024-2028.

                  The Bounce House market is expected to grow at a CAGR of 5.81% during 2024-2028.

                  Bounce House market is segmented by Application( Household, Commercial) Type( Dry bounce house, Dry and wet bounce house, Wet bounce house)

                  ActionAir Global, Aqua Sports Technology Inc., Baileys Bouncies, Bounce House, Bounceland Fun, Bouncy Trampolines, Happy Jump Inc., i2kCo, Intex Development Co. Ltd, JumpKing International LLP, KidWise Outdoor Products Inc., Lowes Co. Inc., Magic Jump Inc., PicassoTiles, Strouse Entertainment LLC, TentandTable, The Home Depot Inc., Blast Zone, LIttle Tikes, NinjaJump are a few of the key vendors in the Bounce House market.

                  North America will register the highest growth rate of 33% among the other regions. Therefore, the Bounce House market in North America is expected to garner significant business opportunities for the vendors during the forecast period.

                  US, Canada, China, Germany, UK

                  • Increasing demand for commercial bounce housesCommercial bounce houses are specifically designed for heavy and frequent use in commercial settings is the driving factor this market.
                  • such as rental businesses is the driving factor this market.
                  • event planning companies is the driving factor this market.
                  • amusement parks is the driving factor this market.
                  • and recreational facilities. Commercial bounce houses are constructed with high-quality materials is the driving factor this market.
                  • typically heavy-duty PVC vinyl or nylon is the driving factor this market.
                  • reinforced seams is the driving factor this market.
                  • and industrial-grade stitching to withstand continuous use and varying weather conditions. The increasing number of events is the driving factor this market.
                  • parties is the driving factor this market.
                  • and gatherings across various sectors is the driving factor this market.
                  • including birthdays is the driving factor this market.
                  • festivals is the driving factor this market.
                  • corporate events is the driving factor this market.
                  • and community celebrations is the driving factor this market.
                  • has increased the need for engaging entertainment options such as bounce houses. Event planners and rental companies often rely on these inflatables to enhance their offerings. The popularity of bounce houses has led to the growth of rental businesses that specialize in providing these inflatables. Entrepreneurs see the potential in this market and establish rental services is the driving factor this market.
                  • driving the demand for commercial-grade bounce houses. Commercial bounce houses adhere to strict safety guidelines and certifications is the driving factor this market.
                  • ensuring they meet industry standards for stability is the driving factor this market.
                  • anchoring systems is the driving factor this market.
                  • and overall structural integrity. Safety features such as reinforced entrance ramps is the driving factor this market.
                  • safety netting is the driving factor this market.
                  • and cushioning are often included. As these inflatables remain a popular and sought-after entertainment option is the driving factor this market.
                  • the market for bounce houses is expected to continue expanding during the forecast period. is the driving factor this market.

                  The Bounce House market vendors should focus on grabbing business opportunities from the Household segment as it accounted for the largest market share in the base year.