Brain Tumor Diagnostics Market Size 2024-2028
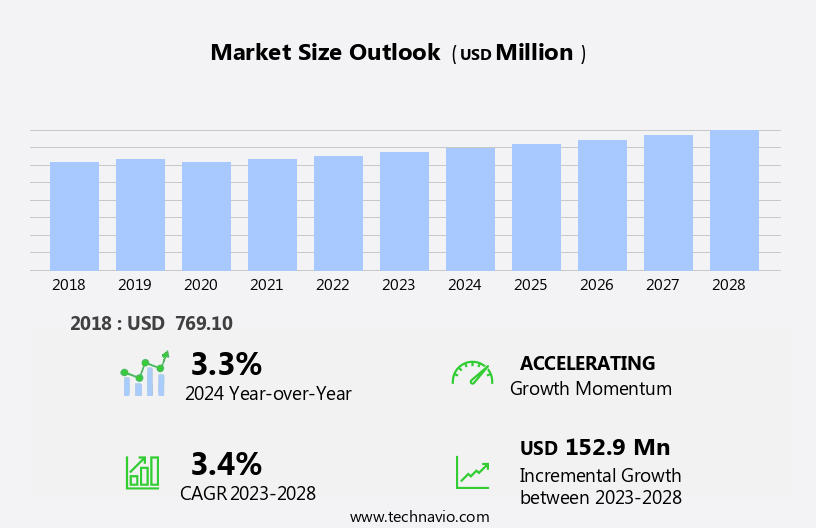
The brain tumor diagnostics market size is forecast to increase by USD 152.9 million, at a CAGR of 3.4% between 2023 and 2028.
- The market is experiencing significant growth, driven by the increasing prevalence of brain cancer and advancements in research and development. The rise in brain cancer cases is fueled by an aging population, increased awareness, and improved diagnostic techniques. Simultaneously, technological innovations, such as magnetic resonance imaging (MRI) and positron emission tomography (PET) scans, are revolutionizing the diagnostic landscape, enabling earlier and more accurate detection of brain tumors. However, the market faces challenges, including an unfavorable reimbursement scenario, which can hinder the adoption of advanced diagnostic technologies. Healthcare systems and insurance providers often limit coverage for expensive diagnostic procedures, making it difficult for patients to access these services.
- To navigate this challenge, companies must collaborate with payers and healthcare providers to develop cost-effective solutions and demonstrate the clinical and economic value of their offerings. By addressing these challenges and capitalizing on the market's growth drivers, companies can seize opportunities and shape the future of brain tumor diagnostics.
What will be the Size of the Brain Tumor Diagnostics Market during the forecast period?
Explore in-depth regional segment analysis with market size data - historical 2018-2022 and forecasts 2024-2028 - in the full report.
Request Free Sample
The market continues to evolve, driven by advancements in technology and research. Brain tumor segmentation, a crucial aspect of diagnostics, is undergoing constant refinement through neurological examinations and various imaging techniques. Optical coherence tomography (OCT) and neuropsychological testing offer non-invasive alternatives to traditional diagnostic methods. The diagnostic imaging workflow is being streamlined with the integration of pet scan tracers and radiomics feature extraction. Near-infrared spectroscopy and contrast-enhanced CT provide additional insights into tumor characteristics. Perfusion MRI techniques, magnetic resonance spectroscopy, and liquid biopsy markers are also gaining traction. Machine learning algorithms, deep learning models, and computer-aided detection are revolutionizing the field, enabling more accurate and efficient diagnoses.
Advanced neuroimaging techniques, such as diffusion tensor imaging, functional MRI studies, and tumor vascularity assessment, offer enhanced visualization of brain structures and tumors. Molecular imaging agents, tissue microarray analysis, and immunohistochemical staining provide valuable information on the tumor microenvironment. Pituitary adenoma imaging and meningioma detection are specific applications of these techniques. Image registration algorithms, gene expression profiling, and glioblastoma characterization are other areas of ongoing research. The use of artificial intelligence diagnostics, exosome-based diagnostics, and advanced imaging technologies continues to unfold, offering new possibilities for improved brain tumor diagnostics. This dynamic landscape underscores the importance of staying informed and adaptable in this rapidly evolving market.
How is this Brain Tumor Diagnostics Industry segmented?
The brain tumor diagnostics industry research report provides comprehensive data (region-wise segment analysis), with forecasts and estimates in "USD million" for the period 2024-2028, as well as historical data from 2018-2022 for the following segments.
- Type
- Imaging test
- Biopsy
- Molecular testing
- Others
- Geography
- North America
- US
- Canada
- Mexico
- Europe
- France
- Germany
- UK
- Middle East and Africa
- South Africa
- APAC
- China
- India
- Japan
- Rest of World (ROW)
- North America
By Type Insights
The imaging test segment is estimated to witness significant growth during the forecast period.
The market is experiencing significant advancements, driven by the increasing prevalence of brain tumors and cancer. Neurological examinations remain the initial diagnostic method, but medical imaging techniques, such as optical coherence tomography, neuropsychological testing, and diagnostic imaging workflows, are increasingly utilized for more accurate and timely diagnoses. Advanced imaging modalities, including pet scan tracers, radiomics feature extraction, near-infrared spectroscopy, contrast-enhanced CT, perfusion MRI techniques, magnetic resonance spectroscopy, and molecular imaging agents, are revolutionizing brain tumor diagnostics. Liquid biopsy markers and gene expression profiling are also gaining popularity for their non-invasive nature and potential for early detection.
Machine learning algorithms, deep learning models, and artificial intelligence diagnostics are being integrated into imaging systems to enhance accuracy and efficiency. Image-guided biopsies, cell-free DNA detection, and functional MRI studies provide more precise and less invasive diagnostic methods. Tumor vascularity assessment, immunohistochemical staining, exosome-based diagnostics, and computer-aided detection are other advanced techniques contributing to the market's growth. The market is further propelled by the development of advanced neuroimaging techniques, such as diffusion tensor imaging, CT scan protocols, multimodal image fusion, and tumor microenvironment analysis. These advancements aim to improve diagnostic accuracy, reduce invasiveness, and enhance patient outcomes.
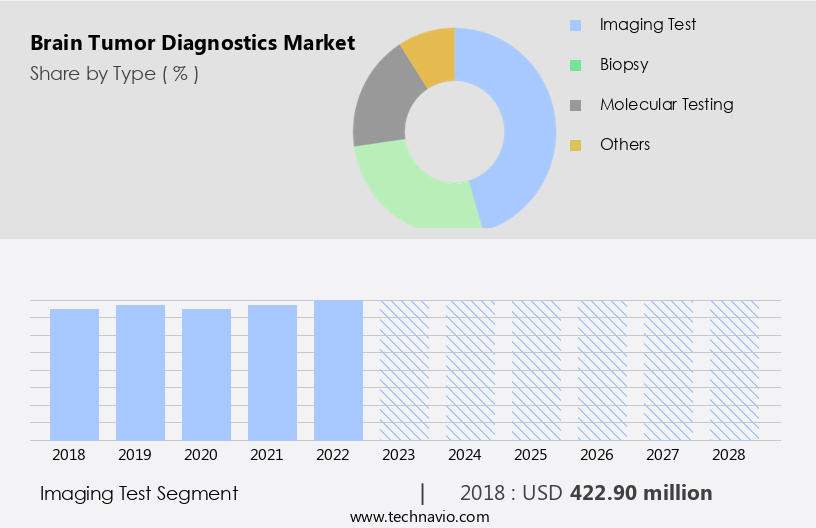
The Imaging test segment was valued at USD 422.90 million in 2018 and showed a gradual increase during the forecast period.
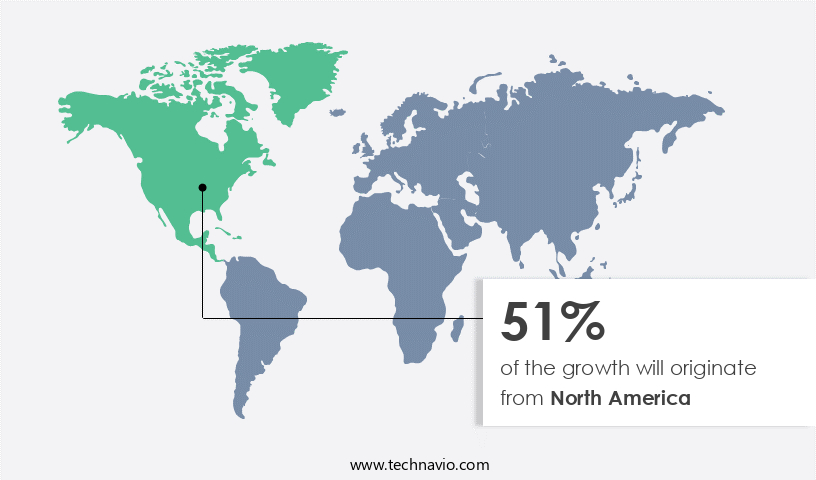
Regional Analysis
North America is estimated to contribute 51% to the growth of the global market during the forecast period.Technavio’s analysts have elaborately explained the regional trends and drivers that shape the market during the forecast period.
The market is witnessing significant advancements, with various technologies and techniques contributing to improved accuracy and early detection. In 2023, North America led the global market, with the US being a major contributor due to a focus on personalized medicine and research grants, such as the USD3.7 million grant awarded by the National Institutes of Health (NIH) to the Washington University School of Medicine for an open-source database to enhance precision medicine for brain tumors. Neurological examinations remain the initial step in brain tumor diagnosis, followed by advanced diagnostic imaging workflows. Technologies like optical coherence tomography, near-infrared spectroscopy, and magnetic resonance spectroscopy offer non-invasive methods for assessing tumor characteristics.
Furthermore, molecular imaging agents, such as pet scan tracers, and advanced neuroimaging techniques, including perfusion MRI and diffusion tensor imaging, provide valuable insights into tumor vascularity and structure. Liquid biopsy markers, radiomics feature extraction, and machine learning algorithms are emerging as promising tools for diagnosing brain tumors. Computer-aided detection, image-guided biopsy, and deep learning models further streamline the diagnostic process. Functional MRI studies, tumor microenvironment analysis, and gene expression profiling offer a more comprehensive understanding of brain tumors, leading to more accurate diagnoses and personalized treatment plans. Meningioma detection, pituitary adenoma imaging, and exosome-based diagnostics are other areas of focus in the market.
Image registration algorithms and multimodal image fusion are essential for integrating data from multiple imaging modalities, while immunohistochemical staining and tissue microarray analysis provide valuable histological information. In conclusion, the market is experiencing rapid growth, driven by advancements in imaging technologies, molecular markers, and artificial intelligence diagnostics. These innovations are enabling earlier and more accurate diagnoses, ultimately improving patient outcomes.
Market Dynamics
Our researchers analyzed the data with 2023 as the base year, along with the key drivers, trends, and challenges. A holistic analysis of drivers will help companies refine their marketing strategies to gain a competitive advantage.
What are the key market drivers leading to the rise in the adoption of Brain Tumor Diagnostics Industry?
- The rising incidence of brain cancer serves as the primary market driver. (Maintaining a professional tone, ensuring grammatical correctness, and adhering to the 100-word limit.)
- Brain tumors, though representing only about 1.4% of all cancer cases in the US, pose a significant challenge due to their often elusive early detection. Delayed diagnosis, which can lead to malignant progression, is a major concern. Advanced diagnostic techniques are essential to improve early detection and characterization of brain tumors. Tissue microarray analysis and gene expression profiling are crucial methods for understanding the tumor microenvironment and identifying potential biomarkers. Imaging technologies, such as MRI neuroimaging and pituitary adenoma imaging, play a vital role in tumor detection and characterization. Image registration algorithms facilitate accurate analysis and comparison of imaging data.
- Biomarker discovery platforms are instrumental in identifying specific molecular markers associated with various brain tumors, including meningioma and glioblastoma. Tumor microenvironment analysis provides valuable insights into the complex interactions between tumor cells and their surroundings, contributing to a better understanding of tumor behavior and potential therapeutic targets. The development of these advanced diagnostic tools and techniques is crucial in addressing the challenges of brain tumor diagnostics and improving patient outcomes.
What are the market trends shaping the Brain Tumor Diagnostics Industry?
- The ongoing market trend reflects a significant growth in research and development and technological advances. Two key areas driving market momentum are innovation and technology.
- Brain tumor diagnostics is a significant area of investment for companies in the healthcare industry. Innovative approaches in cancer diagnosis and treatment are driving market growth. One such advancement is the development of nanoparticle-based theranostics using gold nanoparticles. These nanoparticles combine a therapeutic and diagnostic agent, enhancing tumor monitoring and drug effect understanding. This technology's adoption will increase as new theranostic combined therapeutics become available.
- Neurological examinations, optical coherence tomography, neuropsychological testing, diagnostic imaging workflows, and techniques like pet scan tracers, radiomics feature extraction, and near-infrared spectroscopy continue to play crucial roles in brain tumor diagnosis. The integration of these advanced technologies with nanoparticle-based theranostics will further improve diagnostic accuracy and patient care.
What challenges does the Brain Tumor Diagnostics Industry face during its growth?
- The unfavorable reimbursement scenario poses a significant challenge to the industry's growth trajectory. In order to mitigate this issue and foster continued expansion, it is essential for industry players to collaborate with payers and advocacy groups to find mutually beneficial solutions.
- The market is witnessing significant growth due to the increasing demand for accurate and early diagnosis of brain tumors. Molecular diagnostic tests, such as perfusion MRI techniques, magnetic resonance spectroscopy, and liquid biopsy markers, are gaining popularity for their ability to provide valuable information for identifying brain tumors and determining their malignancy. However, the high cost of these diagnostic methods and the complex reimbursement processes pose challenges to their widespread adoption. Healthcare payers are requesting insurance coverage for specific molecular diagnostic tests due to their high cost. For instance, in the US, Medicare previously used the code stacking method for reimbursement, which required patients to pay for separate tests upfront and then submit authenticated bills for reimbursement.
- This method has since been replaced with a more streamlined process, but the issue of adequate reimbursement and insurance coverage remains a concern. Advanced diagnostic techniques, such as machine learning algorithms, diffusion tensor imaging, CT scan protocols, multimodal image fusion, and deep learning models, are being explored to improve the accuracy and efficiency of brain tumor diagnostics. Image-guided biopsy is also gaining popularity for its ability to provide precise and minimally invasive diagnosis. Despite these advancements, the lack of standardization and regulatory approval for some of these techniques pose challenges to their widespread adoption. In conclusion, the market is expected to grow significantly due to the increasing demand for accurate and early diagnosis of brain tumors.
- However, the high cost of molecular diagnostic methods and the complex reimbursement processes remain major challenges to their widespread adoption. Advanced diagnostic techniques, such as machine learning algorithms and image-guided biopsy, hold promise for improving the accuracy and efficiency of brain tumor diagnostics, but their widespread adoption is hindered by regulatory and standardization issues.
Exclusive Customer Landscape
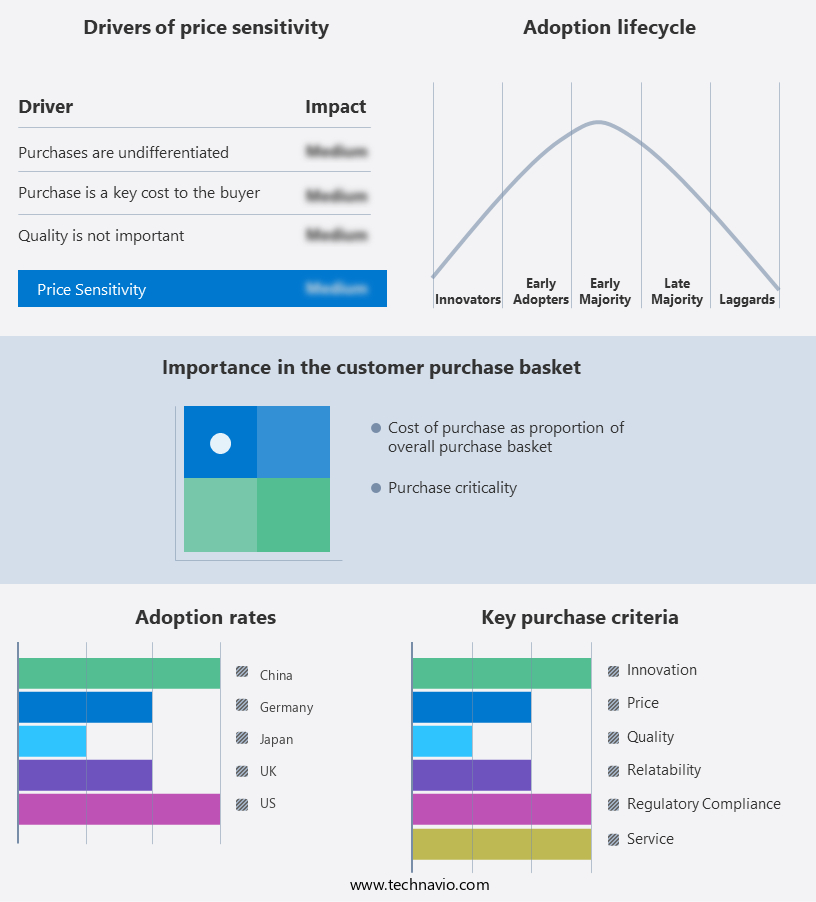
The brain tumor diagnostics market forecasting report includes the adoption lifecycle of the market, covering from the innovator’s stage to the laggard’s stage. It focuses on adoption rates in different regions based on penetration. Furthermore, the brain tumor diagnostics market report also includes key purchase criteria and drivers of price sensitivity to help companies evaluate and develop their market growth analysis strategies.
Customer Landscape
Key Companies & Market Insights
Companies are implementing various strategies, such as strategic alliances, brain tumor diagnostics market forecast, partnerships, mergers and acquisitions, geographical expansion, and product/service launches, to enhance their presence in the industry.
Amgen Inc. - The company specializes in advanced brain tumor diagnostics through its CT Brain Perfusion 4D technology, providing precise and comprehensive imaging analysis for accurate diagnosis and treatment planning. This innovative solution leverages four-dimensional computed tomography to assess cerebral blood flow and metabolism, enabling medical professionals to make informed decisions in managing brain tumors.
The industry research and growth report includes detailed analyses of the competitive landscape of the market and information about key companies, including:
- Amgen Inc.
- AstraZeneca Plc
- Biocept Inc.
- Canon Inc.
- FUJIFILM Holdings Corporation
- GE Healthcare Technologies Inc.
- Hitachi Ltd.
- Hologic Inc.
- Koninklijke Philips N.V.
- MDXHEALTH SA
- Merck and Co. Inc.
- NantOmics
- Neusoft Medical Systems Co. Ltd.
- Pfizer Inc.
- Shimadzu Corp.
- Siemens Healthineers AG
- Thermo Fisher Scientific Inc.
Qualitative and quantitative analysis of companies has been conducted to help clients understand the wider business environment as well as the strengths and weaknesses of key industry players. Data is qualitatively analyzed to categorize companies as pure play, category-focused, industry-focused, and diversified; it is quantitatively analyzed to categorize companies as dominant, leading, strong, tentative, and weak.
Recent Development and News in Brain Tumor Diagnostics Market
- In January 2024, F.DA. Approved the marketing of Abbott's rapid diagnostic test, the i-STAT Alinity T Biomarker assay, for the detection of IDH1 and IDH2 mutations in brain tumor samples (Abbott press release, 2024). This approval marked a significant advancement in the rapid diagnosis of brain tumors.
- In March 2024, Roche and Illumina announced a strategic collaboration to develop and commercialize a next-generation sequencing (NGS) test for the diagnosis and monitoring of brain tumors (Roche press release, 2024). This partnership aimed to improve the accuracy and efficiency of brain tumor diagnostics using advanced NGS technology.
- In May 2024, Qiagen raised â¬120 million in a funding round to expand its portfolio of molecular diagnostic solutions, including those for brain tumors (Qiagen press release, 2024). This investment would support the development and commercialization of new tests and technologies in the market.
- In April 2025, Thermo Fisher Scientific launched the Oncomine Brain Cancer Research Assay, a comprehensive solution for brain tumor research and diagnostics (Thermo Fisher Scientific press release, 2025). This assay enables the identification and characterization of various brain tumor types, offering valuable insights for research and clinical applications.
Research Analyst Overview
- The market is witnessing significant advancements driven by the integration of innovative technologies and methods. Genetic mutation testing and tissue characterization methods, such as methylation profiling and voxel-based morphometry, are transforming diagnosis by enabling personalized treatment strategies. Image quality metrics, including dynamic contrast-enhanced MRI and susceptibility-weighted imaging, are essential for accurate diagnostic assessment. Who classification criteria and tumor grading systems are being refined through the use of data analytics platforms and risk stratification models. Oncolytic virus therapy and targeted drug delivery are revolutionizing therapeutic response monitoring, while surgical resection guidance from intraoperative imaging is improving patient outcome prediction.
- Proton MR spectroscopy and magnetic resonance elastography are essential for tissue characterization, while clinical trial enrollment is accelerated through the identification of prognostic biomarkers. The precision oncology approach is enhancing diagnostic accuracy assessment through the application of high-resolution MRI, arterial spin labeling, and sensitivity and specificity analysis. Positive and negative predictive values are crucial metrics for evaluating diagnostic tests, while radiotherapy treatment planning benefits from the integration of these advanced imaging techniques and therapeutic response monitoring methods.
Dive into Technavio’s robust research methodology, blending expert interviews, extensive data synthesis, and validated models for unparalleled Brain Tumor Diagnostics Market insights. See full methodology.
|
Market Scope |
|
|
Report Coverage |
Details |
|
Page number |
168 |
|
Base year |
2023 |
|
Historic period |
2018-2022 |
|
Forecast period |
2024-2028 |
|
Growth momentum & CAGR |
Accelerate at a CAGR of 3.4% |
|
Market growth 2024-2028 |
USD 152.9 million |
|
Market structure |
Fragmented |
|
YoY growth 2023-2024(%) |
3.3 |
|
Key countries |
US, Germany, UK, China, Japan, France, Canada, Mexico, India, and South Africa |
|
Competitive landscape |
Leading Companies, Market Positioning of Companies, Competitive Strategies, and Industry Risks |
What are the Key Data Covered in this Brain Tumor Diagnostics Market Research and Growth Report?
- CAGR of the Brain Tumor Diagnostics industry during the forecast period
- Detailed information on factors that will drive the growth and forecasting between 2024 and 2028
- Precise estimation of the size of the market and its contribution of the industry in focus to the parent market
- Accurate predictions about upcoming growth and trends and changes in consumer behaviour
- Growth of the market across North America, Europe, Asia, and Rest of World (ROW)
- Thorough analysis of the market’s competitive landscape and detailed information about companies
- Comprehensive analysis of factors that will challenge the brain tumor diagnostics market growth of industry companies
We can help! Our analysts can customize this brain tumor diagnostics market research report to meet your requirements.
 RIA -
RIA - 
