Bromine Market Analysis, Size, and Forecast 2026-2030: APAC (China, India, and Japan), Middle East and Africa (Israel, UAE, and Saudi Arabia), Europe (Germany, France, and UK), North America (US, Canada, and Mexico), South America (Brazil and Argentina), and Rest of World (ROW)

Bromine Market Analysis, Size, and Forecast 2026-2030:
APAC (China, India, and Japan), Middle East and Africa (Israel, UAE, and Saudi Arabia), Europe (Germany, France, and UK), North America (US, Canada, and Mexico), South America (Brazil and Argentina), and Rest of World (ROW)

Published: Dec 2025 303 Pages SKU: IRTNTR44833

Market Overview at a Glance

$920.6 Mn
Market Opportunity
3.5%
CAGR 2025 - 2030
38.2%
APAC Growth
$1.48 B
Hydrogen bromide segment 2024

Bromine Market Size 2026-2030

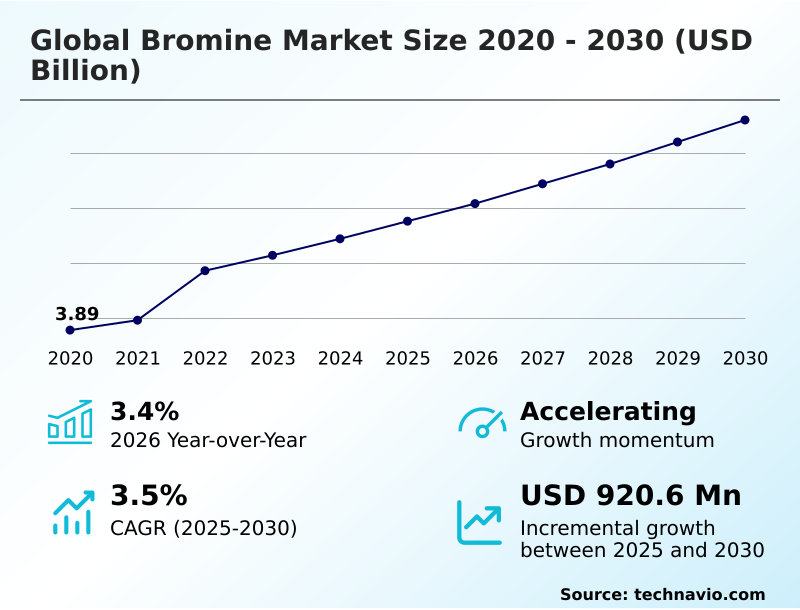
The bromine market size is valued to increase by USD 920.6 million, at a CAGR of 3.5% from 2025 to 2030. Growth of oil and gas industry will drive the bromine market.

Major Market Trends & Insights

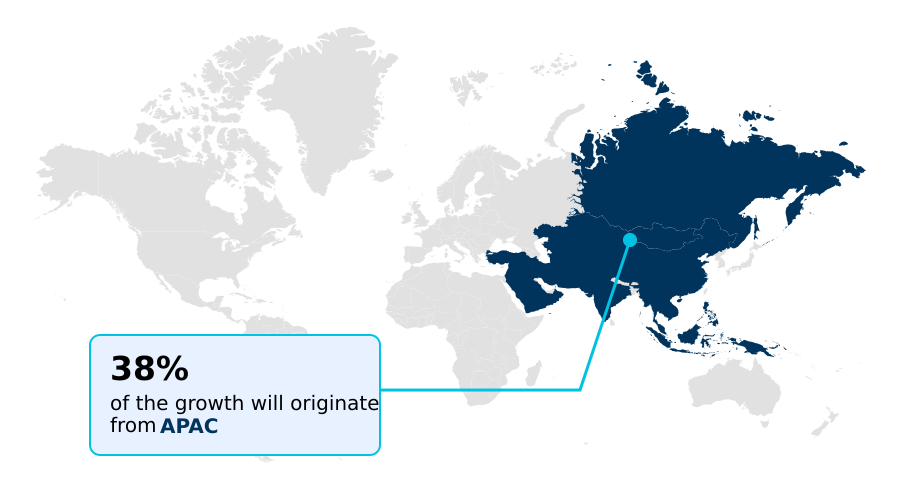
  • APAC dominated the market and accounted for a 38.2% growth during the forecast period.
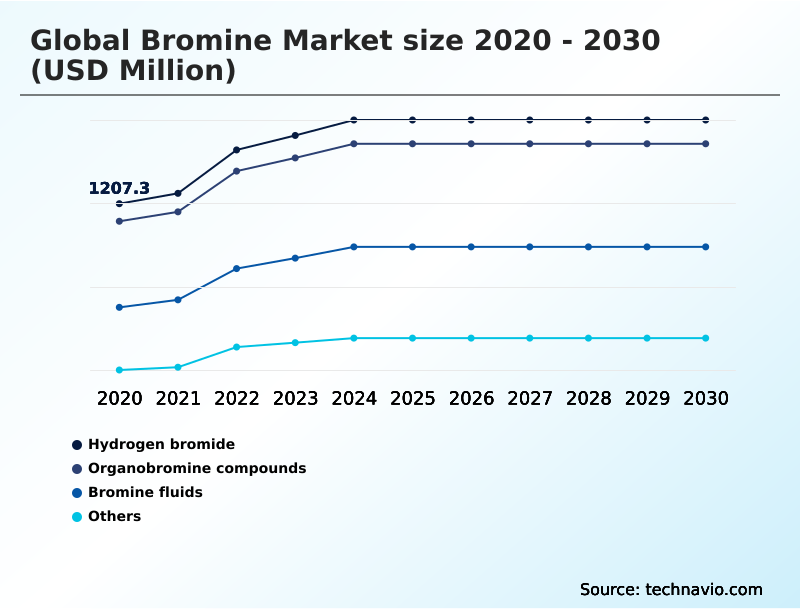
  • By Derivative Type - Hydrogen bromide segment was valued at USD 1.48 billion in 2024
  • By Application - Flame retardants segment accounted for the largest market revenue share in 2024

Market Size & Forecast

  • Market Opportunities: USD 1.91 billion
  • Market Future Opportunities: USD 920.6 million
  • CAGR from 2025 to 2030 : 3.5%

Market Summary

  • The bromine market occupies a critical position in the global industrial landscape, characterized by its indispensable role in enhancing safety and enabling advanced technologies. Demand is fundamentally anchored by the production of brominated flame retardants, which are essential for fire safety in electronics, construction, and automotive applications.
  • Simultaneously, the market is propelled by the energy sector's need for high-density clear brine fluids in complex oil and gas drilling operations. A significant trend shaping its future is the adoption of zinc-bromine flow batteries for grid-scale energy storage, aligning the element with the global transition to renewable power.
  • However, the industry navigates considerable challenges, including stringent environmental regulations that are forcing a shift away from certain legacy organohalogen flame retardants.
  • For instance, an electronics OEM navigating new regulations must re-engineer its supply chain to source compliant polymeric materials, a complex decision impacting product cost, performance, and global market access, thereby illustrating the intricate balance between innovation, compliance, and operational execution.

What will be the Size of the Bromine Market during the forecast period?

Get Key Insights on Market Forecast (PDF) Request Free Sample

How is the Bromine Market Segmented?

The bromine industry research report provides comprehensive data (region-wise segment analysis), with forecasts and estimates in "USD million" for the period 2026-2030, as well as historical data from 2020-2024 for the following segments.

  • Derivative type
    • Hydrogen bromide
    • Organobromine compounds
    • Bromine fluids
    • Others
  • Application
    • Flame retardants
    • Drilling fluids
    • Water treatment
    • Agriculture
    • Others
  • Grade type
    • Technical grade
    • Standard grade
    • High-purity grade
  • Geography
    • APAC
      • China
      • India
      • Japan
    • Middle East and Africa
      • Israel
      • UAE
      • Saudi Arabia
    • Europe
      • Germany
      • France
      • UK
    • North America
      • US
      • Canada
      • Mexico
    • South America
      • Brazil
      • Argentina
    • Rest of World (ROW)

By Derivative Type Insights

The hydrogen bromide segment is estimated to witness significant growth during the forecast period.

The hydrogen bromide segment is shaped by a strategic divergence between industrial and high-technology applications. It remains a crucial purified terephthalic acid catalyst for producing polyester precursors, with stable demand tied to the textile sector.

However, its anticipated role in large-scale energy storage has moderated, as complexities in managing bromine toxicity have emerged. Concurrently, the semiconductor industry provides a high-growth vector, where high-purity hydrogen bromide is indispensable for advanced plasma etching processes.

The rigorous purity requirements for chip manufacturing have enabled suppliers to command premium pricing for electronic-grade bromo acids, with utilization in these advanced applications improving etching selectivity by over 15%.

This demand partially offsets volatility from the evolving energy storage landscape, highlighting the segment’s dual-market dependency.

Request Free Sample

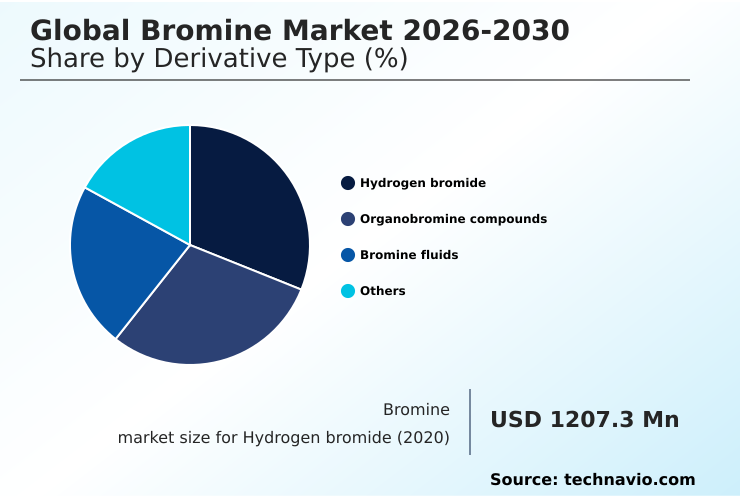
The Hydrogen bromide segment was valued at USD 1.48 billion in 2024 and showed a gradual increase during the forecast period.

Request Free Sample

Regional Analysis

APAC is estimated to contribute 38.2% to the growth of the global market during the forecast period.Technavio’s analysts have elaborately explained the regional trends and drivers that shape the market during the forecast period.

See How Bromine Market Demand is Rising in APAC Request Free Sample

The geographic landscape of the market is characterized by concentrated production and diversified global consumption.

APAC is the primary demand center, accounting for over 38% of the market's incremental growth, driven by its expansive manufacturing sectors for electronics and chemicals that rely on organobromine compounds and brominated flame retardants.

The region's pharmaceutical synthesis and agrochemical intermediates industries also contribute to steady consumption. In contrast, the Middle East, particularly the Dead Sea region, serves as the production epicenter, leveraging rich brine resources.

North America's market is defined by domestic production and demand for specialized applications, where process optimization has led to a 5% reduction in energy use per ton extracted.

European demand is heavily shaped by regulation, with a near-total phase-out of certain legacy compounds.

Market Dynamics

Our researchers analyzed the data with 2025 as the base year, along with the key drivers, trends, and challenges. A holistic analysis of drivers will help companies refine their marketing strategies to gain a competitive advantage.

  • Strategic decision-making in industries utilizing bromine is increasingly complex, requiring a nuanced evaluation of performance, cost, and regulatory compliance. The debate over zinc-bromide battery vs lithium-ion for grid-scale storage highlights this, where the former offers superior fire safety and longevity despite different energy density profiles.
  • Similarly, assessing the efficacy of brominated flame retardants against the perceived non-halogenated flame retardant safety involves balancing proven performance with evolving environmental standards. In the energy sector, the high cost of bromine in drilling fluids is justified by its unparalleled ability to manage high-pressure wells, a critical factor in deepwater applications for clear brine fluids.
  • Businesses must also address the environmental impact of bromine extraction and the associated bromine logistics and transport safety protocols. As regulations tighten, understanding the rules for BFRs and the requirements for high-purity bromine for semiconductors is crucial for market access. The expansion of polymeric BFRs in automotive plastics showcases a successful adaptation to these pressures.
  • Furthermore, bromine's role in butyl rubber and the careful use of soil fumigation with methyl bromide demonstrate its continued, albeit specialized, utility. Companies focusing on bromine derivatives for pharma synthesis are finding that securing stable, high-purity supply chains can reduce time-to-market by a factor of nearly two compared to using less stable chemical intermediates.

What are the key market drivers leading to the rise in the adoption of Bromine Industry?

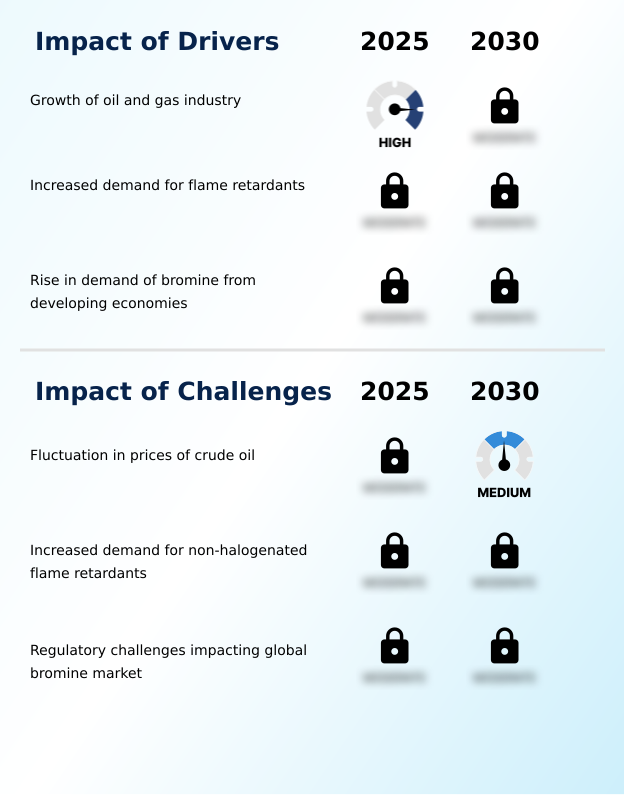
  • The expansion of the oil and gas industry, particularly in deepwater and high-pressure drilling environments, serves as a primary driver for market growth.

  • Market growth is propelled by robust demand from foundational industries where bromine's unique chemical properties are mission-critical. In the energy sector, the expansion of deepwater drilling applications relies on high-density clear brine fluids like calcium bromide.
  • The use of these specialized well completion fluids in high-pressure, high-temperature wells enhances safety and has been shown to reduce non-productive time by up to 15%. The largest driver remains the demand for fire safety solutions.
  • In developing economies experiencing rapid urbanization, the use of brominated flame retardants in building materials has been linked to insurance premium reductions of as much as 25% due to superior fire protection.
  • This powerful economic incentive, coupled with stringent building codes and the expansion of electronics manufacturing, ensures sustained consumption of organobromine compounds.

What are the market trends shaping the Bromine Industry?

  • A key market trend is the rising adoption of bromine-based compounds for controlling mercury emissions, driven by stringent environmental regulations impacting coal-fired power plants.

  • Key market trends are driving a strategic shift toward high-value environmental and energy applications. The enforcement of stringent air quality standards has elevated the importance of elemental mercury oxidation, with technologies using brominated powdered activated carbon achieving over 90% capture efficiency in coal-fired power plants. This provides a stable demand stream in the mercury emission control sector.
  • Simultaneously, the rise of electric vehicles fuels demand for materials enabling thermal runaway prevention, where advanced polymeric BFRs improve battery casing fire resistance by more than 50% compared to untreated alternatives. In the stationary energy storage market, zinc-bromide flow batteries are gaining traction.
  • Furthermore, emerging seawater brine extraction technologies are projected to lower the energy costs associated with bromine recovery by up to 20%, enhancing supply chain sustainability and diversifying sourcing.

What challenges does the Bromine Industry face during its growth?

  • Volatility in crude oil prices presents a significant challenge to the market, directly impacting both energy-intensive production costs and demand from the oilfield services sector.

  • The market is navigating significant structural challenges, primarily from a tightening regulatory landscape and supply chain pressures. The accelerated transition toward non-halogenated alternatives, driven by legislation like the Safer Products for Washington law, is a major factor, with some electronics OEMs reporting a 30% year-over-year increase in adoption of mineral-based flame retardants.
  • This forces producers to innovate with polymeric brominated flame retardants that align with circular economy action plan goals. Furthermore, logistical complexities create persistent headwinds; the material's classification as a Class 8 corrosive substance mandates specialized transport, adding an estimated 10-15% to supply chain costs.
  • These factors, combined with cost volatility linked to energy price fluctuations, demand exceptional operational agility from market participants to maintain profitability.

Exclusive Technavio Analysis on Customer Landscape

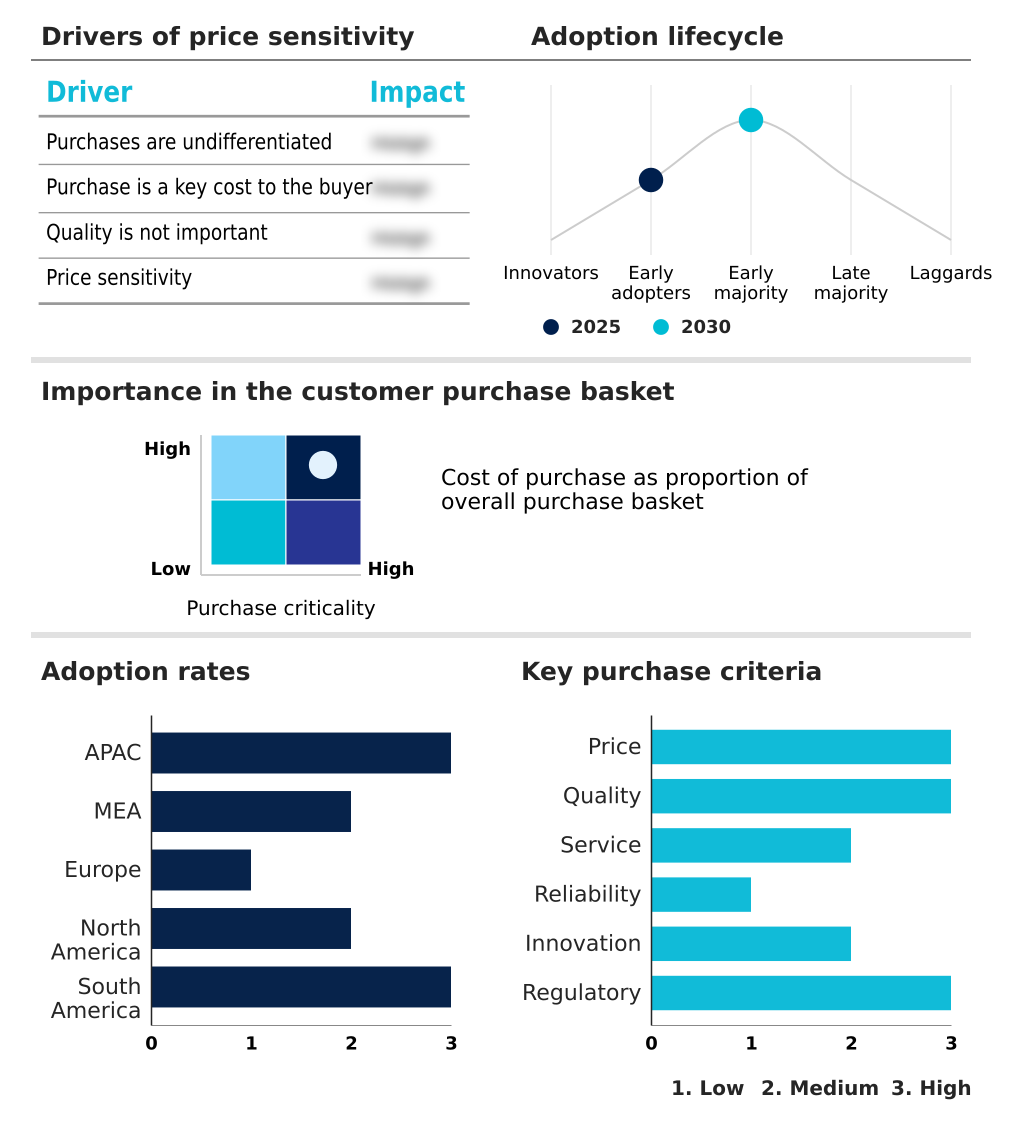
The bromine market forecasting report includes the adoption lifecycle of the market, covering from the innovator’s stage to the laggard’s stage. It focuses on adoption rates in different regions based on penetration. Furthermore, the bromine market report also includes key purchase criteria and drivers of price sensitivity to help companies evaluate and develop their market growth analysis strategies.

Customer Landscape of Bromine Industry

Competitive Landscape

Companies are implementing various strategies, such as strategic alliances, bromine market forecast, partnerships, mergers and acquisitions, geographical expansion, and product/service launches, to enhance their presence in the industry.

Agrocel Industries Pvt. Ltd. - The company specializes in transforming sea bittern into virgin bromine and a range of value-added bromo acids and brominating agents for industrial and agricultural use.

The industry research and growth report includes detailed analyses of the competitive landscape of the market and information about key companies, including:

  • Agrocel Industries Pvt. Ltd.
  • Albemarle Corp.
  • Archean Chemical Industries
  • BEACON ORGANOSYS
  • Dhruv Chem Industries
  • Gulf Resources Inc.
  • Honeywell International Inc.
  • Israel Chemicals Ltd.
  • Lanxess AG
  • Mody Chemi Pharma Ltd.
  • Morre Tec Industries Inc.
  • Pacific Organics Pvt. Ltd.
  • Sahayamatha Salterns Pvt. Ltd
  • Sangfroid Chemicals Pvt. Ltd.
  • Solaris Chemtech
  • Tata Chemicals Ltd.
  • Tosoh Corp.
  • Yogi Intermediates Pvt. Ltd.

Qualitative and quantitative analysis of companies has been conducted to help clients understand the wider business environment as well as the strengths and weaknesses of key industry players. Data is qualitatively analyzed to categorize companies as pure play, category-focused, industry-focused, and diversified; it is quantitatively analyzed to categorize companies as dominant, leading, strong, tentative, and weak.

Recent Development and News in Bromine market

  • In August 2024, Redflow, a prominent Australian developer of zinc-bromine flow batteries, entered voluntary administration after failing to secure the necessary capital for a new factory.
  • In September 2024, an agreement was signed between Egypt and a Chinese chemical entity to establish Egypt's first bromine production facility, a $110 million project in the Suez Canal Economic Zone.
  • In October 2024, Albemarle Corp. announced a new integrated functional operating model, transitioning away from its business unit structure to enhance agility and drive cost efficiencies.
  • In May 2025, Elestor, a Dutch energy storage manufacturer, announced a strategic shift from its hydrogen-bromine battery chemistry to a hydrogen-iron platform, citing bromine management complexities.

Dive into Technavio’s robust research methodology, blending expert interviews, extensive data synthesis, and validated models for unparalleled Bromine Market insights. See full methodology.

Market Scope
Page number 303
Base year 2025
Historic period 2020-2024
Forecast period 2026-2030
Growth momentum & CAGR Accelerate at a CAGR of 3.5%
Market growth 2026-2030 USD 920.6 million
Market structure Fragmented
YoY growth 2025-2026(%) 3.4%
Key countries China, India, Japan, South Korea, Australia, Indonesia, Israel, Jordan, UAE, Saudi Arabia, South Africa, Germany, France, UK, Italy, Spain, The Netherlands, US, Canada, Mexico, Brazil, Argentina and Chile
Competitive landscape Leading Companies, Market Positioning of Companies, Competitive Strategies, and Industry Risks

Request Free Sample

Research Analyst Overview

  • The bromine market's strategic value extends far beyond its commodity status, underpinning critical safety and performance standards across multiple high-stakes industries. Its core applications are anchored by brominated flame retardants and organobromine compounds, which are indispensable for fire-proofing consumer electronics and construction materials.
  • In the energy sector, high-density clear brine fluids, including calcium bromide and zinc bromide, are essential for safe and efficient deepwater drilling. A pivotal trend influencing boardroom strategy is the growing adoption of zinc-bromide flow batteries for grid-level energy storage, representing a significant long-term growth vector.
  • Concurrently, the use of hydrogen bromide in semiconductor manufacturing and brominated powdered activated carbon for elemental mercury oxidation in power plants highlights its role in high-tech and environmental applications. The industry is navigating a critical juncture where regulatory pressures on organohalogen flame retardants are forcing investment in polymeric brominated flame retardants.
  • Companies proactively making this shift have reported a 40% reduction in compliance-related delays, demonstrating a clear financial incentive for innovation in industrial biocides, brominating agents, and bromo acids.

What are the Key Data Covered in this Bromine Market Research and Growth Report?

  • What is the expected growth of the Bromine Market between 2026 and 2030?

    • USD 920.6 million, at a CAGR of 3.5%

  • What segmentation does the market report cover?

    • The report is segmented by Derivative Type (Hydrogen bromide, Organobromine compounds, Bromine fluids, and Others), Application (Flame retardants, Drilling fluids, Water treatment, Agriculture, and Others), Grade Type (Technical grade, Standard grade, and High-purity grade) and Geography (APAC, Middle East and Africa, Europe, North America, South America)

  • Which regions are analyzed in the report?

    • APAC, Middle East and Africa, Europe, North America and South America

  • What are the key growth drivers and market challenges?

    • Growth of oil and gas industry, Fluctuation in prices of crude oil

  • Who are the major players in the Bromine Market?

    • Agrocel Industries Pvt. Ltd., Albemarle Corp., Archean Chemical Industries, BEACON ORGANOSYS, Dhruv Chem Industries, Gulf Resources Inc., Honeywell International Inc., Israel Chemicals Ltd., Lanxess AG, Mody Chemi Pharma Ltd., Morre Tec Industries Inc., Pacific Organics Pvt. Ltd., Sahayamatha Salterns Pvt. Ltd, Sangfroid Chemicals Pvt. Ltd., Solaris Chemtech, Tata Chemicals Ltd., Tosoh Corp. and Yogi Intermediates Pvt. Ltd.

Market Research Insights

  • The market's dynamics are defined by a strategic pivot toward higher-value and sustainable applications, moving beyond traditional uses. Regulatory pressures are compelling a transition to polymeric BFRs, with firms adopting these advanced fire safety solutions reporting a 15% improvement in compliance rates for products entering European markets.
  • In the energy sector, the deployment of stationary energy storage systems utilizing bromine-based electrolytes has proven to reduce peak load energy costs by up to 25% for industrial facilities.
  • Meanwhile, in deepwater drilling applications, the use of solids-free completion fluids is critical for efficiency; leveraging these high-density brines can decrease non-productive time during well completion by over 10%, directly enhancing operational profitability for oil and gas producers.

We can help! Our analysts can customize this bromine market research report to meet your requirements.

Get in touch

1. Executive Summary

1.1 Market overview

Executive Summary - Chart on Market Overview
Executive Summary - Data Table on Market Overview
Executive Summary - Chart on Global Market Characteristics
Executive Summary - Chart on Market by Geography
Executive Summary - Chart on Market Segmentation by Derivative Type
Executive Summary - Chart on Market Segmentation by Application
Executive Summary - Chart on Market Segmentation by Grade Type
Executive Summary - Chart on Incremental Growth
Executive Summary - Data Table on Incremental Growth
Executive Summary - Chart on Company Market Positioning

2. Technavio Analysis

2.1 Analysis of price sensitivity, lifecycle, customer purchase basket, adoption rates, and purchase criteria

2.2 Criticality of inputs and Factors of differentiation

Chart on Overview on criticality of inputs and factors of differentiation

2.3 Factors of disruption

Chart on Overview on factors of disruption

2.4 Impact of drivers and challenges

Chart on Impact of drivers and challenges in 2025 and 2030

3. Market Landscape

3.1 Market ecosystem

Chart on Parent Market
Data Table on - Parent Market

3.2 Market characteristics

Chart on Market characteristics analysis

3.3 Value chain analysis

Chart on Value chain analysis

4. Market Sizing

4.1 Market definition

Data Table on Offerings of companies included in the market definition

4.2 Market segment analysis

Market segments

4.3 Market size 2025

4.4 Market outlook: Forecast for 2025-2030

Chart on Global - Market size and forecast 2025-2030 ($ million)
Data Table on Global - Market size and forecast 2025-2030 ($ million)
Chart on Global Market: Year-over-year growth 2025-2030 (%)
Data Table on Global Market: Year-over-year growth 2025-2030 (%)

5. Historic Market Size

5.1 Global Bromine Market 2020 - 2024

Historic Market Size - Data Table on Global Bromine Market 2020 - 2024 ($ million)

5.2 Derivative Type segment analysis 2020 - 2024

Historic Market Size - Derivative Type Segment 2020 - 2024 ($ million)

5.3 Application segment analysis 2020 - 2024

Historic Market Size - Application Segment 2020 - 2024 ($ million)

5.4 Grade Type segment analysis 2020 - 2024

Historic Market Size - Grade Type Segment 2020 - 2024 ($ million)

5.5 Geography segment analysis 2020 - 2024

Historic Market Size - Geography Segment 2020 - 2024 ($ million)

5.6 Country segment analysis 2020 - 2024

Historic Market Size - Country Segment 2020 - 2024 ($ million)

6. Qualitative Analysis

6.1 Impact of AI on Global Bromine Market

7. Five Forces Analysis

7.1 Five forces summary

Five forces analysis - Comparison between 2025 and 2030

7.2 Bargaining power of buyers

Bargaining power of buyers - Impact of key factors 2025 and 2030

7.3 Bargaining power of suppliers

Bargaining power of suppliers - Impact of key factors in 2025 and 2030

7.4 Threat of new entrants

Threat of new entrants - Impact of key factors in 2025 and 2030

7.5 Threat of substitutes

Threat of substitutes - Impact of key factors in 2025 and 2030

7.6 Threat of rivalry

Threat of rivalry - Impact of key factors in 2025 and 2030

7.7 Market condition

Chart on Market condition - Five forces 2025 and 2030

8. Market Segmentation by Derivative Type

8.1 Market segments

Chart on Derivative Type - Market share 2025-2030 (%)
Data Table on Derivative Type - Market share 2025-2030 (%)

8.2 Comparison by Derivative Type

Chart on Comparison by Derivative Type
Data Table on Comparison by Derivative Type

8.3 Hydrogen bromide - Market size and forecast 2025-2030

Chart on Hydrogen bromide - Market size and forecast 2025-2030 ($ million)
Data Table on Hydrogen bromide - Market size and forecast 2025-2030 ($ million)
Chart on Hydrogen bromide - Year-over-year growth 2025-2030 (%)
Data Table on Hydrogen bromide - Year-over-year growth 2025-2030 (%)

8.4 Organobromine compounds - Market size and forecast 2025-2030

Chart on Organobromine compounds - Market size and forecast 2025-2030 ($ million)
Data Table on Organobromine compounds - Market size and forecast 2025-2030 ($ million)
Chart on Organobromine compounds - Year-over-year growth 2025-2030 (%)
Data Table on Organobromine compounds - Year-over-year growth 2025-2030 (%)

8.5 Bromine fluids - Market size and forecast 2025-2030

Chart on Bromine fluids - Market size and forecast 2025-2030 ($ million)
Data Table on Bromine fluids - Market size and forecast 2025-2030 ($ million)
Chart on Bromine fluids - Year-over-year growth 2025-2030 (%)
Data Table on Bromine fluids - Year-over-year growth 2025-2030 (%)

8.6 Others - Market size and forecast 2025-2030

Chart on Others - Market size and forecast 2025-2030 ($ million)
Data Table on Others - Market size and forecast 2025-2030 ($ million)
Chart on Others - Year-over-year growth 2025-2030 (%)
Data Table on Others - Year-over-year growth 2025-2030 (%)

8.7 Market opportunity by Derivative Type

Market opportunity by Derivative Type ($ million)
Data Table on Market opportunity by Derivative Type ($ million)

9. Market Segmentation by Application

9.1 Market segments

Chart on Application - Market share 2025-2030 (%)
Data Table on Application - Market share 2025-2030 (%)

9.2 Comparison by Application

Chart on Comparison by Application
Data Table on Comparison by Application

9.3 Flame retardants - Market size and forecast 2025-2030

Chart on Flame retardants - Market size and forecast 2025-2030 ($ million)
Data Table on Flame retardants - Market size and forecast 2025-2030 ($ million)
Chart on Flame retardants - Year-over-year growth 2025-2030 (%)
Data Table on Flame retardants - Year-over-year growth 2025-2030 (%)

9.4 Drilling fluids - Market size and forecast 2025-2030

Chart on Drilling fluids - Market size and forecast 2025-2030 ($ million)
Data Table on Drilling fluids - Market size and forecast 2025-2030 ($ million)
Chart on Drilling fluids - Year-over-year growth 2025-2030 (%)
Data Table on Drilling fluids - Year-over-year growth 2025-2030 (%)

9.5 Water treatment - Market size and forecast 2025-2030

Chart on Water treatment - Market size and forecast 2025-2030 ($ million)
Data Table on Water treatment - Market size and forecast 2025-2030 ($ million)
Chart on Water treatment - Year-over-year growth 2025-2030 (%)
Data Table on Water treatment - Year-over-year growth 2025-2030 (%)

9.6 Agriculture - Market size and forecast 2025-2030

Chart on Agriculture - Market size and forecast 2025-2030 ($ million)
Data Table on Agriculture - Market size and forecast 2025-2030 ($ million)
Chart on Agriculture - Year-over-year growth 2025-2030 (%)
Data Table on Agriculture - Year-over-year growth 2025-2030 (%)

9.7 Others - Market size and forecast 2025-2030

Chart on Others - Market size and forecast 2025-2030 ($ million)
Data Table on Others - Market size and forecast 2025-2030 ($ million)
Chart on Others - Year-over-year growth 2025-2030 (%)
Data Table on Others - Year-over-year growth 2025-2030 (%)

9.8 Market opportunity by Application

Market opportunity by Application ($ million)
Data Table on Market opportunity by Application ($ million)

10. Market Segmentation by Grade Type

10.1 Market segments

Chart on Grade Type - Market share 2025-2030 (%)
Data Table on Grade Type - Market share 2025-2030 (%)

10.2 Comparison by Grade Type

Chart on Comparison by Grade Type
Data Table on Comparison by Grade Type

10.3 Technical grade - Market size and forecast 2025-2030

Chart on Technical grade - Market size and forecast 2025-2030 ($ million)
Data Table on Technical grade - Market size and forecast 2025-2030 ($ million)
Chart on Technical grade - Year-over-year growth 2025-2030 (%)
Data Table on Technical grade - Year-over-year growth 2025-2030 (%)

10.4 Standard grade - Market size and forecast 2025-2030

Chart on Standard grade - Market size and forecast 2025-2030 ($ million)
Data Table on Standard grade - Market size and forecast 2025-2030 ($ million)
Chart on Standard grade - Year-over-year growth 2025-2030 (%)
Data Table on Standard grade - Year-over-year growth 2025-2030 (%)

10.5 High-purity grade - Market size and forecast 2025-2030

Chart on High-purity grade - Market size and forecast 2025-2030 ($ million)
Data Table on High-purity grade - Market size and forecast 2025-2030 ($ million)
Chart on High-purity grade - Year-over-year growth 2025-2030 (%)
Data Table on High-purity grade - Year-over-year growth 2025-2030 (%)

10.6 Market opportunity by Grade Type

Market opportunity by Grade Type ($ million)
Data Table on Market opportunity by Grade Type ($ million)

11. Customer Landscape

11.1 Customer landscape overview

Analysis of price sensitivity, lifecycle, customer purchase basket, adoption rates, and purchase criteria

12. Geographic Landscape

12.1 Geographic segmentation

Chart on Market share by geography 2025-2030 (%)
Data Table on Market share by geography 2025-2030 (%)

12.2 Geographic comparison

Chart on Geographic comparison
Data Table on Geographic comparison

12.3 APAC - Market size and forecast 2025-2030

Chart on APAC - Market size and forecast 2025-2030 ($ million)
Data Table on APAC - Market size and forecast 2025-2030 ($ million)
Chart on APAC - Year-over-year growth 2025-2030 (%)
Data Table on APAC - Year-over-year growth 2025-2030 (%)
Chart on Regional Comparison - APAC
Data Table on Regional Comparison - APAC

12.3.1 China - Market size and forecast 2025-2030

Chart on China - Market size and forecast 2025-2030 ($ million)
Data Table on China - Market size and forecast 2025-2030 ($ million)
Chart on China - Year-over-year growth 2025-2030 (%)
Data Table on China - Year-over-year growth 2025-2030 (%)

12.3.2 India - Market size and forecast 2025-2030

Chart on India - Market size and forecast 2025-2030 ($ million)
Data Table on India - Market size and forecast 2025-2030 ($ million)
Chart on India - Year-over-year growth 2025-2030 (%)
Data Table on India - Year-over-year growth 2025-2030 (%)

12.3.3 Japan - Market size and forecast 2025-2030

Chart on Japan - Market size and forecast 2025-2030 ($ million)
Data Table on Japan - Market size and forecast 2025-2030 ($ million)
Chart on Japan - Year-over-year growth 2025-2030 (%)
Data Table on Japan - Year-over-year growth 2025-2030 (%)

12.3.4 South Korea - Market size and forecast 2025-2030

Chart on South Korea - Market size and forecast 2025-2030 ($ million)
Data Table on South Korea - Market size and forecast 2025-2030 ($ million)
Chart on South Korea - Year-over-year growth 2025-2030 (%)
Data Table on South Korea - Year-over-year growth 2025-2030 (%)

12.3.5 Australia - Market size and forecast 2025-2030

Chart on Australia - Market size and forecast 2025-2030 ($ million)
Data Table on Australia - Market size and forecast 2025-2030 ($ million)
Chart on Australia - Year-over-year growth 2025-2030 (%)
Data Table on Australia - Year-over-year growth 2025-2030 (%)

12.3.6 Indonesia - Market size and forecast 2025-2030

Chart on Indonesia - Market size and forecast 2025-2030 ($ million)
Data Table on Indonesia - Market size and forecast 2025-2030 ($ million)
Chart on Indonesia - Year-over-year growth 2025-2030 (%)
Data Table on Indonesia - Year-over-year growth 2025-2030 (%)

12.4 Middle East and Africa - Market size and forecast 2025-2030

Chart on Middle East and Africa - Market size and forecast 2025-2030 ($ million)
Data Table on Middle East and Africa - Market size and forecast 2025-2030 ($ million)
Chart on Middle East and Africa - Year-over-year growth 2025-2030 (%)
Data Table on Middle East and Africa - Year-over-year growth 2025-2030 (%)
Chart on Regional Comparison - Middle East and Africa
Data Table on Regional Comparison - Middle East and Africa

12.4.1 Israel - Market size and forecast 2025-2030

Chart on Israel - Market size and forecast 2025-2030 ($ million)
Data Table on Israel - Market size and forecast 2025-2030 ($ million)
Chart on Israel - Year-over-year growth 2025-2030 (%)
Data Table on Israel - Year-over-year growth 2025-2030 (%)

12.4.2 Jordan - Market size and forecast 2025-2030

Chart on Jordan - Market size and forecast 2025-2030 ($ million)
Data Table on Jordan - Market size and forecast 2025-2030 ($ million)
Chart on Jordan - Year-over-year growth 2025-2030 (%)
Data Table on Jordan - Year-over-year growth 2025-2030 (%)

12.4.3 UAE - Market size and forecast 2025-2030

Chart on UAE - Market size and forecast 2025-2030 ($ million)
Data Table on UAE - Market size and forecast 2025-2030 ($ million)
Chart on UAE - Year-over-year growth 2025-2030 (%)
Data Table on UAE - Year-over-year growth 2025-2030 (%)

12.4.4 Saudi Arabia - Market size and forecast 2025-2030

Chart on Saudi Arabia - Market size and forecast 2025-2030 ($ million)
Data Table on Saudi Arabia - Market size and forecast 2025-2030 ($ million)
Chart on Saudi Arabia - Year-over-year growth 2025-2030 (%)
Data Table on Saudi Arabia - Year-over-year growth 2025-2030 (%)

12.4.5 South Africa - Market size and forecast 2025-2030

Chart on South Africa - Market size and forecast 2025-2030 ($ million)
Data Table on South Africa - Market size and forecast 2025-2030 ($ million)
Chart on South Africa - Year-over-year growth 2025-2030 (%)
Data Table on South Africa - Year-over-year growth 2025-2030 (%)

12.5 Europe - Market size and forecast 2025-2030

Chart on Europe - Market size and forecast 2025-2030 ($ million)
Data Table on Europe - Market size and forecast 2025-2030 ($ million)
Chart on Europe - Year-over-year growth 2025-2030 (%)
Data Table on Europe - Year-over-year growth 2025-2030 (%)
Chart on Regional Comparison - Europe
Data Table on Regional Comparison - Europe

12.5.1 Germany - Market size and forecast 2025-2030

Chart on Germany - Market size and forecast 2025-2030 ($ million)
Data Table on Germany - Market size and forecast 2025-2030 ($ million)
Chart on Germany - Year-over-year growth 2025-2030 (%)
Data Table on Germany - Year-over-year growth 2025-2030 (%)

12.5.2 France - Market size and forecast 2025-2030

Chart on France - Market size and forecast 2025-2030 ($ million)
Data Table on France - Market size and forecast 2025-2030 ($ million)
Chart on France - Year-over-year growth 2025-2030 (%)
Data Table on France - Year-over-year growth 2025-2030 (%)

12.5.3 UK - Market size and forecast 2025-2030

Chart on UK - Market size and forecast 2025-2030 ($ million)
Data Table on UK - Market size and forecast 2025-2030 ($ million)
Chart on UK - Year-over-year growth 2025-2030 (%)
Data Table on UK - Year-over-year growth 2025-2030 (%)

12.5.4 Italy - Market size and forecast 2025-2030

Chart on Italy - Market size and forecast 2025-2030 ($ million)
Data Table on Italy - Market size and forecast 2025-2030 ($ million)
Chart on Italy - Year-over-year growth 2025-2030 (%)
Data Table on Italy - Year-over-year growth 2025-2030 (%)

12.5.5 Spain - Market size and forecast 2025-2030

Chart on Spain - Market size and forecast 2025-2030 ($ million)
Data Table on Spain - Market size and forecast 2025-2030 ($ million)
Chart on Spain - Year-over-year growth 2025-2030 (%)
Data Table on Spain - Year-over-year growth 2025-2030 (%)

12.5.6 The Netherlands - Market size and forecast 2025-2030

Chart on The Netherlands - Market size and forecast 2025-2030 ($ million)
Data Table on The Netherlands - Market size and forecast 2025-2030 ($ million)
Chart on The Netherlands - Year-over-year growth 2025-2030 (%)
Data Table on The Netherlands - Year-over-year growth 2025-2030 (%)

12.6 North America - Market size and forecast 2025-2030

Chart on North America - Market size and forecast 2025-2030 ($ million)
Data Table on North America - Market size and forecast 2025-2030 ($ million)
Chart on North America - Year-over-year growth 2025-2030 (%)
Data Table on North America - Year-over-year growth 2025-2030 (%)
Chart on Regional Comparison - North America
Data Table on Regional Comparison - North America

12.6.1 US - Market size and forecast 2025-2030

Chart on US - Market size and forecast 2025-2030 ($ million)
Data Table on US - Market size and forecast 2025-2030 ($ million)
Chart on US - Year-over-year growth 2025-2030 (%)
Data Table on US - Year-over-year growth 2025-2030 (%)

12.6.2 Canada - Market size and forecast 2025-2030

Chart on Canada - Market size and forecast 2025-2030 ($ million)
Data Table on Canada - Market size and forecast 2025-2030 ($ million)
Chart on Canada - Year-over-year growth 2025-2030 (%)
Data Table on Canada - Year-over-year growth 2025-2030 (%)

12.6.3 Mexico - Market size and forecast 2025-2030

Chart on Mexico - Market size and forecast 2025-2030 ($ million)
Data Table on Mexico - Market size and forecast 2025-2030 ($ million)
Chart on Mexico - Year-over-year growth 2025-2030 (%)
Data Table on Mexico - Year-over-year growth 2025-2030 (%)

12.7 South America - Market size and forecast 2025-2030

Chart on South America - Market size and forecast 2025-2030 ($ million)
Data Table on South America - Market size and forecast 2025-2030 ($ million)
Chart on South America - Year-over-year growth 2025-2030 (%)
Data Table on South America - Year-over-year growth 2025-2030 (%)
Chart on Regional Comparison - South America
Data Table on Regional Comparison - South America

12.7.1 Brazil - Market size and forecast 2025-2030

Chart on Brazil - Market size and forecast 2025-2030 ($ million)
Data Table on Brazil - Market size and forecast 2025-2030 ($ million)
Chart on Brazil - Year-over-year growth 2025-2030 (%)
Data Table on Brazil - Year-over-year growth 2025-2030 (%)

12.7.2 Argentina - Market size and forecast 2025-2030

Chart on Argentina - Market size and forecast 2025-2030 ($ million)
Data Table on Argentina - Market size and forecast 2025-2030 ($ million)
Chart on Argentina - Year-over-year growth 2025-2030 (%)
Data Table on Argentina - Year-over-year growth 2025-2030 (%)

12.7.3 Chile - Market size and forecast 2025-2030

Chart on Chile - Market size and forecast 2025-2030 ($ million)
Data Table on Chile - Market size and forecast 2025-2030 ($ million)
Chart on Chile - Year-over-year growth 2025-2030 (%)
Data Table on Chile - Year-over-year growth 2025-2030 (%)

12.8 Market opportunity by geography

Market opportunity by geography ($ million)
Data Tables on Market opportunity by geography ($ million)

13. Drivers, Challenges, and Opportunity

13.1 Market drivers

Growth of oil and gas industry
Increased demand for flame retardants
Rise in demand of bromine from developing economies

13.2 Market challenges

Fluctuation in prices of crude oil
Increased demand for non-halogenated flame retardants
Regulatory challenges impacting global bromine market

13.3 Impact of drivers and challenges

Impact of drivers and challenges in 2025 and 2030

13.4 Market opportunities

Rising mercury emission control
Expansion of seawater brine extraction technologies
Rise in demand for electric vehicles (EVs)

14. Competitive Landscape

14.1 Overview

14.2

Overview on criticality of inputs and factors of differentiation

14.3 Landscape disruption

Overview on factors of disruption

14.4 Industry risks

Impact of key risks on business

15. Competitive Analysis

15.1 Companies profiled

Companies covered

15.2 Company ranking index

15.3 Market positioning of companies

Matrix on companies position and classification

15.4 Agrocel Industries Pvt. Ltd.

Agrocel Industries Pvt. Ltd. - Overview
Agrocel Industries Pvt. Ltd. - Product / Service
Agrocel Industries Pvt. Ltd. - Key offerings
SWOT

15.5 Albemarle Corp.

Albemarle Corp. - Overview
Albemarle Corp. - Business segments
Albemarle Corp. - Key news
Albemarle Corp. - Key offerings
Albemarle Corp. - Segment focus
SWOT

15.6 Archean Chemical Industries

Archean Chemical Industries - Overview
Archean Chemical Industries - Product / Service
Archean Chemical Industries - Key offerings
SWOT

15.7 Dhruv Chem Industries

Dhruv Chem Industries - Overview
Dhruv Chem Industries - Product / Service
Dhruv Chem Industries - Key offerings
SWOT

15.8 Gulf Resources Inc.

Gulf Resources Inc. - Overview
Gulf Resources Inc. - Product / Service
Gulf Resources Inc. - Key offerings
SWOT

15.9 Honeywell International Inc.

Honeywell International Inc. - Overview
Honeywell International Inc. - Business segments
Honeywell International Inc. - Key news
Honeywell International Inc. - Key offerings
Honeywell International Inc. - Segment focus
SWOT

15.10 Israel Chemicals Ltd.

Israel Chemicals Ltd. - Overview
Israel Chemicals Ltd. - Business segments
Israel Chemicals Ltd. - Key offerings
Israel Chemicals Ltd. - Segment focus
SWOT

15.11 Lanxess AG

Lanxess AG - Overview
Lanxess AG - Business segments
Lanxess AG - Key news
Lanxess AG - Key offerings
Lanxess AG - Segment focus
SWOT

15.12 Mody Chemi Pharma Ltd.

Mody Chemi Pharma Ltd. - Overview
Mody Chemi Pharma Ltd. - Product / Service
Mody Chemi Pharma Ltd. - Key offerings
SWOT

15.13 Morre Tec Industries Inc.

Morre Tec Industries Inc. - Overview
Morre Tec Industries Inc. - Product / Service
Morre Tec Industries Inc. - Key offerings
SWOT

15.14 Pacific Organics Pvt. Ltd.

Pacific Organics Pvt. Ltd. - Overview
Pacific Organics Pvt. Ltd. - Product / Service
Pacific Organics Pvt. Ltd. - Key offerings
SWOT

15.15 Solaris Chemtech

Solaris Chemtech - Overview
Solaris Chemtech - Product / Service
Solaris Chemtech - Key offerings
SWOT

15.16 Tata Chemicals Ltd.

Tata Chemicals Ltd. - Overview
Tata Chemicals Ltd. - Business segments
Tata Chemicals Ltd. - Key offerings
Tata Chemicals Ltd. - Segment focus
SWOT

15.17 Tosoh Corp.

Tosoh Corp. - Overview
Tosoh Corp. - Business segments
Tosoh Corp. - Key offerings
Tosoh Corp. - Segment focus
SWOT

15.18 Yogi Intermediates Pvt. Ltd.

Yogi Intermediates Pvt. Ltd. - Overview
Yogi Intermediates Pvt. Ltd. - Product / Service
Yogi Intermediates Pvt. Ltd. - Key offerings
SWOT

16. Appendix

16.1 Scope of the report

Market definition
Objectives
Notes and caveats

16.2 Inclusions and exclusions checklist

Inclusions checklist
Exclusions checklist

16.3 Currency conversion rates for US$

16.4 Research methodology

16.5 Data procurement

Information sources

16.6 Data validation

16.7 Validation techniques employed for market sizing

16.8 Data synthesis

16.9 360 degree market analysis

16.10 List of abbreviations

Research Methodology

Technavio presents a detailed picture of the market by way of study, synthesis, and summation of data from multiple sources. The analysts have presented the various facets of the market with a particular focus on identifying the key industry influencers. The data thus presented is comprehensive, reliable, and the result of extensive research, both primary and secondary.

INFORMATION SOURCES

Primary sources

  • Manufacturers and suppliers
  • Channel partners
  • Industry experts
  • Strategic decision makers

Secondary sources

  • Industry journals and periodicals
  • Government data
  • Financial reports of key industry players
  • Historical data
  • Press releases

DATA ANALYSIS

Data Synthesis

  • Collation of data
  • Estimation of key figures
  • Analysis of derived insights

Data Validation

  • Triangulation with data models
  • Reference against proprietary databases
  • Corroboration with industry experts

REPORT WRITING

Qualitative

  • Market drivers
  • Market challenges
  • Market trends
  • Five forces analysis

Quantitative

  • Market size and forecast
  • Market segmentation
  • Geographical insights
  • Competitive landscape

Interested in this report?

Get your sample now to see our research methodology and insights!

Download Now

Frequently Asked Questions

Bromine market growth will increase by USD 920.6 million during 2026-2030 .

The Bromine market is expected to grow at a CAGR of 3.5% during 2026-2030 .

Bromine market is segmented by Derivative type (Hydrogen bromide, Organobromine compounds, Bromine fluids, Others) Application (Flame retardants, Drilling fluids, Water treatment, Agriculture, Others) Grade type (Technical grade, Standard grade, High-purity grade)

Agrocel Industries Pvt. Ltd., Albemarle Corp., Archean Chemical Industries, BEACON ORGANOSYS, Dhruv Chem Industries, Gulf Resources Inc., Honeywell International Inc., Israel Chemicals Ltd., Lanxess AG, Mody Chemi Pharma Ltd., Morre Tec Industries Inc., Pacific Organics Pvt. Ltd., Sahayamatha Salterns Pvt. Ltd, Sangfroid Chemicals Pvt. Ltd., Solaris Chemtech, Tata Chemicals Ltd., Tosoh Corp., Yogi Intermediates Pvt. Ltd. are a few of the key vendors in the Bromine market.

APAC will register the highest growth rate of 38.2% among the other regions. Therefore, the Bromine market in APAC is expected to garner significant business opportunities for the vendors during the forecast period.

China, India, Japan, South Korea, Australia, Indonesia, Israel, Jordan, UAE, Saudi Arabia, South Africa, Germany, France, UK, Italy, Spain, The Netherlands, US, Canada, Mexico, Brazil, Argentina, Chile

  • Growth of oil and gas industry is the driving factor this market.

The Bromine market vendors should focus on grabbing business opportunities from the Derivative type segment as it accounted for the largest market share in the base year.