Computer-Aided Design (CAD) Market in the Civil and Construction Industry Analysis North America, Europe, APAC, South America, Middle East and Africa - US, China, Japan, Germany, UK - Size and Forecast 2024-2028

Computer-Aided Design (CAD) Market in the Civil and Construction Industry Analysis North America, Europe, APAC, South America, Middle East and Africa - US, China, Japan, Germany, UK - Size and Forecast 2024-2028

Published: Nov 2023 178 Pages SKU: IRTNTR73228

Market Overview at a Glance

$1.37 B
Market Opportunity
6.78%
CAGR
6.28
YoY growth 2023-2024(%)

Computer-Aided Design Market in the Civil and Construction Industry Size 2024-2028

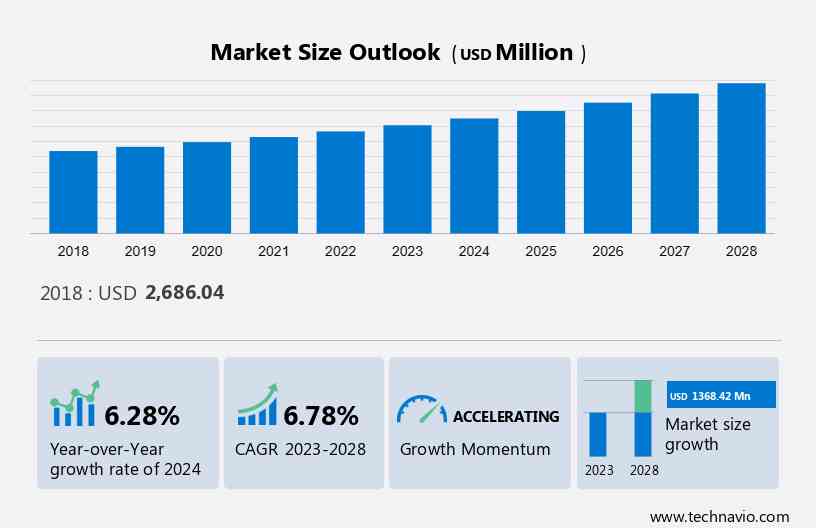
The Computer-Aided Design Market in the Civil and Construction Industry size is estimated to grow by USD 1.36 billion, at a CAGR of 6.78% between 2023 and 2028. The growth of the market depends on several factors including the growing need to automate the design development processes, the growth of the global construction industry and the increasing need for a reduction in design time. CAD software in the civil and construction industry is designed for contractors, builders, engineers, and architects to design their projects. This kind of software serves as a tool for designing mechanical designs and their documentation. This type of software is a tool that is used to design mechanical design and documentation. It is an alternative method for manual drafting and an automated method of mechanical designing or structural design.

The research report on the CAD market in the civil and construction industry offers industry forecasts and segmentation based on component including software and services. It also segments the market by product, which comprises both 3D design and 2D design. Geographically, the report covers North America, Europe, APAC, South America, and the Middle East and Africa. The market size, historical data (2018-2022), and future forecasts are presented in terms of value (in USD billion) for all these mentioned segments.

CAD Market in the Civil and Construction Industry Size

For More Highlights About this Report, Download Free Sample in a Minute 

Market Dynamics

The market in the civil and construction industry is witnessing a transformative shift with the integration of advanced design tools and electronic design automation (EDA). Computer aided design (CAD) solutions, especially cloud-based offerings, are becoming indispensable for architects, engineers, and designers. These tools leverage smart design technologies, augmented reality (AR), and virtual reality (VR) to enhance the design review process and visualize complex models in 3D settings. CAD software's adaptability supports diverse applications in product layouts, conceptual design, and assembly processes, optimizing manufacturing and development processes. Furthermore, CAD solutions play a crucial role in generating environment-based impact reports, essential for assessing sustainability in construction projects. As IoT and 2D functionalities continue to evolve, CAD remains a valuable asset in streamlining workflows and improving efficiency across the industry.

Key Market Driver

The growth of the global construction industry is notably driving the market growth. The global construction industry has experienced drastic changes in the past decade. Developed economies such as the US and the UK are currently facing the problem of ageing infrastructure. Maintenance and restoration operations, along with a shift to sustainable building development and retrofitting practices, are driving the growth of the construction market in these countries. Moreover, green and sustainable building developments have garnered significant investments and technological innovations. The overall development of the world economy is supporting the growth of the global construction industry. Governments of various countries like India, Saudi Arabia, and Qatar are investing heavily in the development of smart cities.

However, smart cities provide better transportation facilities, smart grids, improved healthcare facilities, advanced technologies, and enhanced traffic management systems. For example, the Government of Saudi Arabia is planning to invest in the development of King Abdullah Economic City (smart city), for which the total project cost is estimated to be USD 90 billion. Thus, the increasing investments in the construction industry will drive the growth of the market during the forecast period. 

Significant Market Trends

Shift from a perpetual license model to a subscription model is an emerging trend shaping the market growth. The market in the civil and construction industry is moving from perpetual CAD licenses to periodic CAD subscriptions/licenses. The high ROI on subscriptions will encourage CAD vendors to gradually reduce the sale of perpetual CAD licenses before finally discarding them. The benefits of the subscription model over the perpetual license model are the key reason for the shift. The subscription model is simple and provides a better user experience to customers. Vendors can provide updated software versions with bug patches. In addition, the upfront cost is also low in this model. On-premises CAD software and services could be subscribed based on terms decided by the user. This flexibility, coupled with up-to-date software, has made the subscription model a preferred option among end-users.

In addition, autodesk decided to stop providing perpetual CAD licenses for all its product suites in 2016. It will focus on periodical subscriptions to boost revenue from end-users. This transition offers benefits such as lower upfront costs, increased flexibility, and access to the latest updates and features, which will increase the adoption of CAD solutions in the civil and construction industry and, in turn, will propel the growth of the market during the forecast period.

Major Market Restrain

Resistance to adopting new technology is a significant challenge hindering market growth. The construction sector is facing challenges in adopting modern technologies. Many project teams are reluctant to adopt new technologies, and most construction firms use 2D drawings and CAD software. However, with the emergence of technology, firms are facing difficulties in transitioning from traditional applications to advanced CAD solutions, including 3D and 4D design technology. The emergence of new technologies brings an increased level of responsibility, and companies must remain updated to adopt these new technologies. The resistance among construction firms to shift to a new version of software poses a major challenge to this market. CAD software solutions involve advanced features, more functionalities, and compatible features.

However, since these are complex solutions, proper technical training is needed for their optimal utilization in any organization. Professionals also need adequate training to implement any upgrades in the existing system. The training and product costs of these solutions are very high. This often discourages companies from investing in CAD and compels them to opt for counterfeit or open-source CAD software instead. Such factors will hamper the growth of the market during the forecast period.

Market Segmentation

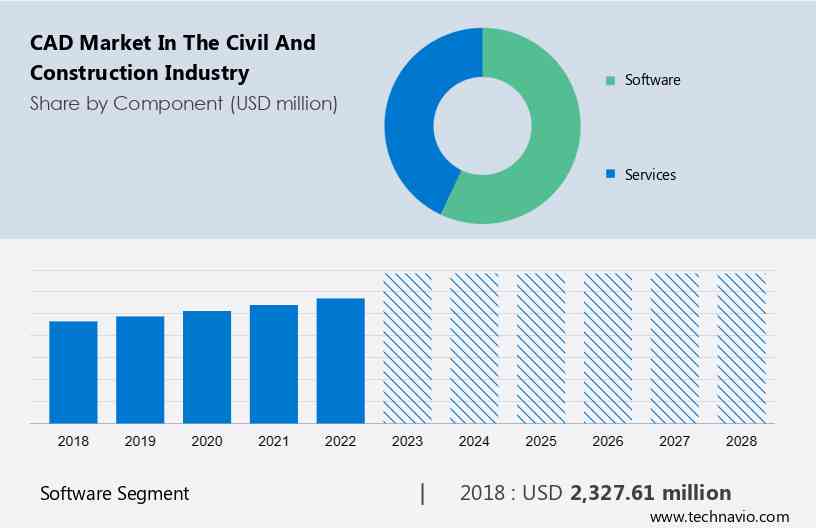
By Component Segment

The market share growth by the software segment will be significant during the market growth and forecasting period. The software segment accounts for the majority of the computer-aided design (CAD) market in the civil and construction industry in 2023, owing to the increasing adoption of CAD software by civil and construction companies such as Bouygues, Larsen & Toubro, among others, to improve their design and construction processes. 

CAD Market in the Civil and Construction Industry Size

Get a glance at the market contribution of various segments Download the PDF Sample

The software segment was the largest and was valued at USD 2.33 billion in 2018. Moreover, companies in the market are offering innovative CAD software solutions to increase their share in the CAD market in the civil and construction industry in the civil and construction industry. For instance, Autodesk is a leading provider of CAD software for the civil and construction industry. Autodesk offers a wide range of CAD software products, such as AutoCAD Civil 3D, Revit, and InfraWorks. Similarly, Dassault Systemes is another leading provider of CAD software for the civil and construction industry. Dassault Systemes offers a wide range of CAD software products, such as CATIA, SIMULIA, and DELMIA. These software products are used by civil and construction companies to design and construct a wide range of infrastructure projects, such as roads, bridges, airports, and buildings. Thus, increasing adoption of CAD software solutions will drive the growth of the CAD market in the civil and construction industry in the software segment during the market research and growth period.  

By Product 

3D CAD software solutions standardize the construction process by enabling the simplified and streamlined management of labour, site events, data capture, information, and material costs. With the deployment of this software, engineers and architects will see a rise in the profitability and efficiency of their projects. Complex structures, frames, forms, and fabrication details of materials have been made easier by the array of 3D models that can be made by the 3D CAD software. Moreover, the increasing demand for advanced and precise design capabilities in construction projects, which allows for better visualization and simulation of structures, the adoption of BIM practices in the construction industry, which rely heavily on 3D design software for integration and collaboration among stakeholders, and the benefits of 3D design in reducing errors, improving construction efficiency, and optimizing resources utilization will spur the growth of the 3D design segment of the global CAD market in the civil and construction industry during the market forecasting period.

Regional Overview

CAD Market in the Civil and Construction Industry Share by Geography

For more insights on the market share of various regions Download PDF Sample now!

Europe is estimated to contribute 34% to the growth of the global market during the market forecast period. Technavio’s analysts have elaborately explained the regional trends and drivers that shape the market during the forecast period. North America has always been a lucrative market for vendors as the region is an early adopter of advanced technologies across all the end-users of CAD software in the civil and construction industry. The construction industry in the Americas is technologically mature owing to the early adoption of technologies. The strong existence and penetration of the top vendors raise the overall CAD market in the civil and construction industry growth in the region. The region has some of the most advanced and developed economies in the world, which boosts the rate of infrastructure development in North America. CAD software plays an integral role in simplifying the flow of information technology and services with real-time tracking to monitor building and construction development. Moreover, the benefits of using CAD software are increasing its demand from the manufacturing-intensive industries in North America.

As a result, it is expected that the growth momentum of the computer-aided design (CAD) market in the civil and construction industry in North America will accelerate slightly during the forecast period. American companies have started investing in manufacturing automation technologies such as 3D printing and robot-assisted production. These automation technologies use the data output from CAD systems, which are an integral part of the designing and execution activities in the manufacturing industries. Such factors will drive the growth of the regional market during the market growth analysis period.

Key Market Customer Landscape

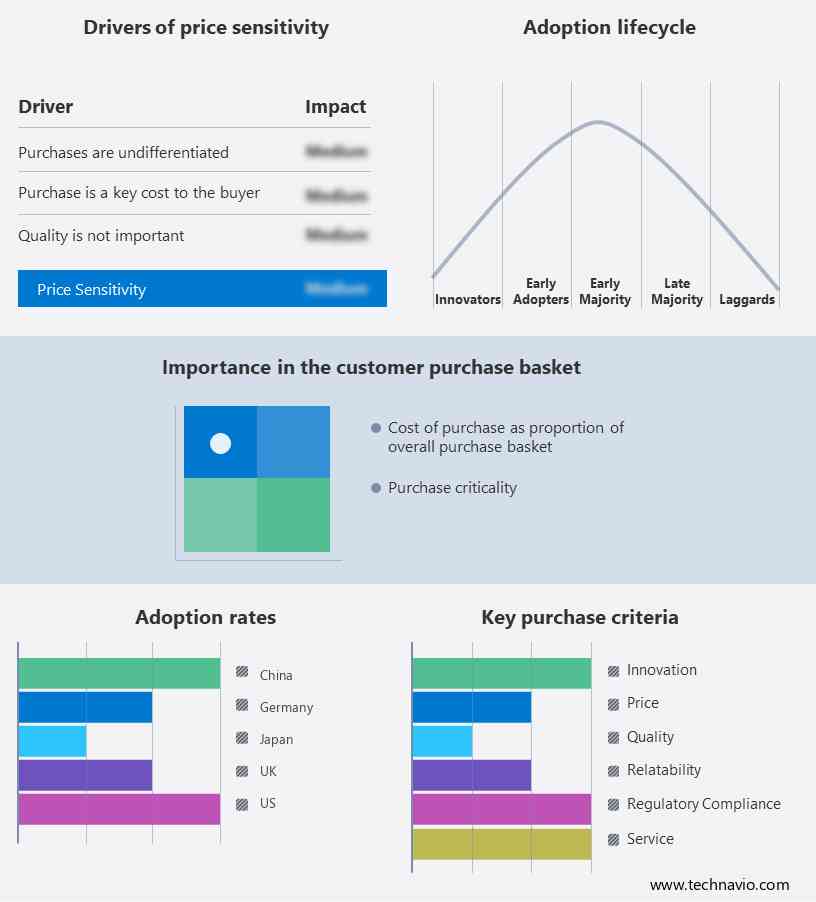
The CAD Market in the Civil and Construction Industry report includes the adoption lifecycle of the market, covering from the innovator’s stage to the laggard’s stage. It focuses on adoption rates in different regions based on penetration. Furthermore, the report also includes key purchase criteria and drivers of price sensitivity to help companies evaluate and develop their growth strategies.

CAD Market in the Civil and Construction Industry Share by Geography

Global CAD Market in the Civil and Construction Industry Customer Landscape

Who are the Major CAD Market in the Civil and Construction Industry Companies?

Companies are implementing various strategies, such as strategic alliances, partnerships, mergers and acquisitions, geographical expansion, and product/service launches, to enhance their presence in the market.

Alibre LLC - The company offers CAD software with customizable UI, precise sketching, robust modelling and realtime CPU driven rendering.

Autodesk Inc. - The company offers CAD software under the brand name AutoCad, to create high quality designs, optimize projects and improve predictability in field to maximize constructability and coordination.

Bentley Systems Inc. - The company offers CAD software for 3D modeling, design, and analysis applications for transportation, land development, water, and civil projects.

The research report also includes detailed analyses of the competitive landscape of the market and information about 20 market companies, including:

  • CAD International
  • Caddie Ltd.
  • Corel Corp.
  • Dassault Systemes SE
  • DATACAD LLC
  • ESI Group SA
  • Gstarsoft Co. Ltd.
  • Hexagon AB
  • IMSI Design LLC
  • Nanosoft AS
  • Nemetschek SE
  • PTC Inc.
  • Schneider Electric SE
  • Siemens AG
  • SmartDraw Software LLC
  • Trimble Inc.
  • ZWSOFT CO. LTD.

Qualitative and quantitative analysis of companies has been conducted to help clients understand the wider business environment as well as the strengths and weaknesses of key market players. Data is qualitatively analyzed to categorize companies as pure play, category-focused, industry-focused, and diversified; it is quantitatively analyzed to categorize companies as dominant, leading, strong, tentative, and weak.

Segment Overview

The market report provides comprehensive data (region wise segment analysis), with forecasts and estimates in "USD Billion" for the period 2024 to 2028, as well as historical data from 2018 to 2022 for the following segments

  • Component Outlook
    • Software
    • Services
  • Product Outlook
    • 3D design
    • 2D design
  • Region Outlook
    • North America
      • The U.S.
      • Canada
    • South America
      • Chile 
      • Brazil
      • Argentina 
    • Europe
      • The U.K.
      • Germany
      • France
      • Rest of Europe
    • APAC
      • China
      • India
    • Middle East & Africa
      • Saudi Arabia
      • South Africa
      • Rest of the Middle East & Africa

You may also be interested in:

  • 3D Computer Aided Design (CAD) Software Market - 3D Computer Aided Design (CAD) Software Market Analysis North America, APAC, Europe, South America, Middle East and Africa - US, China, Japan, Germany, UK - Size and Forecast
  • Computer Integrated Manufacturing Market - Computer Integrated Manufacturing Market Analysis North America, Europe, APAC, Middle East and Africa, South America - US, China, Japan, Germany, UK - Size and Forecast 
  • Computer Aided Engineering (CAE) Market - Computer Aided Engineering (CAE) Market Analysis Europe, North America, APAC, South America, Middle East and Africa - US, Germany, China, France, Japan - Size and Forecast 

Market Analyst Overview

The market continues to evolve with advancements in cloud-based solutions, integrating AR and VR elements that enhance the design process across various industries. These technologies are becoming valuable assets, offering adaptability in CAD software to cater to diverse needs from automotive to aerospace and defense sectors. Cloud based CAD solutions provide flexibility compared to on-premises options, addressing environmental concerns and optimizing hardware specifications and software updates. CAD supports surface modeling, reverse engineering, and drafting detailing, crucial for vehicle propulsion, including electric vehicles. It plays a pivotal role in end-use verticals like electrical and electronics, industrial equipment, and media and entertainment, replacing traditional manual drafting methods. As IoT and BIM influence design types, CAD remains integral in shaping 3D segments and supporting complex models crucial for manufacturing and development processes in today's competitive landscape.

Also, Computer-Aided Design (CAD) is pivotal in modern engineering and design processes, with both cloud-based and on-premises solutions offering significant advantages. Cloud-based CAD solutions are increasingly preferred for their scalability and accessibility, overcoming the limitations of on-premises software. This adaptability of CAD software caters to diverse needs across various industries, enhancing efficiency in surface modeling, design reviews, and utilizing advanced design tools, electronic design automation (EDA), and smart technologies like augmented reality (AR) and virtual reality (VR). These AR and VR elements revolutionize the design review process, allowing for immersive 3D settings that streamline manufacturing and development processes. CAD's role extends to building information management, robotics, and IoT integration, supporting environmental impact assessments and optimizing energy and materials usage in end-use verticals. As technology evolves, CAD remains integral in shaping design types and operating systems, driving innovation in the 3D segment of engineering and beyond.

CAD Market In The Civil And Construction Industry Scope

Report Coverage

Details

Page number

178

Base year

2023

Historic period

2018-2022

Forecast period

2024-2028

Growth momentum & CAGR

Accelerate at a CAGR of 6.78%

Market Growth 2024-2028

USD 1.36 billion

Market structure

Fragmented

YoY growth 2023-2024(%)

6.28

Regional analysis

North America, Europe, APAC, South America, and Middle East and Africa

Performing market contribution

Europe at 34%

Key countries

US, China, Japan, Germany, and UK

Competitive landscape

Leading Companies, Market Positioning of Companies, Competitive Strategies, and Industry Risks

Key companies profiled

Alibre LLC, Autodesk Inc., Bentley Systems Inc., CAD International, Caddie Ltd., Corel Corp., Dassault Systemes SE, DATACAD LLC, ESI Group SA, Gstarsoft Co. Ltd., Hexagon AB, IMSI Design LLC, Nanosoft AS, Nemetschek SE, PTC Inc., Schneider Electric SE, Siemens AG, SmartDraw Software LLC, Trimble Inc., and ZWSOFT CO. LTD.

Market dynamics

Parent market analysis, Market growth inducers and obstacles, Fast-growing and slow-growing segment analysis, COVID-19 impact and recovery analysis and future consumer dynamics, Market condition analysis for the forecast period. 

Customization purview

If our report has not included the data that you are looking for, you can reach out to our analysts and get segments customized.

Download PDF Sample

What are the Key Data Covered in this CAD Market In The Civil And Construction Industry Research Report?

  • CAGR of the market during the forecast period
  • Detailed information on factors that will drive the growth of the market between 2024 and 2028
  • Precise estimation of the market  size and its contribution to the market in focus on the parent market
  • Accurate predictions about upcoming trends and changes in consumer behavior
  • Growth of the market  across North America, Europe, APAC, South America, and Middle East and Africa
  • A thorough analysis of the market’s competitive landscape and detailed information about companies
  • Comprehensive analysis of factors that will challenge the growth of market companies

We can help! Our analysts can customize this market research report to meet your requirements. 

Get in touch

1 Executive Summary

  • 1.1 Market overview
    • Exhibit 01: Executive Summary – Chart on Market Overview
    • Exhibit 02: Executive Summary – Data Table on Market Overview
    • Exhibit 03: Executive Summary – Chart on Global Market Characteristics
    • Exhibit 04: Executive Summary – Chart on Market by Geography
    • Exhibit 05: Executive Summary – Chart on Market Segmentation by Component
    • Exhibit 06: Executive Summary – Chart on Market Segmentation by Product
    • Exhibit 07: Executive Summary – Chart on Incremental Growth
    • Exhibit 08: Executive Summary – Data Table on Incremental Growth
    • Exhibit 09: Executive Summary – Chart on Vendor Market Positioning

2 Market Landscape

  • 2.1 Market ecosystem
    • Exhibit 10: Parent market
    • Exhibit 11: Market Characteristics

3 Market Sizing

  • 3.1 Market definition
    • Exhibit 12: Offerings of vendors included in the market definition
  • 3.2 Market segment analysis
    • Exhibit 13: Market segments
  • 3.3 Market size 2023
    • 3.4 Market outlook: Forecast for 2023-2028
      • Exhibit 14: Chart on Global - Market size and forecast 2023-2028 ($ million)
      • Exhibit 15: Data Table on Global - Market size and forecast 2023-2028 ($ million)
      • Exhibit 16: Chart on Global Market: Year-over-year growth 2023-2028 (%)
      • Exhibit 17: Data Table on Global Market: Year-over-year growth 2023-2028 (%)

    4 Historic Market Size

    • 4.1 Global CAD market in the civil and construction industry 2018 - 2022
      • Exhibit 18: Historic Market Size – Data Table on global cad market in the civil and construction industry 2018 - 2022 ($ million)
    • 4.2 Component Segment Analysis 2018 - 2022
      • Exhibit 19: Historic Market Size – Component Segment 2018 - 2022 ($ million)
    • 4.3 Product Segment Analysis 2018 - 2022
      • Exhibit 20: Historic Market Size – Product Segment 2018 - 2022 ($ million)
    • 4.4 Geography Segment Analysis 2018 - 2022
      • Exhibit 21: Historic Market Size – Geography Segment 2018 - 2022 ($ million)
    • 4.5 Country Segment Analysis 2018 - 2022
      • Exhibit 22: Historic Market Size – Country Segment 2018 - 2022 ($ million)

    5 Five Forces Analysis

    • 5.1 Five forces summary
      • Exhibit 23: Five forces analysis - Comparison between 2023 and 2028
    • 5.2 Bargaining power of buyers
      • Exhibit 24: Chart on Bargaining power of buyers – Impact of key factors 2023 and 2028
    • 5.3 Bargaining power of suppliers
      • Exhibit 25: Bargaining power of suppliers – Impact of key factors in 2023 and 2028
    • 5.4 Threat of new entrants
      • Exhibit 26: Threat of new entrants – Impact of key factors in 2023 and 2028
    • 5.5 Threat of substitutes
      • Exhibit 27: Threat of substitutes – Impact of key factors in 2023 and 2028
    • 5.6 Threat of rivalry
      • Exhibit 28: Threat of rivalry – Impact of key factors in 2023 and 2028
    • 5.7 Market condition
      • Exhibit 29: Chart on Market condition - Five forces 2023 and 2028

    6 Market Segmentation by Component

    • 6.1 Market segments
      • Exhibit 30: Chart on Component - Market share 2023-2028 (%)
      • Exhibit 31: Data Table on Component - Market share 2023-2028 (%)
    • 6.2 Comparison by Component
      • Exhibit 32: Chart on Comparison by Component
      • Exhibit 33: Data Table on Comparison by Component
    • 6.3 Software - Market size and forecast 2023-2028
      • Exhibit 34: Chart on Software - Market size and forecast 2023-2028 ($ million)
      • Exhibit 35: Data Table on Software - Market size and forecast 2023-2028 ($ million)
      • Exhibit 36: Chart on Software - Year-over-year growth 2023-2028 (%)
      • Exhibit 37: Data Table on Software - Year-over-year growth 2023-2028 (%)
    • 6.4 Services - Market size and forecast 2023-2028
      • Exhibit 38: Chart on Services - Market size and forecast 2023-2028 ($ million)
      • Exhibit 39: Data Table on Services - Market size and forecast 2023-2028 ($ million)
      • Exhibit 40: Chart on Services - Year-over-year growth 2023-2028 (%)
      • Exhibit 41: Data Table on Services - Year-over-year growth 2023-2028 (%)
    • 6.5 Market opportunity by Component
      • Exhibit 42: Market opportunity by Component ($ million)
      • Exhibit 43: Data Table on Market opportunity by Component ($ million)

    7 Market Segmentation by Product

    • 7.1 Market segments
      • Exhibit 44: Chart on Product - Market share 2023-2028 (%)
      • Exhibit 45: Data Table on Product - Market share 2023-2028 (%)
    • 7.2 Comparison by Product
      • Exhibit 46: Chart on Comparison by Product
      • Exhibit 47: Data Table on Comparison by Product
    • 7.3 3D design - Market size and forecast 2023-2028
      • Exhibit 48: Chart on 3D design - Market size and forecast 2023-2028 ($ million)
      • Exhibit 49: Data Table on 3D design - Market size and forecast 2023-2028 ($ million)
      • Exhibit 50: Chart on 3D design - Year-over-year growth 2023-2028 (%)
      • Exhibit 51: Data Table on 3D design - Year-over-year growth 2023-2028 (%)
    • 7.4 2D design - Market size and forecast 2023-2028
      • Exhibit 52: Chart on 2D design - Market size and forecast 2023-2028 ($ million)
      • Exhibit 53: Data Table on 2D design - Market size and forecast 2023-2028 ($ million)
      • Exhibit 54: Chart on 2D design - Year-over-year growth 2023-2028 (%)
      • Exhibit 55: Data Table on 2D design - Year-over-year growth 2023-2028 (%)
    • 7.5 Market opportunity by Product
      • Exhibit 56: Market opportunity by Product ($ million)
      • Exhibit 57: Data Table on Market opportunity by Product ($ million)

    8 Customer Landscape

    • 8.1 Customer landscape overview
      • Exhibit 58: Analysis of price sensitivity, lifecycle, customer purchase basket, adoption rates, and purchase criteria

    9 Geographic Landscape

    • 9.1 Geographic segmentation
      • Exhibit 59: Chart on Market share by geography 2023-2028 (%)
      • Exhibit 60: Data Table on Market share by geography 2023-2028 (%)
    • 9.2 Geographic comparison
      • Exhibit 61: Chart on Geographic comparison
      • Exhibit 62: Data Table on Geographic comparison
    • 9.3 North America - Market size and forecast 2023-2028
      • Exhibit 63: Chart on North America - Market size and forecast 2023-2028 ($ million)
      • Exhibit 64: Data Table on North America - Market size and forecast 2023-2028 ($ million)
      • Exhibit 65: Chart on North America - Year-over-year growth 2023-2028 (%)
      • Exhibit 66: Data Table on North America - Year-over-year growth 2023-2028 (%)
    • 9.4 Europe - Market size and forecast 2023-2028
      • Exhibit 67: Chart on Europe - Market size and forecast 2023-2028 ($ million)
      • Exhibit 68: Data Table on Europe - Market size and forecast 2023-2028 ($ million)
      • Exhibit 69: Chart on Europe - Year-over-year growth 2023-2028 (%)
      • Exhibit 70: Data Table on Europe - Year-over-year growth 2023-2028 (%)
    • 9.5 APAC - Market size and forecast 2023-2028
      • Exhibit 71: Chart on APAC - Market size and forecast 2023-2028 ($ million)
      • Exhibit 72: Data Table on APAC - Market size and forecast 2023-2028 ($ million)
      • Exhibit 73: Chart on APAC - Year-over-year growth 2023-2028 (%)
      • Exhibit 74: Data Table on APAC - Year-over-year growth 2023-2028 (%)
    • 9.6 South America - Market size and forecast 2023-2028
      • Exhibit 75: Chart on South America - Market size and forecast 2023-2028 ($ million)
      • Exhibit 76: Data Table on South America - Market size and forecast 2023-2028 ($ million)
      • Exhibit 77: Chart on South America - Year-over-year growth 2023-2028 (%)
      • Exhibit 78: Data Table on South America - Year-over-year growth 2023-2028 (%)
    • 9.7 Middle East and Africa - Market size and forecast 2023-2028
      • Exhibit 79: Chart on Middle East and Africa - Market size and forecast 2023-2028 ($ million)
      • Exhibit 80: Data Table on Middle East and Africa - Market size and forecast 2023-2028 ($ million)
      • Exhibit 81: Chart on Middle East and Africa - Year-over-year growth 2023-2028 (%)
      • Exhibit 82: Data Table on Middle East and Africa - Year-over-year growth 2023-2028 (%)
    • 9.8 US - Market size and forecast 2023-2028
      • Exhibit 83: Chart on US - Market size and forecast 2023-2028 ($ million)
      • Exhibit 84: Data Table on US - Market size and forecast 2023-2028 ($ million)
      • Exhibit 85: Chart on US - Year-over-year growth 2023-2028 (%)
      • Exhibit 86: Data Table on US - Year-over-year growth 2023-2028 (%)
    • 9.9 Germany - Market size and forecast 2023-2028
      • Exhibit 87: Chart on Germany - Market size and forecast 2023-2028 ($ million)
      • Exhibit 88: Data Table on Germany - Market size and forecast 2023-2028 ($ million)
      • Exhibit 89: Chart on Germany - Year-over-year growth 2023-2028 (%)
      • Exhibit 90: Data Table on Germany - Year-over-year growth 2023-2028 (%)
    • 9.10 UK - Market size and forecast 2023-2028
      • Exhibit 91: Chart on UK - Market size and forecast 2023-2028 ($ million)
      • Exhibit 92: Data Table on UK - Market size and forecast 2023-2028 ($ million)
      • Exhibit 93: Chart on UK - Year-over-year growth 2023-2028 (%)
      • Exhibit 94: Data Table on UK - Year-over-year growth 2023-2028 (%)
    • 9.11 China - Market size and forecast 2023-2028
      • Exhibit 95: Chart on China - Market size and forecast 2023-2028 ($ million)
      • Exhibit 96: Data Table on China - Market size and forecast 2023-2028 ($ million)
      • Exhibit 97: Chart on China - Year-over-year growth 2023-2028 (%)
      • Exhibit 98: Data Table on China - Year-over-year growth 2023-2028 (%)
    • 9.12 Japan - Market size and forecast 2023-2028
      • Exhibit 99: Chart on Japan - Market size and forecast 2023-2028 ($ million)
      • Exhibit 100: Data Table on Japan - Market size and forecast 2023-2028 ($ million)
      • Exhibit 101: Chart on Japan - Year-over-year growth 2023-2028 (%)
      • Exhibit 102: Data Table on Japan - Year-over-year growth 2023-2028 (%)
    • 9.13 Market opportunity by geography
      • Exhibit 103: Market opportunity by geography ($ million)
      • Exhibit 104: Data Tables on Market opportunity by geography ($ million)

    10 Drivers, Challenges, and Trends

    • 10.1 Market drivers
      • 10.2 Market challenges
        • 10.3 Impact of drivers and challenges
          • Exhibit 105: Impact of drivers and challenges in 2023 and 2028
        • 10.4 Market trends

          11 Vendor Landscape

          • 11.1 Overview
            • 11.2 Vendor landscape
              • Exhibit 106: Overview on Criticality of inputs and Factors of differentiation
            • 11.3 Landscape disruption
              • Exhibit 107: Overview on factors of disruption
            • 11.4 Industry risks
              • Exhibit 108: Impact of key risks on business

            12 Vendor Analysis

            • 12.1 Vendors covered
              • Exhibit 109: Vendors covered
            • 12.2 Market positioning of vendors
              • Exhibit 110: Matrix on vendor position and classification
            • 12.3 Alibre LLC
              • Exhibit 111: Alibre LLC - Overview
              • Exhibit 112: Alibre LLC - Product / Service
              • Exhibit 113: Alibre LLC - Key offerings
            • 12.4 Autodesk Inc.
              • Exhibit 114: Autodesk Inc. - Overview
              • Exhibit 115: Autodesk Inc. - Product / Service
              • Exhibit 116: Autodesk Inc. - Key offerings
            • 12.5 Bentley Systems Inc.
              • Exhibit 117: Bentley Systems Inc. - Overview
              • Exhibit 118: Bentley Systems Inc. - Product / Service
              • Exhibit 119: Bentley Systems Inc. - Key news
              • Exhibit 120: Bentley Systems Inc. - Key offerings
            • 12.6 Caddie Ltd.
              • Exhibit 121: Caddie Ltd. - Overview
              • Exhibit 122: Caddie Ltd. - Product / Service
              • Exhibit 123: Caddie Ltd. - Key offerings
            • 12.7 Dassault Systemes SE
              • Exhibit 124: Dassault Systemes SE - Overview
              • Exhibit 125: Dassault Systemes SE - Product / Service
              • Exhibit 126: Dassault Systemes SE - Key news
              • Exhibit 127: Dassault Systemes SE - Key offerings
            • 12.8 DATACAD LLC
              • Exhibit 128: DATACAD LLC - Overview
              • Exhibit 129: DATACAD LLC - Product / Service
              • Exhibit 130: DATACAD LLC - Key offerings
            • 12.9 ESI Group SA
              • Exhibit 131: ESI Group SA - Overview
              • Exhibit 132: ESI Group SA - Business segments
              • Exhibit 133: ESI Group SA - Key news
              • Exhibit 134: ESI Group SA - Key offerings
              • Exhibit 135: ESI Group SA - Segment focus
            • 12.10 Hexagon AB
              • Exhibit 136: Hexagon AB - Overview
              • Exhibit 137: Hexagon AB - Business segments
              • Exhibit 138: Hexagon AB - Key news
              • Exhibit 139: Hexagon AB - Key offerings
              • Exhibit 140: Hexagon AB - Segment focus
            • 12.11 IMSI Design LLC
              • Exhibit 141: IMSI Design LLC - Overview
              • Exhibit 142: IMSI Design LLC - Product / Service
              • Exhibit 143: IMSI Design LLC - Key offerings
            • 12.12 Nanosoft AS
              • Exhibit 144: Nanosoft AS - Overview
              • Exhibit 145: Nanosoft AS - Product / Service
              • Exhibit 146: Nanosoft AS - Key offerings
            • 12.13 Nemetschek SE
              • Exhibit 147: Nemetschek SE - Overview
              • Exhibit 148: Nemetschek SE - Business segments
              • Exhibit 149: Nemetschek SE - Key offerings
              • Exhibit 150: Nemetschek SE - Segment focus
            • 12.14 PTC Inc.
              • Exhibit 151: PTC Inc. - Overview
              • Exhibit 152: PTC Inc. - Business segments
              • Exhibit 153: PTC Inc. - Key offerings
              • Exhibit 154: PTC Inc. - Segment focus
            • 12.15 Schneider Electric SE
              • Exhibit 155: Schneider Electric SE - Overview
              • Exhibit 156: Schneider Electric SE - Business segments
              • Exhibit 157: Schneider Electric SE - Key news
              • Exhibit 158: Schneider Electric SE - Key offerings
              • Exhibit 159: Schneider Electric SE - Segment focus
            • 12.16 Siemens AG
              • Exhibit 160: Siemens AG - Overview
              • Exhibit 161: Siemens AG - Business segments
              • Exhibit 162: Siemens AG - Key news
              • Exhibit 163: Siemens AG - Key offerings
              • Exhibit 164: Siemens AG - Segment focus
            • 12.17 Trimble Inc.
              • Exhibit 165: Trimble Inc. - Overview
              • Exhibit 166: Trimble Inc. - Business segments
              • Exhibit 167: Trimble Inc. - Key offerings
              • Exhibit 168: Trimble Inc. - Segment focus

            13 Appendix

            • 13.1 Scope of the report
              • 13.2 Inclusions and exclusions checklist
                • Exhibit 169: Inclusions checklist
              • 13.3 Currency conversion rates for US$
                • Exhibit 170: Currency conversion rates for US$
              • 13.4 Research methodology
                • Exhibit 171: Research methodology
                • Exhibit 172: Validation techniques employed for market sizing
                • Exhibit 173: Information sources
              • 13.5 List of abbreviations
                • Exhibit 174: List of abbreviations

              Research Methodology

              Technavio presents a detailed picture of the market by way of study, synthesis, and summation of data from multiple sources. The analysts have presented the various facets of the market with a particular focus on identifying the key industry influencers. The data thus presented is comprehensive, reliable, and the result of extensive research, both primary and secondary.

              INFORMATION SOURCES

              Primary sources

              • Manufacturers and suppliers
              • Channel partners
              • Industry experts
              • Strategic decision makers

              Secondary sources

              • Industry journals and periodicals
              • Government data
              • Financial reports of key industry players
              • Historical data
              • Press releases

              DATA ANALYSIS

              Data Synthesis

              • Collation of data
              • Estimation of key figures
              • Analysis of derived insights

              Data Validation

              • Triangulation with data models
              • Reference against proprietary databases
              • Corroboration with industry experts

              REPORT WRITING

              Qualitative

              • Market drivers
              • Market challenges
              • Market trends
              • Five forces analysis

              Quantitative

              • Market size and forecast
              • Market segmentation
              • Geographical insights
              • Competitive landscape

              Interested in this report?

              Get your sample now to see our research methodology and insights!

              Download Now

              Frequently Asked Questions

              CADin the Civil and Construction Industry market growth will increase by $ 1368.42 mn during 2024-2028 .

              The CADin the Civil and Construction Industry market is expected to grow at a CAGR of 6.78% during 2024-2028 .

              CADin the Civil and Construction Industry market is segmented by Component( Software, Services) Product( 3D design, 2D design, APAC, South America, Middle East and Africa)

              Alibre LLC, Autodesk Inc., Bentley Systems Inc., CAD International, Caddie Ltd., Corel Corp., Dassault Systemes SE, DATACAD LLC, ESI Group SA, Gstarsoft Co. Ltd., Hexagon AB, IMSI Design LLC, Nanosoft AS, Nemetschek SE, PTC Inc., Schneider Electric SE, Siemens AG, SmartDraw Software LLC, Trimble Inc., ZWSOFT CO. LTD. are a few of the key vendors in the CADin the Civil and Construction Industry market.

              Europe will register the highest growth rate of 34% among the other regions. Therefore, the CADin the Civil and Construction Industry market in Europe is expected to garner significant business opportunities for the vendors during the forecast period.

              US, China, Japan, Germany, UK

              • Growing need to automate the design development processesDelays in design releases impact the overall business return on investment (ROI) is the driving factor this market.
              • and these delays occur due to the lack of collaboration between developers and system administrators. Discrepancies regarding goal alignment and targets also contribute to the problem. CAD addresses these issues related to complexities in the entire construction environment. CAD tools facilitate the application of a design concept is the driving factor this market.
              • of enabling close collaboration with the developers and operations team. In the abiding environment of the construction industry is the driving factor this market.
              • the change in the design is corrected instantaneously and much earlier in the CAD tools as there is the continuous deployment of design builds. This also results in cost advantages as the cost incurred on defect identification and resolution reduces when it is detected during the early stages. The software solution allows teams to work simultaneously as one team is the driving factor this market.
              • which enhances the productivity and stability of the design or configuration. Thus is the driving factor this market.
              • it is advantageous for enabling deployment automation and is the driving factor this market.
              • in turn is the driving factor this market.
              • will driveing the growth of the market for CAD software in the civil and construction industry during the forecast period. is the driving factor this market.

              The CADin the Civil and Construction Industry market vendors should focus on grabbing business opportunities from the Software segment as it accounted for the largest market share in the base year.