
Computer Aided Engineering Market Size 2025-2029
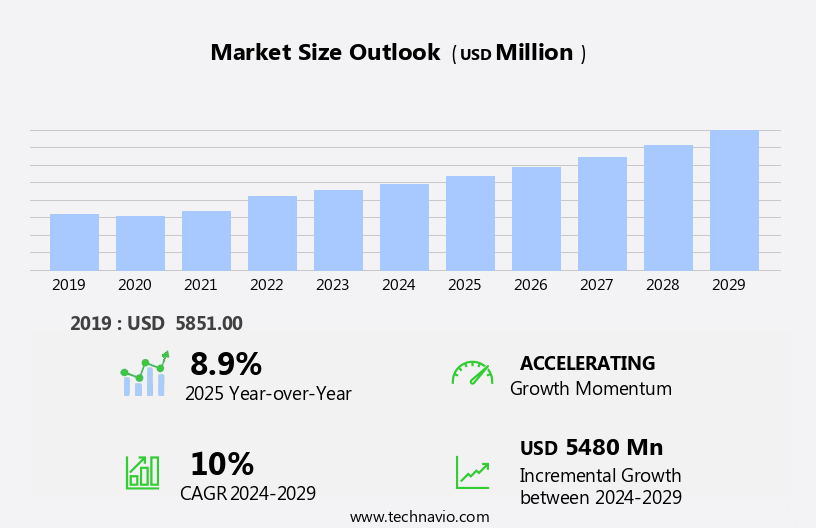
The computer aided engineering (CAE) market size is forecast to increase by USD 5.48 billion at a CAGR of 10% between 2024 and 2029.
- The market is experiencing significant growth, driven by the expansion of various industries such as consumer electronics, automotive, aviation, and renewable energy. Artificial intelligence (AI) is increasingly being integrated into CAE software to enhance simulation accuracy and efficiency. In the consumer electronics sector, the growing popularity of smartphones, tablets, and gaming devices is fueling the demand for CAE solutions to design and optimize batteries, particularly those using lithium and other advanced materials. The semiconductor industry is also adopting CAE for designing and testing complex chips, while the energy storage sector is leveraging CAE for battery modeling and optimization, particularly for solar panels and batteries used in renewable energy systems.
- Cloud computing is enabling the democratization of CAE, making it accessible to small and medium-sized enterprises (SMEs) and startups. However, challenges remain, including data security concerns, the need for embedded software expertise, and the lack of awareness among end-users about the latest CAE developments. In the medical devices sector, CAE is being used for digital prototyping and simulation, while the automotive industry is utilizing Building Information Modeling (BIM) for automation and design optimization. The aviation industry is also benefiting from CAE for motor vehicle design, and social networking platforms are using CAE for content creation and optimization.
What will be the Size of the Computer Aided Engineering (CAE) Market During the Forecast Period?
- The market encompasses a range of software solutions that enable engineers to simulate, analyze, and optimize product designs digitally. This market is experiencing strong growth, driven by the increasing demand for product innovation, durability, and quality across various industries. Key technologies within CAE include Finite Element Analysis (FEA), Computational Fluid Dynamics (CFD) software, and Validation through Simulation. Value-added resellers play a crucial role in delivering CAE solutions, offering integrated software solutions for engineering modes such as structural, thermal, and fluid dynamics analysis. The market's size is substantial, with significant investments being made in CAE tools for industries like aerospace, automotive, and electric vehicles.
- Licensing fees and pay-as-you-go subscriptions are common business models, allowing organizations to access CAE solutions based on their specific needs and budgets. CAE solutions are increasingly being integrated with other engineering tools, such as Building Information Modeling (BIM) and 3D printing, to create a more comprehensive product development process. CAE software is essential for process management, enabling concurrent engineering and improving product durability and quality. As industries continue to prioritize digital transformation, the demand for advanced CAE solutions will persistently grow.
How is this Computer Aided Engineering (CAE) Industry segmented and which is the largest segment?
The industry research report provides comprehensive data (region-wise segment analysis), with forecasts and estimates in "USD million" for the period 2025-2029, as well as historical data from 2019-2023 for the following segments.
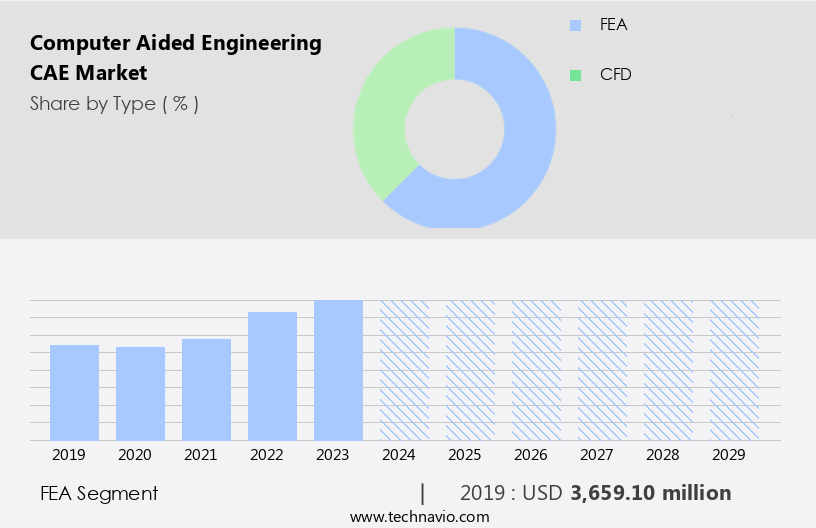
- Type
- FEA
- CFD
- End-user
- Automotive
- Aerospace and defense
- Electrical and electronics
- Others
- Deployment
- On-premises
- Cloud
- Geography
- Europe
- Germany
- UK
- France
- Italy
- North America
- Canada
- US
- APAC
- China
- India
- Japan
- South America
- Brazil
- Middle East and Africa
- Europe
By Type Insights
- The FEA segment is estimated to witness significant growth during the forecast period. The market encompasses solutions that utilize Finite Element Analysis (FEA) software for product design and development. FEA is a critical component of CAE, enabling the evaluation of product designs' structural strength and behavior through simulation and modeling. This technology is instrumental in various industries, including electronics, semiconductors, aerospace, defense, and energy, among others. FEA's utilization leads to cost reduction, improved product quality, accelerated time-to-market, and enhanced design optimization. Additionally, CAE solutions offer simulation-based design, problem-solving capabilities, and integration of CAE data across engineering modes and modes of concurrent engineering. The advent of digital technologies, automation, cloud, and building information modeling (BIM) has further expanded the scope of CAE.
- Moreover, software-as-a-Service (SaaS) and cloud-based CAE solutions have gained popularity due to their decision-making capabilities and internet connectivity. Furthermore, the integration of optimization algorithms, machine learning, artificial intelligence, predictive modeling, and localization strategies has added value to CAE solutions. CAE technology companies and software developers cater to diverse industry verticals, including consumer electronics, aerospace & defense, healthcare, and industrial equipment. Complex CAE solutions are increasingly being adopted by startups and small-to-medium enterprises to optimize product durability, enhance product quality, and streamline process management. In the context of electric vehicles, CAE solutions play a significant role in simulating battery life, temperature, and fan performance to optimize fuel consumption, reduce carbon emissions, and minimize noise pollution.
Get a glance at the market report of share of various segments Request Free Sample
The FEA segment was valued at USD 3.66 billion in 2019 and showed a gradual increase during the forecast period.
Regional Analysis
- APAC is estimated to contribute 32% to the growth of the global market during the forecast period. Technavio's analysts have elaborately explained the regional trends and drivers that shape the market during the forecast period. Computer Aided Engineering (CAE) plays a pivotal role in the research and development sector, particularly in the aerospace and defense industry. Europe, with its prominent aerospace and defense companies, is a significant market for CAE solutions. Finite Element Analysis (FEA) and Computational Fluid Dynamics (CFD) software are key CAE technologies used extensively in this industry. The European Space Agency is a major end-user of these software solutions.

For more insights on the market size of various regions, Request Free Sample
CFD is employed in various applications, including temperature regulation in buildings and complex fluid dynamics studies in the Large Hadron Collider under CERN. Value-added resellers offer CAE solutions to engineering sectors, enabling product durability, quality enhancement, and process management. CAE solutions also facilitate simulation-based design, problem-solving, and optimization, accelerating time-to-market for startups and small-to-medium enterprises. CAE technology companies and software developers provide complex solutions, integrating the Internet of Things, Cloud-based CAE, and decision-making capabilities. Industries like electronics, semiconductors, energy, and transportation are adopting CAE solutions for product quality, fuel consumption optimization, and carbon footprint reduction.
Market Dynamics
Our researchers analyzed the data with 2024 as the base year, along with the key drivers, trends, and challenges. A holistic analysis of drivers will help companies refine their marketing strategies to gain a competitive advantage.
What are the key market drivers leading to the rise in the adoption of Computer Aided Engineering (CAE) Industry?
- Growth of the smartphone industry is the key driver of the market. Computer-Aided Engineering (CAE) solutions play a pivotal role in various industry verticals, including aerospace, defense, electronics, semiconductors, energy, and engineering sectors. CAE technology companies and software developers offer complex CAE solutions, such as Finite Element Analysis (FEA) and Computational Fluid Dynamics (CFD) software, to enhance product durability and quality. Value-added resellers (VARs) also contribute significantly to the market by providing consulting services and customized solutions. The electrical and electronics industry is a significant end-user of CAE software, driven by the increasing production and demand for electronics devices like smartphones and tablets. Consumers' preference for web applications on these devices for multimedia content, browsing, video calling, gaming, and social networking is leading to their widespread adoption.
- CAE software products enable simulation-based design, optimization algorithms, machine learning, and artificial intelligence for predictive modeling, problem-solving, and decision-making capabilities. Cloud-based CAE solutions, such as Software-as-a-Service (SaaS), offer advantages like Internet connectivity, reduced licensing fees, and pay-as-you-go subscriptions. The engineering sector also benefits from CAE technology through simulation, modeling, information, validation, and prototyping. Industries like aerospace and defense, healthcare, and consumer electronics leverage CAE solutions for designing complex parts, analyzing hardware failure, and optimizing fuel consumption and carbon footprint in energy-efficient aircraft and low-emission planes. Moreover, CAE solutions are essential for industries dealing with thermal analysis, multibody dynamics, and structural deformation, such as solar panels, passenger aircraft, and industrial equipment.
What are the market trends shaping the Computer Aided Engineering (CAE) Industry?
- Increasing adoption of CFD for battery designing is the upcoming market trend. The engineering sector is witnessing a significant shift towards Computer Aided Engineering (CAE) solutions, driven by the increasing demand for product durability, quality, and process management. CAE technology companies and software developers are offering complex solutions that cater to various industry verticals, including aerospace, defense, electronics, semiconductors, energy, and automotive. CAE software products, such as Finite Element Analysis (FEA) and Computational Fluid Dynamics (CFD), enable simulation-based design, problem-solving, and optimization. The rise of Software-as-a-Service (SaaS) and Cloud-based CAE solutions has facilitated easier access to these tools for startups and small-to-medium enterprises. CAE solutions are integral to engineering modes like concurrent engineering, 3D printing, and digital technologies like the Internet of Things (IoT).
- The automotive industry's focus on reducing carbon footprint and fuel consumption has led to increased spending on CAE for temperature analysis, structural deformation, fan performance, and noise pollution. In the aerospace industry, CAE solutions are crucial for designing energy-efficient aircraft, low-emission planes, and solar panels. CAE software is essential for analyzing the performance of composite parts, predicting hardware failure, and validating designs. The integration of CAE data with Building Information Modelling (BIM) enhances product quality and accelerates time-to-market. CAE solutions' decision-making capabilities are further enhanced by optimization algorithms, machine learning, and artificial intelligence. CAE software products' licensing fees are being replaced by pay-as-you-go subscriptions, making them more accessible to a broader range of engineering firms.
What challenges does the Computer Aided Engineering (CAE) Industry face during its growth?
- Lack of awareness among end-users about developments in CFD is a key challenge affecting the industry growth. The market experiences ongoing growth due to the increasing adoption of advanced CAE solutions by various industry verticals. Traditional CAE methods, such as Finite Element Analysis (FEA) and Computational Fluid Dynamics (CFD) software, have been instrumental in enhancing product durability and quality through simulation-based design. However, some challenges have hindered the widespread adoption of these technologies. Historically, the hiring of CFD experts was a significant expense for companies. Moreover, the software was highly complex, necessitating a strong mathematical background for effective utilization. Consequently, substantial investments were required for employee training. Furthermore, when software providers introduced updates to CFD codes, additional training was necessary, leading to further costs.
- Value-added resellers play a crucial role in addressing these challenges by offering integrated CAE data, engineering modes, and concurrent engineering capabilities. CAE technology companies and software developers have responded by creating user-friendly interfaces, providing Software-as-a-Service (SaaS) options, and implementing optimization algorithms, machine learning, and artificial intelligence to simplify problem-solving. Emerging technologies, such as 3D printing, the Internet of Things (IoT), and Cloud-based CAE, have also contributed to the market's expansion. These advancements offer decision-making capabilities, enabling engineering sectors to enhance product quality, reduce time-to-market, and improve process management. CAE solutions are increasingly popular in industries like aerospace, defense, electronics, semiconductors, energy, and automotive.
Exclusive Customer Landscape
The market forecasting report includes the adoption lifecycle of the market, covering from the innovator's stage to the laggard's stage. It focuses on adoption rates in different regions based on penetration. Furthermore, the market report also includes key purchase criteria and drivers of price sensitivity to help companies evaluate and develop their market growth analysis strategies.

Customer Landscape
Key Companies & Market Insights
Companies are implementing various strategies, such as strategic alliances, market forecast, partnerships, mergers and acquisitions, geographical expansion, and product/service launches, to enhance their presence in the industry.
Altair Engineering Inc. - The company offers CAE named Altair Hyperworks with model structures, mechanisms, fluids, electromagnetics, electrical, embedded software, systems design, and manufacturing processes.
The industry research and growth report includes detailed analyses of the competitive landscape of the market and information about key companies, including:
- Altair Engineering Inc.
- ANSYS Inc.
- Autodesk Inc.
- Bentley Systems Inc.
- BETA CAE Systems
- Cadence Design Systems Inc.
- Ceetron AS
- COMSOL AB
- Dassault Systemes SE
- ESI Group SA
- Fidesys LLC
- Flow Sciences Inc.
- Hexagon AB
- Parametric Designs and Solutions
- PTC Inc.
- Seiko Epson Corp.
- Siemens AG
- Simerics Inc.
- SimScale GmbH
- Symscape
Qualitative and quantitative analysis of companies has been conducted to help clients understand the wider business environment as well as the strengths and weaknesses of key industry players. Data is qualitatively analyzed to categorize companies as pure play, category-focused, industry-focused, and diversified; it is quantitatively analyzed to categorize companies as dominant, leading, strong, tentative, and weak.
Research Analyst Overview
The market is witnessing significant growth, fueled by the increasing adoption of digital technologies in various industry verticals. CAE solutions are increasingly becoming indispensable tools for engineers and design teams, enabling them to simulate and analyze product performance under various conditions. Similarly, in the aerospace sector, CAE is essential for analyzing structural deformation, high-altitude flight, and fuel consumption to develop energy-efficient aircraft, such as low-emission planes and solar panels for passenger aircraft. CAE technology is finding extensive applications in several sectors, including electronics, aerospace, defense, energy, and semiconductors. The integration of CAE data and the adoption of simulation-based design methodologies are leading to enhanced product durability, improved product quality, and accelerated time-to-market. CAE solutions are enabling engineers to perform finite element analysis, multibody dynamics, and thermal analysis, among other engineering modes.
Moreover, the use of CAE software products is facilitating the optimization of designs, leading to energy-efficient aircraft, low-emission planes, and high-performance solar panels. The adoption of cloud-based CAE solutions is gaining momentum due to the benefits they offer, such as reduced licensing fees, pay-as-you-go subscriptions, and access to modeling information from anywhere, at any time. The integration of machine learning, artificial intelligence, and predictive modeling capabilities in CAE software is further enhancing their decision-making capabilities. CAE technology companies and software developers are continuously innovating to meet the evolving needs of the market. Startups and small-to-medium enterprises are also entering the market, offering complex CAE solutions that cater to specific industry requirements.
Furthermore, the use of CAE technology is leading to significant improvements in product quality enhancement and time-to-market acceleration. The integration of CAE solutions with Building Information Modeling (BIM) and the Internet of Things (IoT) is enabling real-time monitoring and analysis of product performance, leading to better design iterations and improved problem-solving capabilities. The adoption of CAE technology is also leading to automation and digitalization in various industries, including aerospace and defense, consumer electronics, healthcare, and industrial equipment. The integrated software solution provides a comprehensive platform for creating prototypes, offering software as a service to streamline modeling information and enhance project development.
|
Market Scope |
|
|
Report Coverage |
Details |
|
Page number |
223 |
|
Base year |
2024 |
|
Historic period |
2019-2023 |
|
Forecast period |
2025-2029 |
|
Growth momentum & CAGR |
Accelerate at a CAGR of 10% |
|
Market growth 2025-2029 |
USD 5.48 billion |
|
Market structure |
Fragmented |
|
YoY growth 2024-2025(%) |
8.9 |
|
Key countries |
US, Germany, China, UK, Canada, Brazil, Italy, Japan, France, and India |
|
Competitive landscape |
Leading Companies, Market Positioning of Companies, Competitive Strategies, and Industry Risks |
What are the Key Data Covered in this Computer Aided Engineering (CAE) Market Research and Growth Report?
- CAGR of the Computer Aided Engineering (CAE) industry during the forecast period
- Detailed information on factors that will drive the market growth and forecasting between 2025 and 2029
- Precise estimation of the size of the market and its contribution of the industry in focus to the parent market
- Accurate predictions about upcoming growth and trends and changes in consumer behaviour
- Growth of the market across Europe, North America, APAC, South America, and Middle East and Africa
- Thorough analysis of the market's competitive landscape and detailed information about companies
- Comprehensive analysis of factors that will challenge the computer aided engineering (cae) market growth of industry companies
We can help! Our analysts can customize this computer aided engineering (cae) market research report to meet your requirements.
 RIA -
RIA - 
