Camel Milk Market Size 2025-2029
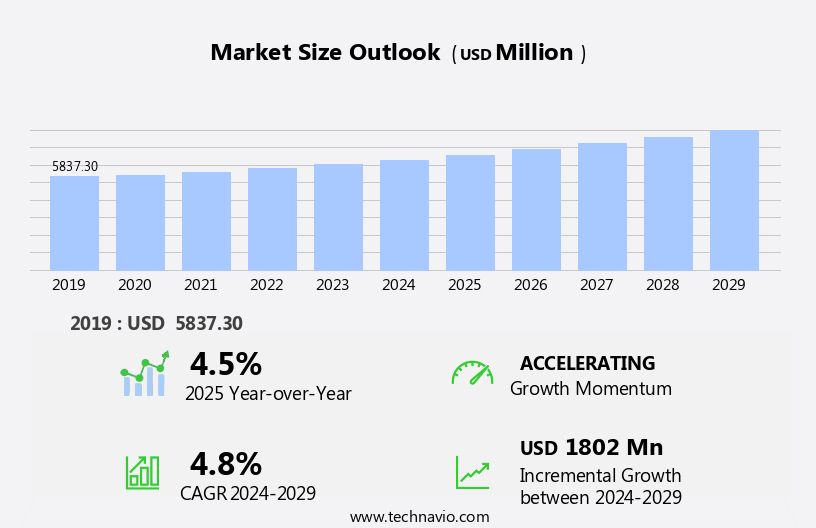
The camel milk market size is forecast to increase by USD 1.8 billion, at a CAGR of 4.8% between 2024 and 2029.
- The market is experiencing significant growth, driven primarily by the increasing production of camel milk and the rising preference for this milk among diabetic patients. The unique nutritional properties of camel milk, including its low lactose content and high levels of vitamins and minerals, make it an attractive alternative for those with lactose intolerance and diabetes. Camel milk contains insulin, immunoglobulins, and other essential nutrients that make it an ideal alternative for those with diabetes. However, this market faces challenges from the increasing popularity of plant-based milk alternatives, which are gaining traction due to their perceived health benefits and ethical considerations. Companies operating in this market must navigate these challenges by differentiating their offerings through superior taste, unique health benefits, or innovative production methods.
- Additionally, collaborations with healthcare providers and diabetic organizations can help boost market penetration and establish camel milk as a viable option for diabetic patients. Overall, the market presents opportunities for growth, particularly in regions with large camel populations and a growing awareness of the health benefits of this unique milk. Companies seeking to capitalize on these opportunities must stay abreast of consumer trends and preferences, while also addressing the challenges posed by plant-based milk alternatives.
What will be the Size of the Camel Milk Market during the forecast period?
Explore in-depth regional segment analysis with market size data - historical 2019-2023 and forecasts 2025-2029 - in the full report.
Request Free Sample
The market continues to evolve, driven by the growing recognition of its unique nutritional properties and diverse applications. Standardized camel milk, with its therapeutic properties, is gaining traction in various sectors. Dried camel milk and functional foods are emerging categories, offering extended shelf life and convenience. Camel husbandry practices are continually improving to enhance milk quality and productivity. Brand loyalty is a significant factor, with consumers seeking assurance of hygiene standards, food safety, and ethical sourcing. Vitamins C and E, essential nutrients, add value to camel milk, contributing to its nutritional profile. Quality control measures and pricing strategies are crucial in managing the supply chain and catering to consumer preferences.
Functional foods and dietary supplements are expanding markets for camel milk, with fortified milk and concentrated camel milk gaining popularity. Food processing techniques, including UHT processing and milk storage, ensure product safety and maintain nutritional value. Camel milk protein, vitamin D, and folic acid are among the essential nutrients attracting consumer interest. Camel milk's nutritional benefits extend to the dairy farming industry, where it is used for cattle feed to improve milk production and quality. Flavored milk and whey protein are other potential applications, catering to diverse consumer tastes and dietary needs. The ongoing unfolding of market activities underscores the continuous dynamism of the market.
How is this Camel Milk Industry segmented?
The camel milk industry research report provides comprehensive data (region-wise segment analysis), with forecasts and estimates in "USD million" for the period 2025-2029, as well as historical data from 2019-2023 for the following segments.
- Product
- Fresh camel milk
- Processed camel milk
- Distribution Channel
- Offline
- Online
- Application
- Food and beverage
- Pharmaceuticals
- Cosmetics
- Others
- Geography
- North America
- US
- Europe
- UK
- Middle East and Africa
- Ethiopia
- Kenya
- APAC
- China
- India
- Rest of World (ROW)
- North America
By Product Insights
The fresh camel milk segment is estimated to witness significant growth during the forecast period.
The market experiences significant growth due to the unique nutritional benefits of camel milk. Fresh camel milk, which holds a substantial market share, boasts a nutritional profile similar to whole cow's milk but with less saturated fat and more essential minerals like calcium, iron, and potassium. Vitamins C and B12 are also abundant in fresh camel milk, contributing to its health advantages. Hygiene standards are meticulously maintained during milk collection to ensure food safety. Camel milk powder and fortified milk are popular alternatives for longer shelf life. Ethical sourcing and food processing methods, including UHT processing, are crucial to meet consumer preferences.
Camel milk's therapeutic properties, including its potential to aid in digestive issues and boost immunity, further fuel market growth. Product differentiation is achieved through flavored milk, standardized milk, and concentrated camel milk offerings. Dairy farming practices adhere to stringent quality control measures to maintain the milk's nutritional value. Consumer perception of camel milk as a functional food, rich in vitamins A, D, C, E, and essential minerals, drives demand. Brand loyalty is fostered through pricing strategies that cater to various consumer segments. The supply chain is streamlined to ensure milk storage and distribution efficiency. Dietary supplements and infant formula, fortified with camel milk protein and vitamins, cater to diverse health needs.
Overall, the market continues to evolve, offering innovative solutions that cater to consumers' increasing demand for natural, nutrient-dense, and ethically sourced dairy alternatives.
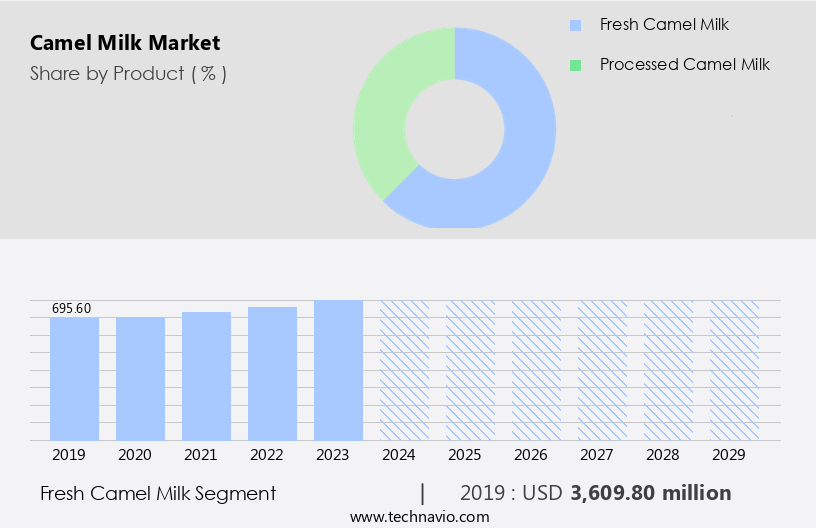
The Fresh camel milk segment was valued at USD 3.61 billion in 2019 and showed a gradual increase during the forecast period.
Regional Analysis
Middle East and Africa is estimated to contribute 63% to the growth of the global market during the forecast period.Technavio's analysts have elaborately explained the regional trends and drivers that shape the market during the forecast period.
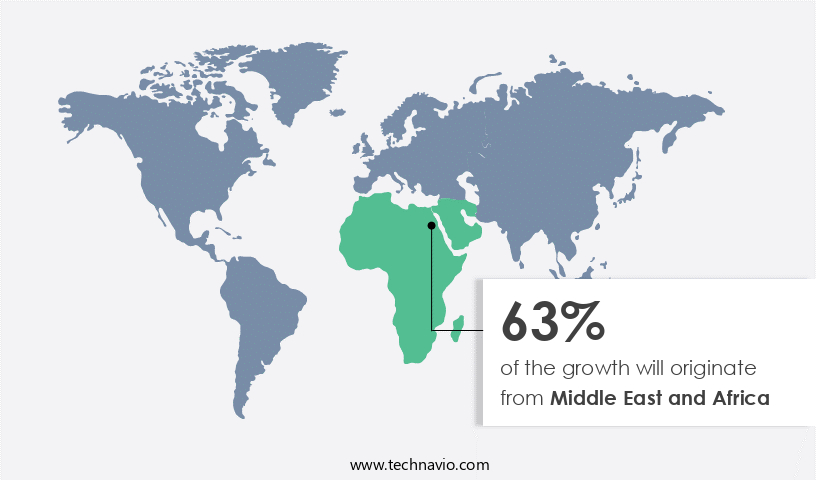
The market in the Middle East and Africa (MEA) is experiencing significant growth due to increasing consumer awareness of its nutritional benefits and the expanding urban population. Camel milk's unique nutritional profile, including vitamin B12, vitamin C, vitamin E, calcium, and essential amino acids, appeals to health-conscious consumers. Hygiene standards and food safety regulations are becoming increasingly stringent, driving the adoption of advanced food processing technologies such as UHT processing and milk storage. Product differentiation is a key strategy for companies in the market, with offerings ranging from standardized milk to fortified milk, concentrated camel milk, and camel milk powder.
Ethical sourcing and sustainable camel husbandry practices are essential for companies seeking to build brand loyalty. Consumer preferences for flavored milk and functional foods, such as camel milk protein and vitamin D-fortified milk, are also influencing market trends. Camel milk's therapeutic properties, including its ability to aid in digestion and boost immunity, further contribute to its popularity. Dairy farming in MEA is expanding to meet the growing demand, with countries like Somalia and Kenya being major global producers. The supply chain is becoming more efficient, with advancements in milk collection and quality control. Pricing strategies and consumer preferences continue to shape the market dynamics, with dietary supplements and infant formula being significant market segments.
Market Dynamics
The Camel Milk Market is experiencing significant growth globally, driven by increasing awareness of camel milk benefits. Consumers are seeking fresh camel milk and convenient camel milk powder as a superior camel milk dairy alternative. It's particularly popular for individuals with lactose intolerance and camel milk for allergies, offering a highly digestible option. The camel milk nutrition profile is exceptional, making it a functional food. Research into camel milk for diabetes and overall camel milk health is also boosting demand. The diverse range of camel milk products continues to expand, reflecting the vibrant camel milk industry. As camel milk sales rise, consumers are increasingly looking to buy camel milk online. This growing camel milk demand is influencing camel milk processing and camel milk production, leading to higher camel milk consumption and exploring new camel milk uses worldwide.
Our researchers analyzed the data with 2024 as the base year, along with the key drivers, trends, and challenges. A holistic analysis of drivers will help companies refine their marketing strategies to gain a competitive advantage.
What are the key market drivers leading to the rise in the adoption of Camel Milk Industry?
- The significant growth in camel milk production serves as the primary catalyst for market expansion.
- Camel milk is gaining popularity worldwide due to its unique nutritional benefits, including high levels of camel milk protein and vitamin D. The increasing consumer perception of camel milk as a healthier alternative to traditional cow's milk is driving market growth. This trend has resulted in an expansion of camel dairies in various regions, such as Australia, where the number has grown to ten in the past two years. Ethical sourcing and food processing techniques, including UHT processing, are being employed to ensure the highest quality and safety standards. Furthermore, flavored camel milk variants are being introduced to cater to diverse consumer preferences.
- The market is anticipated to witness significant growth due to increasing investments in camel dairy farming in countries like Kenya and Ethiopia in Africa. Overall, the market dynamics are harmonious, with a focus on meeting the increasing demand for this unique and nutritious milk product.
What are the market trends shaping the Camel Milk Industry?
- The rising preference for camel milk among diabetic patients represents a significant market trend. This beverage, rich in essential nutrients and known for its potential diabetes management benefits, is gaining increasing recognition within the health community.
- Camel milk, a niche market, is gaining traction due to its standardized production and therapeutic properties. With an increasing number of diabetic patients in China, India, Pakistan, and other countries, the demand for camel milk is projected to surge. The total number of diabetic patients in India, for instance, is estimated to be around 100 million, and this number is expected to rise significantly in the coming years. Camel milk, rich in insulin and essential vitamins like Vitamin C and E, is considered an effective functional food for managing diabetes.
- Camel husbandry is being prioritized to ensure quality control and maintain brand loyalty. Pricing strategies are also being formulated to make camel milk accessible to a larger audience. Despite the challenges in production and distribution, the market is expected to grow steadily due to its unique health benefits.
What challenges does the Camel Milk Industry face during its growth?
- The dairy industry faces significant growth challenges due to intensifying competition from plant-based milk alternatives.
- Camel milk is experiencing significant competition from powdered plant-based milk alternatives, including soy milk, almond milk, and coconut milk. Consumers with lactose intolerance, milk allergies, or vegan preferences primarily opt for these alternatives due to their low fat and cholesterol levels. The demand for plant-based milk is driven by increasing health consciousness, growing awareness of the medical benefits, and the expanding vegan population. In 2024, almond milk was the fastest-growing segment of the global dairy alternative drinks market. Its popularity can be attributed to its distinct flavor and the natural oils derived from almonds. However, camel milk offers unique health benefits, such as high levels of vitamin A, folic acid, and whey protein.
- Milk storage and supply chain challenges can impact the market growth of camel milk. Despite these challenges, the market for camel milk as a dietary supplement and in infant formula continues to gain traction due to its numerous health benefits.
Exclusive Customer Landscape
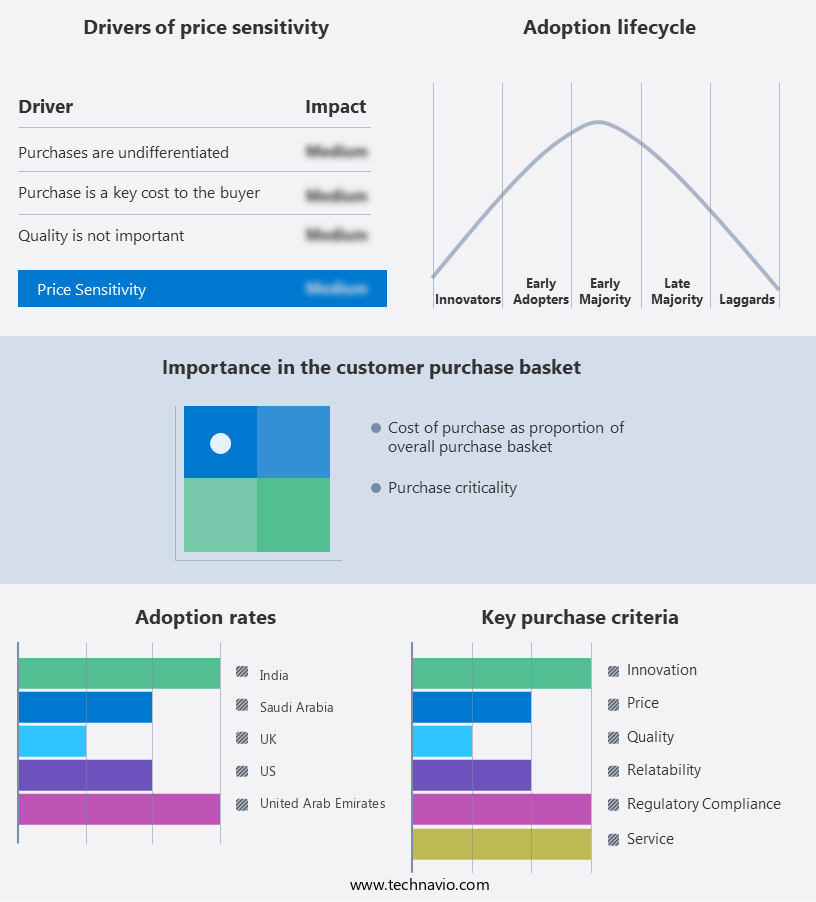
The camel milk market forecasting report includes the adoption lifecycle of the market, covering from the innovator's stage to the laggard's stage. It focuses on adoption rates in different regions based on penetration. Furthermore, the camel milk market report also includes key purchase criteria and drivers of price sensitivity to help companies evaluate and develop their market growth analysis strategies.
Customer Landscape
Key Companies & Market Insights
Companies are implementing various strategies, such as strategic alliances, camel milk market forecast, partnerships, mergers and acquisitions, geographical expansion, and product/service launches, to enhance their presence in the industry.
The industry research and growth report includes detailed analyses of the competitive landscape of the market and information about key companies, including:
- Aadvik Foods and Products Pvt. Ltd.
- Al Ain Farms
- BestCamelMilk
- Camel Charisma Pvt. Ltd.
- Camel Culture
- Camel Dairy Farm Smits
- Camel Milk Co. Australia Pty Ltd.
- Camel Milk South Africa
- Camelot Camel Dairy LLC.
- Dandaragan Camel Dairies Pty Ltd.
- Desert Farms Inc.
- DromeDairy Naturals
- Emirates Industry for Camel Milk and Products
- Gujarat Cooperative Milk Marketing Federation Ltd.
- QCamel
- Sahara Camel Milk
- Sahara Dairy Co.
- Tiviski Pvt Ltd.
- UK Camel Milk Ltd.
Qualitative and quantitative analysis of companies has been conducted to help clients understand the wider business environment as well as the strengths and weaknesses of key industry players. Data is qualitatively analyzed to categorize companies as pure play, category-focused, industry-focused, and diversified; it is quantitatively analyzed to categorize companies as dominant, leading, strong, tentative, and weak.
Recent Development and News in Camel Milk Market
- In January 2024, Camel Milk Corporation (CMC), a leading camel milk producer, announced the launch of its new line of organic camel milk beverages, targeting the growing health-conscious consumer segment. The product line includes plain camel milk, chocolate, and strawberry flavors (Camel Milk Corporation Press Release, 2024).
- In March 2024, Camel Milk Producers Federation (CMPF) and Danone, a global food company, entered into a strategic partnership to develop and market camel milk-based dairy products. This collaboration aimed to leverage Danone's expertise in dairy processing and CMPF's camel milk supply (Danone Press Release, 2024).
- In May 2024, Almarai Company, the largest food and beverage company in the Middle East, invested USD10 million in a new camel milk processing plant in Saudi Arabia. This expansion was part of Almarai's commitment to meet the growing demand for camel milk in the region (Almarai Company Press Release, 2024).
- In February 2025, the UAE Food Safety Authority approved the use of camel milk as a substitute for cow's milk in infant formula. This approval marked a significant milestone in the camel milk industry, opening up new opportunities for manufacturers and expanding the market (UAE Food Safety Authority Press Release, 2025).
Research Analyst Overview
- In the dynamic the market, export opportunities abound for this niche dairy product. Regional variations in milk composition offer unique selling points for different applications, such as camel milk exfoliant and cheese, which require modified atmosphere packaging for optimal preservation. Import regulations and organic certification are crucial considerations for brands seeking to expand their reach. Aseptic packaging and refrigerated storage are essential for maintaining the quality of camel milk toner, kefir, and lotion. Breed selection and sustainable farming practices contribute to a competitive advantage, while product innovation, health claims, and consumer education drive global demand. Milk yield and animal welfare are key areas of focus for brands aiming to differentiate themselves.
- Lactose intolerance and camel milk allergies necessitate careful marketing strategies and clear labeling. Product innovation, including camel milk soap, scrub, cleanser, conditioner, serum, and masks, continues to fuel market growth. Spray drying and freeze drying are important processing techniques for extending the shelf life of camel milk powder, yogurt, and other dairy products. Brand awareness and effective marketing strategies are essential for success in this competitive market.
Dive into Technavio's robust research methodology, blending expert interviews, extensive data synthesis, and validated models for unparalleled Camel Milk Market insights. See full methodology.
|
Market Scope |
|
|
Report Coverage |
Details |
|
Page number |
213 |
|
Base year |
2024 |
|
Historic period |
2019-2023 |
|
Forecast period |
2025-2029 |
|
Growth momentum & CAGR |
Accelerate at a CAGR of 4.8% |
|
Market growth 2025-2029 |
USD 1802 million |
|
Market structure |
Fragmented |
|
YoY growth 2024-2025(%) |
4.5 |
|
Key countries |
Saudi Arabia, United Arab Emirates, Kenya, Somalia, India, Ethiopia, UK, US, Niger, and China |
|
Competitive landscape |
Leading Companies, Market Positioning of Companies, Competitive Strategies, and Industry Risks |
What are the Key Data Covered in this Camel Milk Market Research and Growth Report?
- CAGR of the Camel Milk industry during the forecast period
- Detailed information on factors that will drive the growth and forecasting between 2025 and 2029
- Precise estimation of the size of the market and its contribution of the industry in focus to the parent market
- Accurate predictions about upcoming growth and trends and changes in consumer behaviour
- Growth of the market across Middle East and Africa, Europe, APAC, North America, and South America
- Thorough analysis of the market's competitive landscape and detailed information about companies
- Comprehensive analysis of factors that will challenge the camel milk market growth of industry companies
We can help! Our analysts can customize this camel milk market research report to meet your requirements.
 RIA -
RIA - 
