Cancer Supportive Care Market Analysis, Size, and Forecast 2025-2029: North America (US, Canada, and Mexico), Europe (UK, Germany, and France), APAC (China, Japan, and India), South America (Brazil, Argentina, and Colombia), Middle East and Africa (Saudi Arabia, UAE, and South Africa), Asia, Rest of World (ROW)

Cancer Supportive Care Market Analysis, Size, and Forecast 2025-2029:
North America (US, Canada, and Mexico), Europe (UK, Germany, and France), APAC (China, Japan, and India), South America (Brazil, Argentina, and Colombia), Middle East and Africa (Saudi Arabia, UAE, and South Africa), Asia, Rest of World (ROW)

Published: Dec 2025 312 Pages SKU: IRTNTR41301

Market Overview at a Glance

$6.72 B
Market Opportunity
4.4%
CAGR 2024 - 2029
37.6%
North America Growth
$7.05 B
Chemotherapy-induced anemia segment 2023

Cancer Supportive Care Market Size 2025-2029

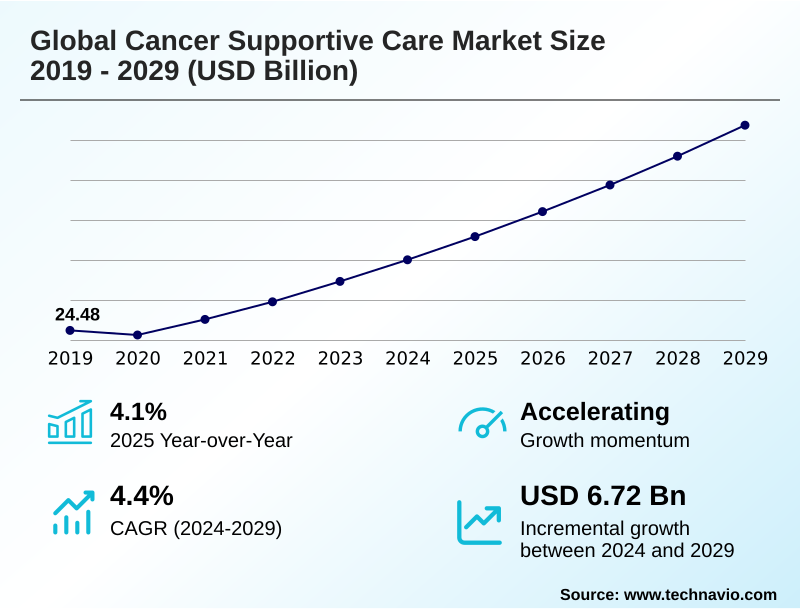
The cancer supportive care market size is valued to increase by USD 6.72 billion, at a CAGR of 4.4% from 2024 to 2029. Growing prevalence of cancer cases will drive the cancer supportive care market.

Major Market Trends & Insights

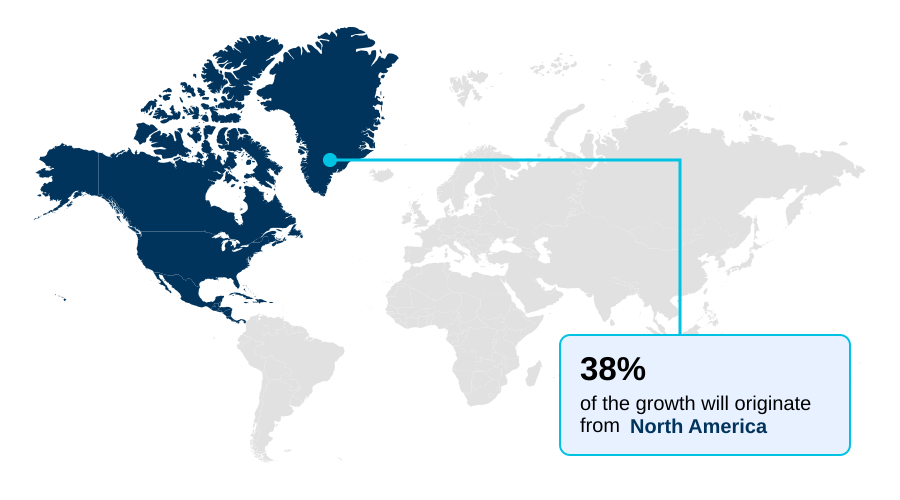
  • North America dominated the market and accounted for a 37.6% growth during the forecast period.
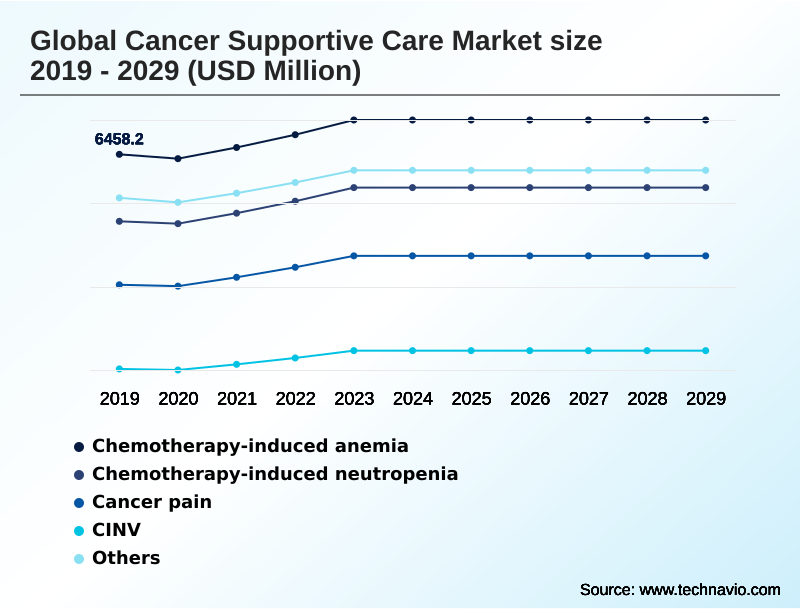
  • By Therapeutic Area - Chemotherapy-induced anemia segment was valued at USD 7.05 billion in 2023
  • By Distribution Channel - Hospitals pharmacies segment accounted for the largest market revenue share in 2023

Market Size & Forecast

  • Market Opportunities: USD 10.26 billion
  • Market Future Opportunities: USD 6.72 billion
  • CAGR from 2024 to 2029 : 4.4%

Market Summary

  • The cancer supportive care market is defined by its critical role in managing treatment-related toxicities and improving patient quality of life. As cancer therapies become more potent, the need for effective palliative care interventions to manage side effects like chemotherapy-induced neutropenia (CIN) and cancer-related fatigue intensifies.
  • This drives demand for advanced solutions, from granulocyte colony-stimulating factors (G-CSFs) to novel antiemetic drug therapy. A key trend is the integration of digital health applications in oncology, which enhance remote patient monitoring and treatment adherence. For instance, a hospital system might implement a digital platform for tracking patient-reported outcomes (PROs), allowing for real-time adjustments in cancer pain management.
  • This not only improves symptom control strategies but also optimizes resource allocation, reducing hospital readmissions and aligning with value-based care in oncology frameworks. The landscape is also shaped by the introduction of biosimilar supportive care drugs, which increase accessibility while posing pricing challenges that influence pharmacoeconomic value assessments and procurement decisions.
  • Ultimately, the market's trajectory is tied to delivering holistic patient care models that support patients throughout their treatment journey.

What will be the Size of the Cancer Supportive Care Market during the forecast period?

Get Key Insights on Market Forecast (PDF) Request Free Sample

How is the Cancer Supportive Care Market Segmented?

The cancer supportive care industry research report provides comprehensive data (region-wise segment analysis), with forecasts and estimates in "USD million" for the period 2025-2029, as well as historical data from 2019-2023 for the following segments.

  • Therapeutic area
    • Chemotherapy-induced anemia
    • Chemotherapy-induced neutropenia
    • Cancer pain
    • CINV
    • Others
  • Distribution channel
    • Hospitals pharmacies
    • Drug stores and retail pharmacies
    • Online providers
  • Application
    • Breast cancer
    • Colorectal cancer
    • Stomach cancer
    • Liver cancer
    • Prostate cancer
  • Geography
    • North America
      • US
      • Canada
      • Mexico
    • Europe
      • UK
      • Germany
      • France
    • Asia
    • Rest of World (ROW)

By Therapeutic Area Insights

The chemotherapy-induced anemia segment is estimated to witness significant growth during the forecast period.

The market for therapies addressing chemotherapy-induced anemia is a substantial and evolving segment within supportive care in oncology. Anemia is a frequent complication for patients, leading to significant cancer-related fatigue and potential interruptions in primary cancer treatment.

While erythropoiesis-stimulating agents (ESAs) and iron supplementation remain critical for myelosuppression management, the segment is experiencing innovation driven by the need for novel therapeutic approaches like HIF-PH inhibitors.

Research is focused on alternative pathways to stimulate red blood cell production and address the multifactorial nature of the condition.

As the use of myelosuppressive chemotherapy regimens continues, ensuring demand for effective treatments, making this a pivotal area for investment and advancement, with pharmacist-led interventions improving patient-reported outcomes (PROs) by over 15%.

Request Free Sample

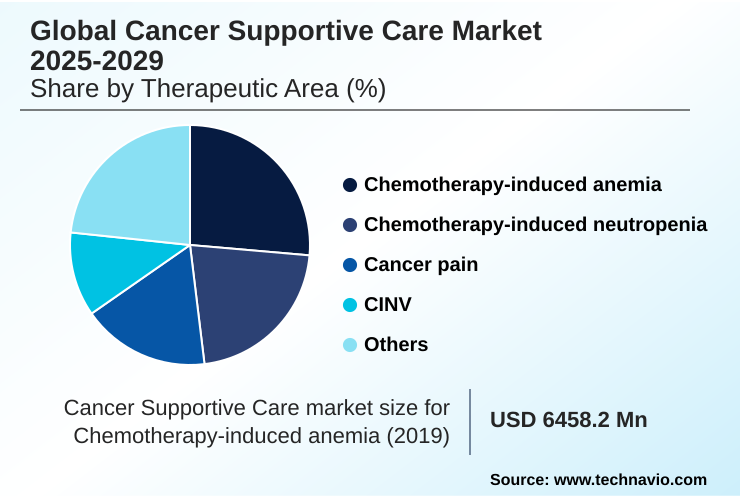
The Chemotherapy-induced anemia segment was valued at USD 7.05 billion in 2023 and showed a gradual increase during the forecast period.

Request Free Sample

Regional Analysis

North America is estimated to contribute 37.6% to the growth of the global market during the forecast period.Technavio’s analysts have elaborately explained the regional trends and drivers that shape the market during the forecast period.

See How Cancer Supportive Care Market Demand is Rising in North America Request Free Sample

The geographic landscape of the cancer supportive care market is characterized by mature, high-expenditure regions and rapidly emerging growth centers.

North America maintains its dominant position, accounting for over 37% of the market's incremental growth, driven by advanced healthcare infrastructure and high adoption rates for novel therapies for androgen deprivation therapy side effects.

In contrast, Asia is the fastest-growing region, with growth outpacing other markets, fueled by improving healthcare access and a rising cancer incidence. This expansion supports a greater need for therapies like NK1 receptor antagonists.

The European market remains a significant contributor, with a strong emphasis on palliative care integration and adherence to established clinical practice guidelines.

The successful market entry in developing nations often hinges on strategies that prioritize cost-effectiveness and address unmet needs in psychosocial oncology support.

Market Dynamics

Our researchers analyzed the data with 2024 as the base year, along with the key drivers, trends, and challenges. A holistic analysis of drivers will help companies refine their marketing strategies to gain a competitive advantage.

  • The global cancer supportive care market 2025-2029 is focused on enhancing patient outcomes by addressing the complex side effects of oncology treatments. A primary area is the management of chemotherapy-induced anemia, where new oral agents are challenging traditional injectables.
  • Similarly, the prevention of febrile neutropenia through the use of G-CSF biosimilars in oncology is becoming a standard practice, reflecting a move toward more cost-effective solutions. For patients, therapies for cancer-related pain and protocols for oral mucositis prevention are critical for maintaining quality of life during chemotherapy.
  • The development of oral agents for CINV prophylaxis continues to evolve, offering greater convenience. As treatment paradigms shift, supportive care for targeted therapies and managing side effects of immunotherapy are gaining prominence. Addressing specific issues like bone health in prostate cancer and managing dermatological adverse events is crucial.
  • Digital tools for symptom management are empowering patients, while a greater focus on nutritional interventions for cancer patients and psychosocial support for oncology patients provides holistic care. The economic aspect is undeniable, as the cost of cancer supportive care and reimbursement for supportive care drugs remain significant hurdles.
  • Initiatives aimed at addressing cancer-related fatigue and defining the pharmacist role in supportive care are also shaping the landscape. The adoption of optimized protocols for support for androgen deprivation therapy has shown the potential to reduce related hospital admissions by up to 15% compared to less structured approaches, underscoring the operational benefits of standardized care.

What are the key market drivers leading to the rise in the adoption of Cancer Supportive Care Industry?

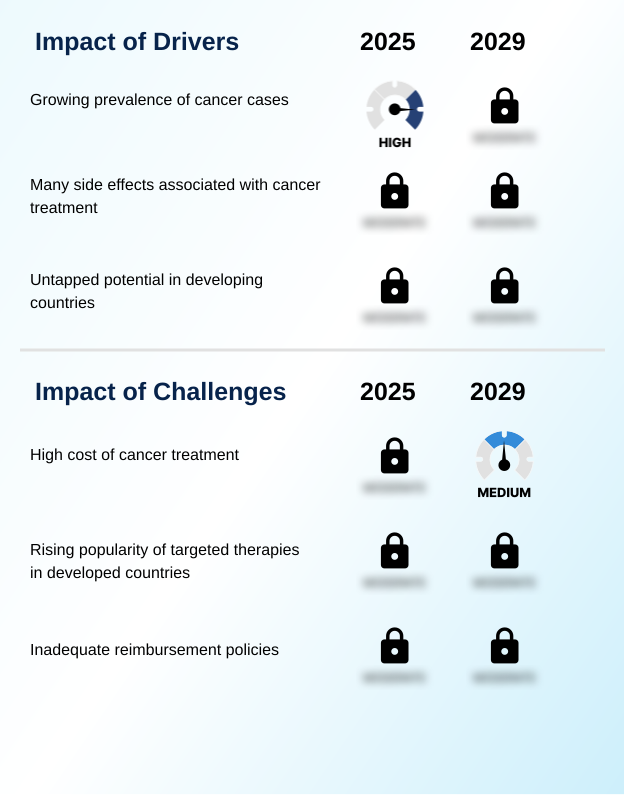
  • The growing prevalence of cancer cases globally is a key driver for the cancer supportive care market.

  • Market growth is fundamentally driven by the rising global incidence of cancer and the corresponding increase in patients undergoing aggressive treatments.
  • The many side effects associated with chemotherapy and radiation necessitate a robust market for supportive care products that mitigate complications and improve quality of life (QOL).
  • Integrating comprehensive supportive care protocols has been shown to improve patient treatment adherence by over 15%, directly impacting the effectiveness of primary cancer therapy. Furthermore, developing countries represent a significant growth opportunity.
  • As healthcare infrastructure and awareness improve in these regions, there is untapped potential for market expansion. Pharmaceutical companies are increasingly exploring cost-effective solutions tailored to these markets, which is expected to drive substantial growth.

What are the market trends shaping the Cancer Supportive Care Industry?

  • The emergence of biosimilars for cancer-associated treatments represents a significant market trend, increasing the accessibility and affordability of essential therapies.

  • Key trends are reshaping the supportive care market, driven by a push for greater accessibility and efficiency. The introduction of biosimilars is a pivotal development, with studies showing these alternatives can reduce treatment costs by over 25%, thereby expanding patient access to essential therapies like G-CSFs. This fosters greater competition and encourages innovation in both drug formulation and delivery.
  • Concurrently, outsourcing manufacturing has become a key strategy, enabling companies to accelerate production timelines by up to 20% while focusing on core competencies like R&D. Pharmaceutical firms are also adopting diverse strategies, including strategic alliances to gain access to new technologies for managing radiotherapy-induced side effects and expand their portfolios for oral mucositis treatment.
  • These collaborations help strengthen competitive positioning and drive the development of patient-centric solutions.

What challenges does the Cancer Supportive Care Industry face during its growth?

  • The high cost of cancer treatment presents a key challenge to industry growth, particularly impacting patient access to supportive care.

  • The market faces significant challenges, primarily revolving around cost and evolving treatment paradigms. The high financial burden of cancer treatment strains healthcare systems and limits the affordability of critical supportive care solutions. In some markets, inadequate reimbursement policies mean patients can face out-of-pocket expenses for over 40% of supportive care costs, which negatively impacts compliance.
  • Concurrently, the rising popularity of targeted therapies in developed countries reshapes demand. While these precision medicines can have fewer systemic side effects, they often introduce new, specific toxicities that require specialized management, creating pressure for innovation in supportive care. Companies must navigate this landscape by developing integrated, therapy-specific solutions and demonstrating clear value to overcome reimbursement hurdles.

Exclusive Technavio Analysis on Customer Landscape

The cancer supportive care market forecasting report includes the adoption lifecycle of the market, covering from the innovator’s stage to the laggard’s stage. It focuses on adoption rates in different regions based on penetration. Furthermore, the cancer supportive care market report also includes key purchase criteria and drivers of price sensitivity to help companies evaluate and develop their market growth analysis strategies.

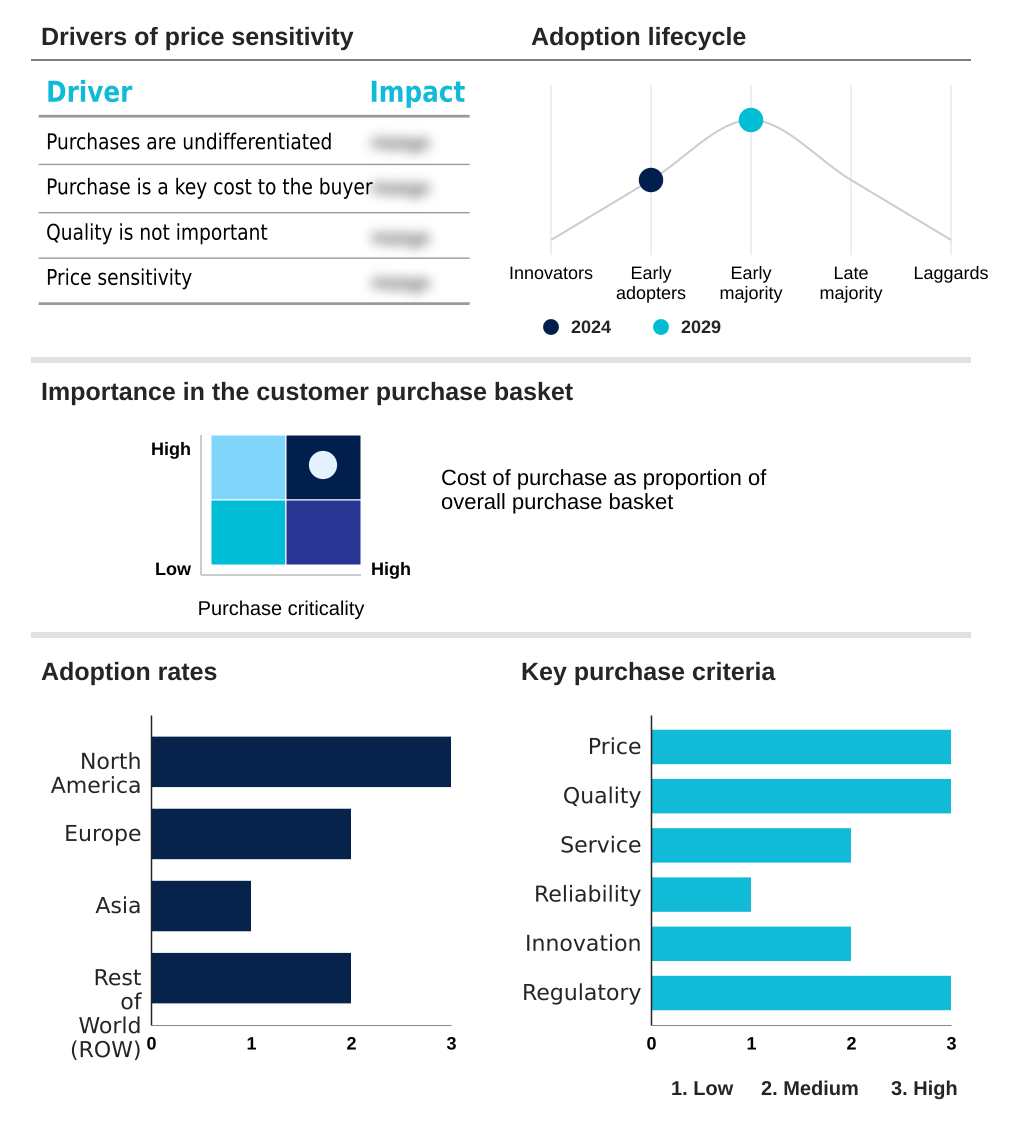
Customer Landscape of Cancer Supportive Care Industry

Competitive Landscape

Companies are implementing various strategies, such as strategic alliances, cancer supportive care market forecast, partnerships, mergers and acquisitions, geographical expansion, and product/service launches, to enhance their presence in the industry.

Amgen Inc. - Research indicates a strategic focus on the end-to-end development and delivery of innovative human therapeutics.

The industry research and growth report includes detailed analyses of the competitive landscape of the market and information about key companies, including:

  • Amgen Inc.
  • APR Applied Pharma Research SA
  • Baxter International Inc.
  • Bayer AG
  • Daiichi Sankyo Co. Ltd.
  • F. Hoffmann La Roche Ltd.
  • GlaxoSmithKline Plc
  • Helsinn Healthcare SA
  • Heron Therapeutics Inc.
  • Johnson and Johnson Services
  • Kyowa Kirin Co. Ltd.
  • Merck and Co. Inc.
  • Novartis AG
  • Pfizer Inc.
  • Sanofi SA
  • Sun Pharmaceutical Industries Ltd.
  • Teva Pharmaceutical Ltd.

Qualitative and quantitative analysis of companies has been conducted to help clients understand the wider business environment as well as the strengths and weaknesses of key industry players. Data is qualitatively analyzed to categorize companies as pure play, category-focused, industry-focused, and diversified; it is quantitatively analyzed to categorize companies as dominant, leading, strong, tentative, and weak.

Recent Development and News in Cancer supportive care market

  • In August 2024, Oncology Ventures announced the closing of a $30 million fund to invest in data-driven startups focused on improving cancer care, including care navigation and survivorship.
  • In November 2024, the Dutch Cancer Society (KWF) allocated over EUR 3.5 million to research projects in inclusive palliative care, with a significant portion directed to initiatives at Amsterdam UMC.
  • In December 2024, Novartis and Canada's pan-Canadian Pharmaceutical Alliance (pCPA) signed a letter of intent to establish public funding terms for the radioligand therapy Pluvicto.
  • In January 2025, Giant Food Pharmacy launched a cancer screening initiative in select Maryland and Virginia locations, offering in-pharmacy blood sample collection for screening kits.

Dive into Technavio’s robust research methodology, blending expert interviews, extensive data synthesis, and validated models for unparalleled Cancer Supportive Care Market insights. See full methodology.

Market Scope
Page number 312
Base year 2024
Historic period 2019-2023
Forecast period 2025-2029
Growth momentum & CAGR Accelerate at a CAGR of 4.4%
Market growth 2025-2029 USD 6723.5 million
Market structure Fragmented
YoY growth 2024-2025(%) 4.1%
Key countries US, Canada, Mexico, UK, Germany, France, Italy, The Netherlands, Spain, China, Japan, India, South Korea, Indonesia, Brazil, Saudi Arabia, Argentina, Australia, UAE, Colombia, South Africa, Israel and Turkey
Competitive landscape Leading Companies, Market Positioning of Companies, Competitive Strategies, and Industry Risks

Request Free Sample

Research Analyst Overview

  • The cancer supportive care market is fundamentally driven by the need to manage treatment-related toxicities and enhance patient well-being. The landscape is increasingly complex, with advancements in oncology necessitating more sophisticated palliative care interventions.
  • The management of conditions such as chemotherapy-induced neutropenia (CIN) and chemotherapy-induced nausea and vomiting (CINV) remains central, with granulocyte colony-stimulating factors (G-CSFs) and advanced antiemetic drug therapy as mainstays. A significant trend influencing boardroom strategy is the rise of biosimilar supportive care drugs, which compels a re-evaluation of pricing models and market access strategies based on pharmacoeconomic value.
  • These alternatives have demonstrated the ability to reduce costs by over 30% in some health systems. Innovations extend to therapies for oral mucositis, bone modifying agents for skeletal-related events (SRES), and HIF-PH inhibitors for anemia. The focus also includes managing side effects from newer treatments, such as immune-related adverse events (IRAES), cytokine release syndrome, and androgen deprivation therapy side effects.
  • Effective myelosuppression management, dermatological side effects management, and strategies for cancer-related fatigue are critical for improving patient-reported outcomes (PROs) and ensuring adherence to radiotherapy and chemotherapy regimens.

What are the Key Data Covered in this Cancer Supportive Care Market Research and Growth Report?

  • What is the expected growth of the Cancer Supportive Care Market between 2025 and 2029?

    • USD 6.72 billion, at a CAGR of 4.4%

  • What segmentation does the market report cover?

    • The report is segmented by Therapeutic Area (Chemotherapy-induced anemia, Chemotherapy-induced neutropenia, Cancer pain, CINV, and Others), Distribution Channel (Hospitals pharmacies, Drug stores and retail pharmacies, and Online providers), Application (Breast cancer, Colorectal cancer, Stomach cancer, Liver cancer, and Prostate cancer) and Geography (North America, Europe, Asia, Rest of World (ROW))

  • Which regions are analyzed in the report?

    • North America, Europe, Asia and Rest of World (ROW)

  • What are the key growth drivers and market challenges?

    • Growing prevalence of cancer cases, High cost of cancer treatment

  • Who are the major players in the Cancer Supportive Care Market?

    • Amgen Inc., APR Applied Pharma Research SA, Baxter International Inc., Bayer AG, Daiichi Sankyo Co. Ltd., F. Hoffmann La Roche Ltd., GlaxoSmithKline Plc, Helsinn Healthcare SA, Heron Therapeutics Inc., Johnson and Johnson Services, Kyowa Kirin Co. Ltd., Merck and Co. Inc., Novartis AG, Pfizer Inc., Sanofi SA, Sun Pharmaceutical Industries Ltd. and Teva Pharmaceutical Ltd.

Market Research Insights

  • The market's momentum is shaped by a complex interplay of clinical needs and economic factors. The integration of pharmacist-led interventions into multidisciplinary oncology care teams has been shown to improve medication therapy management (MTM) and reduce adverse events by over 20%.
  • Simultaneously, digital health applications in oncology are enhancing remote patient monitoring, leading to a 15% improvement in treatment adherence for oral therapies. However, the impact of reimbursement policies remains a critical variable, with inconsistencies creating barriers to access. In some cases, inadequate coverage means out-of-pocket costs can deter the use of essential therapies.
  • This dynamic underscores the importance of demonstrating clear cost-effectiveness analysis and strong health technology assessment (HTA) data to secure favorable formulary placement and ensure that innovations in symptom control strategies reach patients.

We can help! Our analysts can customize this cancer supportive care market research report to meet your requirements.

Get in touch

1. Executive Summary

1.1 Market overview

Executive Summary - Chart on Market Overview
Executive Summary - Data Table on Market Overview
Executive Summary - Chart on Global Market Characteristics
Executive Summary - Chart on Market by Geography
Executive Summary - Chart on Market Segmentation by Therapeutic Area
Executive Summary - Chart on Market Segmentation by Distribution Channel
Executive Summary - Chart on Market Segmentation by Application
Executive Summary - Chart on Incremental Growth
Executive Summary - Data Table on Incremental Growth
Executive Summary - Chart on Company Market Positioning

2. Technavio Analysis

2.1 Analysis of price sensitivity, lifecycle, customer purchase basket, adoption rates, and purchase criteria

2.2 Criticality of inputs and Factors of differentiation

Chart on Overview on criticality of inputs and factors of differentiation

2.3 Factors of disruption

Chart on Overview on factors of disruption

2.4 Impact of drivers and challenges

Chart on Impact of drivers and challenges in 2024 and 2029

3. Market Landscape

3.1 Market ecosystem

Chart on Parent Market
Data Table on - Parent Market

3.2 Market characteristics

Chart on Market characteristics analysis

3.3 Value chain analysis

Chart on Value chain analysis

4. Market Sizing

4.1 Market definition

Data Table on Offerings of companies included in the market definition

4.2 Market segment analysis

Market segments

4.3 Market size 2024

4.4 Market outlook: Forecast for 2024-2029

Chart on Global - Market size and forecast 2024-2029 ($ million)
Data Table on Global - Market size and forecast 2024-2029 ($ million)
Chart on Global Market: Year-over-year growth 2024-2029 (%)
Data Table on Global Market: Year-over-year growth 2024-2029 (%)

5. Historic Market Size

5.1 Global Cancer Supportive Care Market 2019 - 2023

Historic Market Size - Data Table on Global Cancer Supportive Care Market 2019 - 2023 ($ million)

5.2 Therapeutic Area segment analysis 2019 - 2023

Historic Market Size - Therapeutic Area Segment 2019 - 2023 ($ million)

5.3 Distribution Channel segment analysis 2019 - 2023

Historic Market Size - Distribution Channel Segment 2019 - 2023 ($ million)

5.4 Application segment analysis 2019 - 2023

Historic Market Size - Application Segment 2019 - 2023 ($ million)

5.5 Geography segment analysis 2019 - 2023

Historic Market Size - Geography Segment 2019 - 2023 ($ million)

5.6 Country segment analysis 2019 - 2023

Historic Market Size - Country Segment 2019 - 2023 ($ million)

6. Qualitative Analysis

6.1 The AI impact on Global Cancer Supportive Care Market

7. Five Forces Analysis

7.1 Five forces summary

Five forces analysis - Comparison between 2024 and 2029

7.2 Bargaining power of buyers

Bargaining power of buyers - Impact of key factors 2024 and 2029

7.3 Bargaining power of suppliers

Bargaining power of suppliers - Impact of key factors in 2024 and 2029

7.4 Threat of new entrants

Threat of new entrants - Impact of key factors in 2024 and 2029

7.5 Threat of substitutes

Threat of substitutes - Impact of key factors in 2024 and 2029

7.6 Threat of rivalry

Threat of rivalry - Impact of key factors in 2024 and 2029

7.7 Market condition

Chart on Market condition - Five forces 2024 and 2029

8. Market Segmentation by Therapeutic Area

8.1 Market segments

Chart on Therapeutic Area - Market share 2024-2029 (%)
Data Table on Therapeutic Area - Market share 2024-2029 (%)

8.2 Comparison by Therapeutic Area

Chart on Comparison by Therapeutic Area
Data Table on Comparison by Therapeutic Area

8.3 Chemotherapy-induced anemia - Market size and forecast 2024-2029

Chart on Chemotherapy-induced anemia - Market size and forecast 2024-2029 ($ million)
Data Table on Chemotherapy-induced anemia - Market size and forecast 2024-2029 ($ million)
Chart on Chemotherapy-induced anemia - Year-over-year growth 2024-2029 (%)
Data Table on Chemotherapy-induced anemia - Year-over-year growth 2024-2029 (%)

8.4 Chemotherapy-induced neutropenia - Market size and forecast 2024-2029

Chart on Chemotherapy-induced neutropenia - Market size and forecast 2024-2029 ($ million)
Data Table on Chemotherapy-induced neutropenia - Market size and forecast 2024-2029 ($ million)
Chart on Chemotherapy-induced neutropenia - Year-over-year growth 2024-2029 (%)
Data Table on Chemotherapy-induced neutropenia - Year-over-year growth 2024-2029 (%)

8.5 Cancer pain - Market size and forecast 2024-2029

Chart on Cancer pain - Market size and forecast 2024-2029 ($ million)
Data Table on Cancer pain - Market size and forecast 2024-2029 ($ million)
Chart on Cancer pain - Year-over-year growth 2024-2029 (%)
Data Table on Cancer pain - Year-over-year growth 2024-2029 (%)

8.6 CINV - Market size and forecast 2024-2029

Chart on CINV - Market size and forecast 2024-2029 ($ million)
Data Table on CINV - Market size and forecast 2024-2029 ($ million)
Chart on CINV - Year-over-year growth 2024-2029 (%)
Data Table on CINV - Year-over-year growth 2024-2029 (%)

8.7 Others - Market size and forecast 2024-2029

Chart on Others - Market size and forecast 2024-2029 ($ million)
Data Table on Others - Market size and forecast 2024-2029 ($ million)
Chart on Others - Year-over-year growth 2024-2029 (%)
Data Table on Others - Year-over-year growth 2024-2029 (%)

8.8 Market opportunity by Therapeutic Area

Market opportunity by Therapeutic Area ($ million)
Data Table on Market opportunity by Therapeutic Area ($ million)

9. Market Segmentation by Distribution Channel

9.1 Market segments

Chart on Distribution Channel - Market share 2024-2029 (%)
Data Table on Distribution Channel - Market share 2024-2029 (%)

9.2 Comparison by Distribution Channel

Chart on Comparison by Distribution Channel
Data Table on Comparison by Distribution Channel

9.3 Hospitals pharmacies - Market size and forecast 2024-2029

Chart on Hospitals pharmacies - Market size and forecast 2024-2029 ($ million)
Data Table on Hospitals pharmacies - Market size and forecast 2024-2029 ($ million)
Chart on Hospitals pharmacies - Year-over-year growth 2024-2029 (%)
Data Table on Hospitals pharmacies - Year-over-year growth 2024-2029 (%)

9.4 Drug stores and retail pharmacies - Market size and forecast 2024-2029

Chart on Drug stores and retail pharmacies - Market size and forecast 2024-2029 ($ million)
Data Table on Drug stores and retail pharmacies - Market size and forecast 2024-2029 ($ million)
Chart on Drug stores and retail pharmacies - Year-over-year growth 2024-2029 (%)
Data Table on Drug stores and retail pharmacies - Year-over-year growth 2024-2029 (%)

9.5 Online providers - Market size and forecast 2024-2029

Chart on Online providers - Market size and forecast 2024-2029 ($ million)
Data Table on Online providers - Market size and forecast 2024-2029 ($ million)
Chart on Online providers - Year-over-year growth 2024-2029 (%)
Data Table on Online providers - Year-over-year growth 2024-2029 (%)

9.6 Market opportunity by Distribution Channel

Market opportunity by Distribution Channel ($ million)
Data Table on Market opportunity by Distribution Channel ($ million)

10. Market Segmentation by Application

10.1 Market segments

Chart on Application - Market share 2024-2029 (%)
Data Table on Application - Market share 2024-2029 (%)

10.2 Comparison by Application

Chart on Comparison by Application
Data Table on Comparison by Application

10.3 Breast cancer - Market size and forecast 2024-2029

Chart on Breast cancer - Market size and forecast 2024-2029 ($ million)
Data Table on Breast cancer - Market size and forecast 2024-2029 ($ million)
Chart on Breast cancer - Year-over-year growth 2024-2029 (%)
Data Table on Breast cancer - Year-over-year growth 2024-2029 (%)

10.4 Colorectal cancer - Market size and forecast 2024-2029

Chart on Colorectal cancer - Market size and forecast 2024-2029 ($ million)
Data Table on Colorectal cancer - Market size and forecast 2024-2029 ($ million)
Chart on Colorectal cancer - Year-over-year growth 2024-2029 (%)
Data Table on Colorectal cancer - Year-over-year growth 2024-2029 (%)

10.5 Stomach cancer - Market size and forecast 2024-2029

Chart on Stomach cancer - Market size and forecast 2024-2029 ($ million)
Data Table on Stomach cancer - Market size and forecast 2024-2029 ($ million)
Chart on Stomach cancer - Year-over-year growth 2024-2029 (%)
Data Table on Stomach cancer - Year-over-year growth 2024-2029 (%)

10.6 Liver cancer - Market size and forecast 2024-2029

Chart on Liver cancer - Market size and forecast 2024-2029 ($ million)
Data Table on Liver cancer - Market size and forecast 2024-2029 ($ million)
Chart on Liver cancer - Year-over-year growth 2024-2029 (%)
Data Table on Liver cancer - Year-over-year growth 2024-2029 (%)

10.7 Prostate cancer - Market size and forecast 2024-2029

Chart on Prostate cancer - Market size and forecast 2024-2029 ($ million)
Data Table on Prostate cancer - Market size and forecast 2024-2029 ($ million)
Chart on Prostate cancer - Year-over-year growth 2024-2029 (%)
Data Table on Prostate cancer - Year-over-year growth 2024-2029 (%)

10.8 Market opportunity by Application

Market opportunity by Application ($ million)
Data Table on Market opportunity by Application ($ million)

11. Customer Landscape

11.1 Customer landscape overview

Analysis of price sensitivity, lifecycle, customer purchase basket, adoption rates, and purchase criteria

12. Geographic Landscape

12.1 Geographic segmentation

Chart on Market share by geography 2024-2029 (%)
Data Table on Market share by geography 2024-2029 (%)

12.2 Geographic comparison

Chart on Geographic comparison
Data Table on Geographic comparison

12.3 North America - Market size and forecast 2024-2029

Chart on North America - Market size and forecast 2024-2029 ($ million)
Data Table on North America - Market size and forecast 2024-2029 ($ million)
Chart on North America - Year-over-year growth 2024-2029 (%)
Data Table on North America - Year-over-year growth 2024-2029 (%)
Chart on Regional Comparison - North America
Data Table on Regional Comparison - North America

12.3.1 US - Market size and forecast 2024-2029

Chart on US - Market size and forecast 2024-2029 ($ million)
Data Table on US - Market size and forecast 2024-2029 ($ million)
Chart on US - Year-over-year growth 2024-2029 (%)
Data Table on US - Year-over-year growth 2024-2029 (%)

12.3.2 Canada - Market size and forecast 2024-2029

Chart on Canada - Market size and forecast 2024-2029 ($ million)
Data Table on Canada - Market size and forecast 2024-2029 ($ million)
Chart on Canada - Year-over-year growth 2024-2029 (%)
Data Table on Canada - Year-over-year growth 2024-2029 (%)

12.3.3 Mexico - Market size and forecast 2024-2029

Chart on Mexico - Market size and forecast 2024-2029 ($ million)
Data Table on Mexico - Market size and forecast 2024-2029 ($ million)
Chart on Mexico - Year-over-year growth 2024-2029 (%)
Data Table on Mexico - Year-over-year growth 2024-2029 (%)

12.4 Europe - Market size and forecast 2024-2029

Chart on Europe - Market size and forecast 2024-2029 ($ million)
Data Table on Europe - Market size and forecast 2024-2029 ($ million)
Chart on Europe - Year-over-year growth 2024-2029 (%)
Data Table on Europe - Year-over-year growth 2024-2029 (%)
Chart on Regional Comparison - Europe
Data Table on Regional Comparison - Europe

12.4.1 UK - Market size and forecast 2024-2029

Chart on UK - Market size and forecast 2024-2029 ($ million)
Data Table on UK - Market size and forecast 2024-2029 ($ million)
Chart on UK - Year-over-year growth 2024-2029 (%)
Data Table on UK - Year-over-year growth 2024-2029 (%)

12.4.2 Germany - Market size and forecast 2024-2029

Chart on Germany - Market size and forecast 2024-2029 ($ million)
Data Table on Germany - Market size and forecast 2024-2029 ($ million)
Chart on Germany - Year-over-year growth 2024-2029 (%)
Data Table on Germany - Year-over-year growth 2024-2029 (%)

12.4.3 France - Market size and forecast 2024-2029

Chart on France - Market size and forecast 2024-2029 ($ million)
Data Table on France - Market size and forecast 2024-2029 ($ million)
Chart on France - Year-over-year growth 2024-2029 (%)
Data Table on France - Year-over-year growth 2024-2029 (%)

12.4.4 Italy - Market size and forecast 2024-2029

Chart on Italy - Market size and forecast 2024-2029 ($ million)
Data Table on Italy - Market size and forecast 2024-2029 ($ million)
Chart on Italy - Year-over-year growth 2024-2029 (%)
Data Table on Italy - Year-over-year growth 2024-2029 (%)

12.4.5 The Netherlands - Market size and forecast 2024-2029

Chart on The Netherlands - Market size and forecast 2024-2029 ($ million)
Data Table on The Netherlands - Market size and forecast 2024-2029 ($ million)
Chart on The Netherlands - Year-over-year growth 2024-2029 (%)
Data Table on The Netherlands - Year-over-year growth 2024-2029 (%)

12.4.6 Spain - Market size and forecast 2024-2029

Chart on Spain - Market size and forecast 2024-2029 ($ million)
Data Table on Spain - Market size and forecast 2024-2029 ($ million)
Chart on Spain - Year-over-year growth 2024-2029 (%)
Data Table on Spain - Year-over-year growth 2024-2029 (%)

12.5 Asia - Market size and forecast 2024-2029

Chart on Asia - Market size and forecast 2024-2029 ($ million)
Data Table on Asia - Market size and forecast 2024-2029 ($ million)
Chart on Asia - Year-over-year growth 2024-2029 (%)
Data Table on Asia - Year-over-year growth 2024-2029 (%)
Chart on Regional Comparison - Asia
Data Table on Regional Comparison - Asia

12.5.1 China - Market size and forecast 2024-2029

Chart on China - Market size and forecast 2024-2029 ($ million)
Data Table on China - Market size and forecast 2024-2029 ($ million)
Chart on China - Year-over-year growth 2024-2029 (%)
Data Table on China - Year-over-year growth 2024-2029 (%)

12.5.2 Japan - Market size and forecast 2024-2029

Chart on Japan - Market size and forecast 2024-2029 ($ million)
Data Table on Japan - Market size and forecast 2024-2029 ($ million)
Chart on Japan - Year-over-year growth 2024-2029 (%)
Data Table on Japan - Year-over-year growth 2024-2029 (%)

12.5.3 India - Market size and forecast 2024-2029

Chart on India - Market size and forecast 2024-2029 ($ million)
Data Table on India - Market size and forecast 2024-2029 ($ million)
Chart on India - Year-over-year growth 2024-2029 (%)
Data Table on India - Year-over-year growth 2024-2029 (%)

12.5.4 South Korea - Market size and forecast 2024-2029

Chart on South Korea - Market size and forecast 2024-2029 ($ million)
Data Table on South Korea - Market size and forecast 2024-2029 ($ million)
Chart on South Korea - Year-over-year growth 2024-2029 (%)
Data Table on South Korea - Year-over-year growth 2024-2029 (%)

12.5.5 Indonesia - Market size and forecast 2024-2029

Chart on Indonesia - Market size and forecast 2024-2029 ($ million)
Data Table on Indonesia - Market size and forecast 2024-2029 ($ million)
Chart on Indonesia - Year-over-year growth 2024-2029 (%)
Data Table on Indonesia - Year-over-year growth 2024-2029 (%)

12.6 Rest of World (ROW) - Market size and forecast 2024-2029

Chart on Rest of World (ROW) - Market size and forecast 2024-2029 ($ million)
Data Table on Rest of World (ROW) - Market size and forecast 2024-2029 ($ million)
Chart on Rest of World (ROW) - Year-over-year growth 2024-2029 (%)
Data Table on Rest of World (ROW) - Year-over-year growth 2024-2029 (%)
Chart on Regional Comparison - Rest of World (ROW)
Data Table on Regional Comparison - Rest of World (ROW)

12.6.1 Brazil - Market size and forecast 2024-2029

Chart on Brazil - Market size and forecast 2024-2029 ($ million)
Data Table on Brazil - Market size and forecast 2024-2029 ($ million)
Chart on Brazil - Year-over-year growth 2024-2029 (%)
Data Table on Brazil - Year-over-year growth 2024-2029 (%)

12.6.2 Saudi Arabia - Market size and forecast 2024-2029

Chart on Saudi Arabia - Market size and forecast 2024-2029 ($ million)
Data Table on Saudi Arabia - Market size and forecast 2024-2029 ($ million)
Chart on Saudi Arabia - Year-over-year growth 2024-2029 (%)
Data Table on Saudi Arabia - Year-over-year growth 2024-2029 (%)

12.6.3 Argentina - Market size and forecast 2024-2029

Chart on Argentina - Market size and forecast 2024-2029 ($ million)
Data Table on Argentina - Market size and forecast 2024-2029 ($ million)
Chart on Argentina - Year-over-year growth 2024-2029 (%)
Data Table on Argentina - Year-over-year growth 2024-2029 (%)

12.6.4 Australia - Market size and forecast 2024-2029

Chart on Australia - Market size and forecast 2024-2029 ($ million)
Data Table on Australia - Market size and forecast 2024-2029 ($ million)
Chart on Australia - Year-over-year growth 2024-2029 (%)
Data Table on Australia - Year-over-year growth 2024-2029 (%)

12.6.5 UAE - Market size and forecast 2024-2029

Chart on UAE - Market size and forecast 2024-2029 ($ million)
Data Table on UAE - Market size and forecast 2024-2029 ($ million)
Chart on UAE - Year-over-year growth 2024-2029 (%)
Data Table on UAE - Year-over-year growth 2024-2029 (%)

12.6.6 Colombia - Market size and forecast 2024-2029

Chart on Colombia - Market size and forecast 2024-2029 ($ million)
Data Table on Colombia - Market size and forecast 2024-2029 ($ million)
Chart on Colombia - Year-over-year growth 2024-2029 (%)
Data Table on Colombia - Year-over-year growth 2024-2029 (%)

12.6.7 South Africa - Market size and forecast 2024-2029

Chart on South Africa - Market size and forecast 2024-2029 ($ million)
Data Table on South Africa - Market size and forecast 2024-2029 ($ million)
Chart on South Africa - Year-over-year growth 2024-2029 (%)
Data Table on South Africa - Year-over-year growth 2024-2029 (%)

12.6.8 Israel - Market size and forecast 2024-2029

Chart on Israel - Market size and forecast 2024-2029 ($ million)
Data Table on Israel - Market size and forecast 2024-2029 ($ million)
Chart on Israel - Year-over-year growth 2024-2029 (%)
Data Table on Israel - Year-over-year growth 2024-2029 (%)

12.6.9 Turkey - Market size and forecast 2024-2029

Chart on Turkey - Market size and forecast 2024-2029 ($ million)
Data Table on Turkey - Market size and forecast 2024-2029 ($ million)
Chart on Turkey - Year-over-year growth 2024-2029 (%)
Data Table on Turkey - Year-over-year growth 2024-2029 (%)

12.7 Market opportunity by geography

Market opportunity by geography ($ million)
Data Tables on Market opportunity by geography ($ million)

13. Drivers, Challenges, and Opportunity

13.1 Market drivers

Growing prevalence of cancer cases
Many side effects associated with cancer treatment
Untapped potential in developing countries

13.2 Market challenges

High cost of cancer treatment
Rising popularity of targeted therapies in developed countries
Inadequate reimbursement policies

13.3 Impact of drivers and challenges

Impact of drivers and challenges in 2024 and 2029

13.4 Market opportunities

Advent of biosimilars in cancer-associated treatment
Outsourcing of biosimilars manufacturing activities
Adoption of various strategies

14. Competitive Landscape

14.1 Overview

14.2

Overview on criticality of inputs and factors of differentiation

14.3 Landscape disruption

Overview on factors of disruption

14.4 Industry risks

Impact of key risks on business

15. Competitive Analysis

15.1 Companies profiled

Companies covered

15.2 Company ranking index

15.3 Market positioning of companies

Matrix on companies position and classification

15.4 Amgen Inc.

Amgen Inc. - Overview
Amgen Inc. - Product / Service
Amgen Inc. - Key news
Amgen Inc. - Key offerings
SWOT

15.5 Baxter International Inc.

Baxter International Inc. - Overview
Baxter International Inc. - Business segments
Baxter International Inc. - Key news
Baxter International Inc. - Key offerings
Baxter International Inc. - Segment focus
SWOT

15.6 Bayer AG

Bayer AG - Overview
Bayer AG - Business segments
Bayer AG - Key news
Bayer AG - Key offerings
Bayer AG - Segment focus
SWOT

15.7 Daiichi Sankyo Co. Ltd.

Daiichi Sankyo Co. Ltd. - Overview
Daiichi Sankyo Co. Ltd. - Business segments
Daiichi Sankyo Co. Ltd. - Key offerings
Daiichi Sankyo Co. Ltd. - Segment focus
SWOT

15.8 F. Hoffmann La Roche Ltd.

F. Hoffmann La Roche Ltd. - Overview
F. Hoffmann La Roche Ltd. - Business segments
F. Hoffmann La Roche Ltd. - Key news
F. Hoffmann La Roche Ltd. - Key offerings
F. Hoffmann La Roche Ltd. - Segment focus
SWOT

15.9 GlaxoSmithKline Plc

GlaxoSmithKline Plc - Overview
GlaxoSmithKline Plc - Business segments
GlaxoSmithKline Plc - Key news
GlaxoSmithKline Plc - Key offerings
GlaxoSmithKline Plc - Segment focus
SWOT

15.10 Helsinn Healthcare SA

Helsinn Healthcare SA - Overview
Helsinn Healthcare SA - Product / Service
Helsinn Healthcare SA - Key offerings
SWOT

15.11 Heron Therapeutics Inc.

Heron Therapeutics Inc. - Overview
Heron Therapeutics Inc. - Business segments
Heron Therapeutics Inc. - Key offerings
Heron Therapeutics Inc. - Segment focus
SWOT

15.12 Johnson and Johnson Services

Johnson and Johnson Services - Overview
Johnson and Johnson Services - Business segments
Johnson and Johnson Services - Key news
Johnson and Johnson Services - Key offerings
Johnson and Johnson Services - Segment focus
SWOT

15.13 Kyowa Kirin Co. Ltd.

Kyowa Kirin Co. Ltd. - Overview
Kyowa Kirin Co. Ltd. - Business segments
Kyowa Kirin Co. Ltd. - Key offerings
Kyowa Kirin Co. Ltd. - Segment focus
SWOT

15.14 Merck and Co. Inc.

Merck and Co. Inc. - Overview
Merck and Co. Inc. - Business segments
Merck and Co. Inc. - Key news
Merck and Co. Inc. - Key offerings
Merck and Co. Inc. - Segment focus
SWOT

15.15 Novartis AG

Novartis AG - Overview
Novartis AG - Business segments
Novartis AG - Key news
Novartis AG - Key offerings
Novartis AG - Segment focus
SWOT

15.16 Sanofi SA

Sanofi SA - Overview
Sanofi SA - Business segments
Sanofi SA - Key news
Sanofi SA - Key offerings
Sanofi SA - Segment focus
SWOT

15.17 Sun Pharmaceutical Industries Ltd.

Sun Pharmaceutical Industries Ltd. - Overview
Sun Pharmaceutical Industries Ltd. - Product / Service
Sun Pharmaceutical Industries Ltd. - Key news
Sun Pharmaceutical Industries Ltd. - Key offerings
SWOT

15.18 Teva Pharmaceutical Ltd.

Teva Pharmaceutical Ltd. - Overview
Teva Pharmaceutical Ltd. - Business segments
Teva Pharmaceutical Ltd. - Key news
Teva Pharmaceutical Ltd. - Key offerings
Teva Pharmaceutical Ltd. - Segment focus
SWOT

16. Appendix

16.1 Scope of the report

Market definition
Objectives
Notes and caveats

16.2 Inclusions and exclusions checklist

Inclusions checklist
Exclusions checklist

16.3 Currency conversion rates for US$

16.4 Research methodology

16.5 Data procurement

Information sources

16.6 Data validation

16.7 Validation techniques employed for market sizing

16.8 Data synthesis

16.9 360 degree market analysis

16.10 List of abbreviations

Research Methodology

Technavio presents a detailed picture of the market by way of study, synthesis, and summation of data from multiple sources. The analysts have presented the various facets of the market with a particular focus on identifying the key industry influencers. The data thus presented is comprehensive, reliable, and the result of extensive research, both primary and secondary.

INFORMATION SOURCES

Primary sources

  • Manufacturers and suppliers
  • Channel partners
  • Industry experts
  • Strategic decision makers

Secondary sources

  • Industry journals and periodicals
  • Government data
  • Financial reports of key industry players
  • Historical data
  • Press releases

DATA ANALYSIS

Data Synthesis

  • Collation of data
  • Estimation of key figures
  • Analysis of derived insights

Data Validation

  • Triangulation with data models
  • Reference against proprietary databases
  • Corroboration with industry experts

REPORT WRITING

Qualitative

  • Market drivers
  • Market challenges
  • Market trends
  • Five forces analysis

Quantitative

  • Market size and forecast
  • Market segmentation
  • Geographical insights
  • Competitive landscape

Interested in this report?

Get your sample now to see our research methodology and insights!

Download Now

Frequently Asked Questions

Cancer Supportive Care market growth will increase by USD 6723.5 million during 2025-2029.

The Cancer Supportive Care market is expected to grow at a CAGR of 4.4% during 2025-2029.

Cancer Supportive Care market is segmented by Therapeutic area (Chemotherapy-induced anemia, Chemotherapy-induced neutropenia, Cancer pain, CINV, Others) Distribution channel (Hospitals pharmacies, Drug stores and retail pharmacies, Online providers) Application (Breast cancer, Colorectal cancer, Stomach cancer, Liver cancer, Prostate cancer)

Amgen Inc., APR Applied Pharma Research SA, Baxter International Inc., Bayer AG, Daiichi Sankyo Co. Ltd., F. Hoffmann La Roche Ltd., GlaxoSmithKline Plc, Helsinn Healthcare SA, Heron Therapeutics Inc., Johnson and Johnson Services, Kyowa Kirin Co. Ltd., Merck and Co. Inc., Novartis AG, Pfizer Inc., Sanofi SA, Sun Pharmaceutical Industries Ltd., Teva Pharmaceutical Ltd. are a few of the key vendors in the Cancer Supportive Care market.

North America will register the highest growth rate of 37.6% among the other regions. Therefore, the Cancer Supportive Care market in North America is expected to garner significant business opportunities for the vendors during the forecast period.

US, Canada, Mexico, UK, Germany, France, Italy, The Netherlands, Spain, China, Japan, India, South Korea, Indonesia, Brazil, Saudi Arabia, Argentina, Australia, UAE, Colombia, South Africa, Israel, Turkey

  • Growing prevalence of cancer cases is the driving factor this market.

The Cancer Supportive Care market vendors should focus on grabbing business opportunities from the Therapeutic area segment as it accounted for the largest market share in the base year.