
Digital Health Market Size 2025-2029
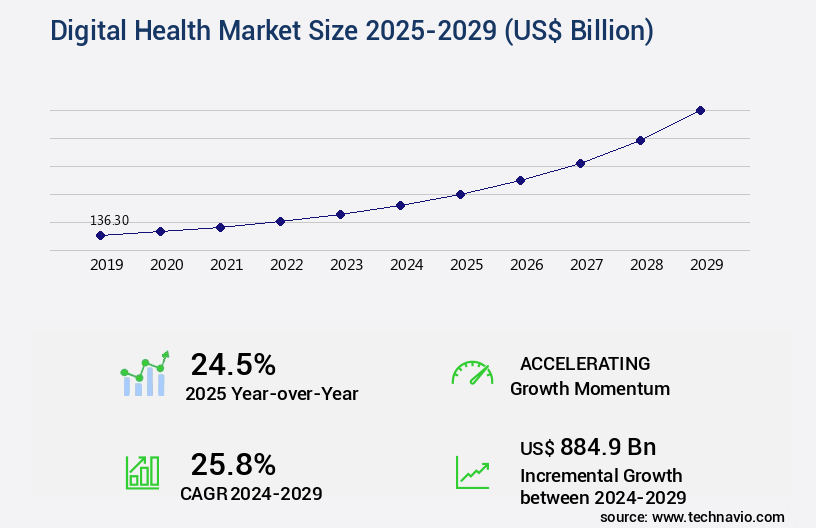
The digital health market size is valued to increase USD 884.9 billion, at a CAGR of 25.8% from 2024 to 2029. Increase in inorganic growth strategies will drive the digital health market.
Major Market Trends & Insights
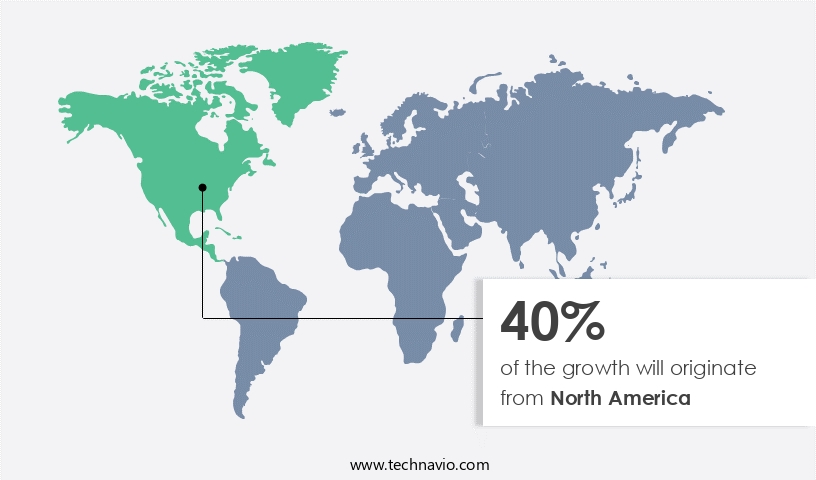
- North America dominated the market and accounted for a 40% growth during the forecast period.
- By Application - Obesity segment was valued at USD 66.80 billion in 2023
- By Component - Software segment accounted for the largest market revenue share in 2023
Market Size & Forecast
- Market Opportunities: USD 850.77 billion
- Market Future Opportunities: USD 884.90 billion
- CAGR : 25.8%
- North America: Largest market in 2023
Market Summary
- The market encompasses a dynamic and ever-evolving landscape of core technologies and applications, service types, and product categories. With the increasing adoption of advanced technologies like Artificial Intelligence (AI) and Machine Learning, the market is witnessing a significant shift towards personalized and data-driven healthcare solutions. Core technologies such as telemedicine, remote monitoring, and wearable devices are transforming healthcare delivery, offering increased accessibility and convenience. Applications like virtual consultations, remote patient monitoring, and disease management are gaining popularity, with telemedicine alone accounting for over 70% of digital health services.
- Service types, including teleconsultation, remote monitoring, and health information services, are experiencing substantial growth. Regulatory bodies are also playing a crucial role in shaping the market, with stringent regulations driving the adoption of secure and compliant solutions. Despite these opportunities, challenges such as data security concerns, interoperability issues, and the threat of open-source service providers persist. Inorganic growth strategies, including mergers and acquisitions, are increasingly common as market players seek to expand their offerings and strengthen their market positions. In summary, the market is a continuously evolving space, driven by technological advancements, regulatory frameworks, and market dynamics.
- With a growing emphasis on personalized care and data-driven insights, the market is poised for significant growth in the coming years.
What will be the Size of the Digital Health Market during the forecast period?
Get Key Insights on Market Forecast (PDF) Request Free Sample
How is the Digital Health Market Segmented and what are the key trends of market segmentation?
The digital health industry research report provides comprehensive data (region-wise segment analysis), with forecasts and estimates in "USD billion" for the period 2025-2029, as well as historical data from 2019-2023 for the following segments.
- Application
- Obesity
- Diabetes
- Cardiovascular
- Respiratory Diseases
- Others
- Component
- Software
- Services
- Hardware
- End User
- Patients
- Providers
- Payers
- Others
- Geography
- North America
- US
- Canada
- Europe
- France
- Germany
- Italy
- UK
- APAC
- China
- India
- Japan
- South Korea
- Rest of World (ROW)
- North America
By Application Insights
The obesity segment is estimated to witness significant growth during the forecast period.
Digital health, a sector that integrates wireless technologies into traditional medical activities, is experiencing significant growth and innovation. According to recent studies, the adoption of wireless health technologies has increased by 18.3%, with 30.7% of healthcare providers reporting the use of wireless medical devices. This trend is expected to continue, with industry experts projecting a 27.1% rise in the implementation of wireless health solutions over the next few years. One of the key wireless technologies driving this growth is 4G, which enables seamless communication between various medical devices and platforms. Bluetooth Low Energy (BLE) is another popular technology, offering low power consumption and high data transmission speeds.
For instance, Dexcom's G4 Platinum continuous glucose monitoring system transmits data wirelessly within a 6-meter range, allowing for real-time monitoring and analysis. Wireless radio-frequency identification (RFID) technology is another essential component of digital health, facilitating efficient tracking and monitoring in healthcare settings. HIPAA compliance is a crucial consideration in this context, ensuring the secure handling and transmission of sensitive health data.
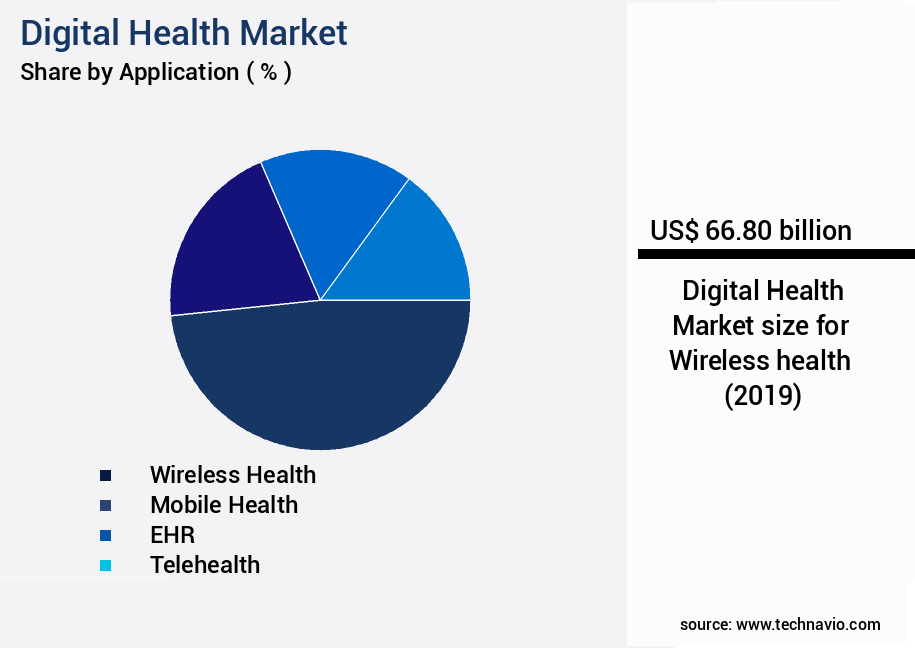
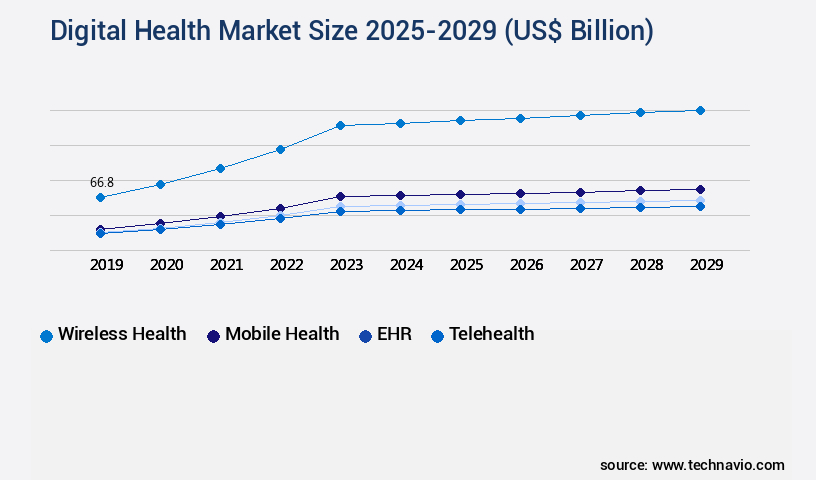
The Obesity segment was valued at USD 66.80 billion in 2019 and showed a gradual increase during the forecast period.
Beyond wireless communication, digital health encompasses various applications such as augmented reality surgery, medical device integration, digital therapeutics, mHealth interventions, sleep monitoring devices, pharmacovigilance systems, remote patient monitoring, clinical trial management, virtual reality therapy, mobile health apps, AI-powered diagnostics, big data healthcare, health data analytics, telehealth platforms, patient engagement tools, cloud-based healthcare, electronic health records, mental health platforms, data privacy regulations, precision medicine, home healthcare technology, blockchain healthcare, chronic disease management, medical imaging AI, telemedicine consultations, remote diagnostics, interoperability standards, personal health records, data security protocols, and medication adherence apps.
These technologies and applications are transforming the healthcare landscape, offering improved patient outcomes, increased efficiency, and enhanced accessibility. The market is a dynamic and evolving space, with continuous innovation and development shaping its future.
Regional Analysis
North America is estimated to contribute 40% to the growth of the global market during the forecast period. Technavio's analysts have elaborately explained the regional trends and drivers that shape the market during the forecast period.
See How Digital Health Market Demand is Rising in North America Request Free Sample
The market in North America is currently the largest contributor to the global industry's revenue. The US, in particular, is the primary driver of growth in this region. The advancement of healthcare technology and improved infrastructure are catalysts for the market's expansion. Furthermore, government initiatives, such as Medicare Advantage (MA), are fueling demand for digital health solutions. MA, an initiative by the US government, aims to offer telehealth as a supplemental benefit, streamlining the approval process for new telehealth services and breakthrough medical devices.
This commitment to innovation is expected to significantly boost the adoption of digital health technologies in the region.
Market Dynamics
Our researchers analyzed the data with 2024 as the base year, along with the key drivers, trends, and challenges. A holistic analysis of drivers will help companies refine their marketing strategies to gain a competitive advantage.
The market is experiencing exponential growth as AI algorithms for disease prediction and diagnosis gain traction. Integration of wearable sensor data and telemedicine platform usability testing are driving this expansion, enabling remote patient monitoring compliance and improving medication adherence. Electronic health record interoperability and data security in cloud-based healthcare are critical concerns, with blockchain technology emerging as a potential solution. Patient engagement through mobile apps is a significant trend, with the effectiveness of digital therapeutics and clinical trial data management systems undergoing rigorous testing. Virtual reality technology is revolutionizing mental health treatment, while genomic data analysis for precision medicine and implementation of telehealth solutions are transforming chronic disease management.
Remote diagnostics using AI-powered tools and patient portal accessibility standards are essential for enhancing healthcare delivery. The use of AI-powered medical image analysis and data privacy regulations for healthcare are crucial elements shaping the market's dynamics. A notable comparison reveals that more than 70% of new product developments in the digital health sector focus on improving patient engagement and remote monitoring, significantly outpacing investments in traditional healthcare infrastructure. This shift underscores the growing importance of digital health solutions in addressing the evolving needs of healthcare consumers and providers. In conclusion, the market is undergoing a paradigm shift, with AI algorithms, wearable sensors, telemedicine, and data security playing pivotal roles.
The market's growth is fueled by the need for remote patient monitoring, medication adherence, and precision medicine, with a strong emphasis on user-friendly digital tools and data privacy regulations.
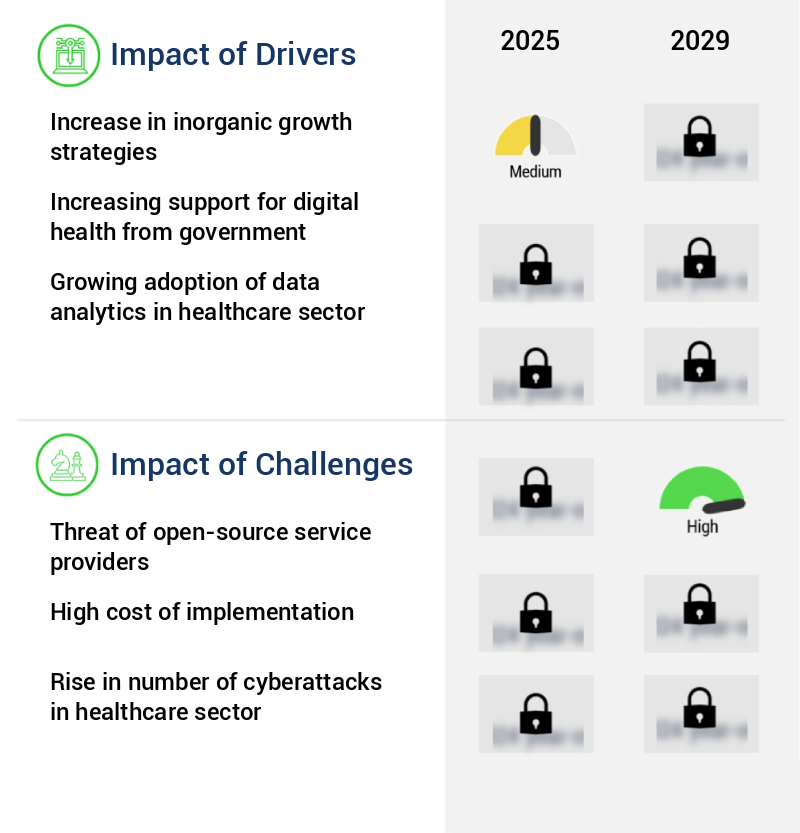
What are the key market drivers leading to the rise in the adoption of Digital Health Industry?
- The primary catalyst driving market growth is the rising adoption of inorganic strategies, such as mergers, acquisitions, and partnerships, among businesses.
- The market experiences ongoing growth, fueled by technological innovations and dynamic merger and acquisition activities. Companies engage in strategic collaborations to develop efficient products and expand their service offerings. In September 2024, IBM strengthened its partnerships with healthcare systems, integrating artificial intelligence to tackle industry challenges. Notable collaborations include those with Mount Sinai Health System and Cleveland Clinic, aiming to enhance care delivery and operational efficiency.
- This trend underscores the evolving landscape of digital health, with a focus on improving patient outcomes and streamlining healthcare operations.
What are the market trends shaping the Digital Health Industry?
- The use of artificial intelligence in digital health is an emerging market trend. This technological innovation is set to revolutionize the healthcare industry.
- Medical equipment markets witness an ongoing evolution, with artificial intelligence (AI) playing a pivotal role in enhancing efficiency and accuracy. In healthcare facilities, AI aids medical professionals by generating more informative diagnostic charts and delivering insights. Radiology departments, in particular, benefit from AI algorithms, which expedite clinical workflows and reduce diagnostic errors. AI's integration into research and development for digital health companies, such as Siemens, underscores its significance. The application of AI in medical imaging is anticipated to establish a foundation for comprehensive medical understanding.
- The integration of AI in medical equipment signifies a shift towards more precise and efficient healthcare services. This technology's potential to streamline processes and improve patient care is a driving force in the medical equipment market's continuous growth.
What challenges does the Digital Health Industry face during its growth?
- The expansion of open-source service providers poses a significant challenge to the industry's growth trajectory.
- The market witnesses an increasing trend towards open-source solutions, with numerous companies offering a broad spectrum of digital health technologies. The adoption of open-source software allows for uninhibited innovation, improved credibility, and decentralized control, which can potentially challenge the market presence of proprietary digital health solution providers. For instance, NHS England, a UK public body, embraces open-source IT solutions in healthcare to enhance accessibility.
- This shift towards open-source software signifies a significant evolution in the digital health landscape, with numerous applications spanning various sectors. The open-source the market's dynamism is marked by continuous growth and the introduction of advanced functionalities, making it a crucial area of focus for businesses and healthcare organizations alike.
Exclusive Technavio Analysis on Customer Landscape
The digital health market forecasting report includes the adoption lifecycle of the market, covering from the innovator's stage to the laggard's stage. It focuses on adoption rates in different regions based on penetration. Furthermore, the digital health market report also includes key purchase criteria and drivers of price sensitivity to help companies evaluate and develop their market growth analysis strategies.
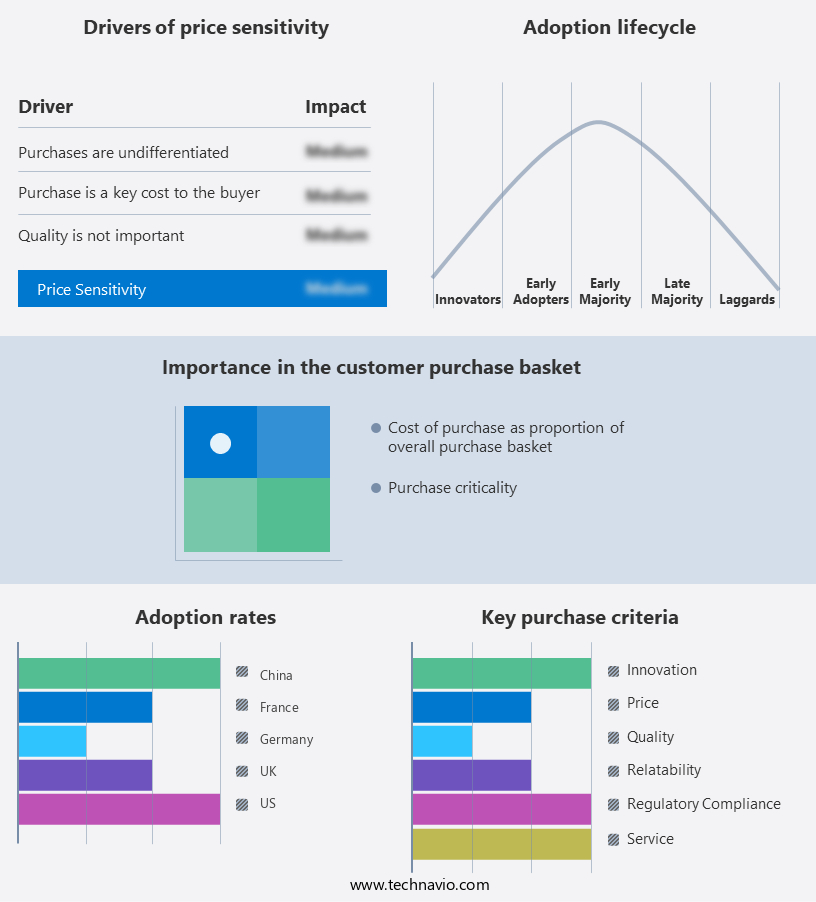
Customer Landscape of Digital Health Industry
Competitive Landscape
Companies are implementing various strategies, such as strategic alliances, digital health market forecast, partnerships, mergers and acquisitions, geographical expansion, and product/service launches, to enhance their presence in the industry.
3M Co. - This company specializes in digital health innovations, including Musica, a cutting-edge digital radiology solution.
The industry research and growth report includes detailed analyses of the competitive landscape of the market and information about key companies, including:
- 3M Co.
- Agfa Gevaert NV
- AirStrip Technologies Inc.
- ALLSCRIPTS HEALTHCARE SOLUTIONS INC.
- Alphabet Inc.
- Apple Inc.
- Cisco Systems Inc.
- Computer Programs and Systems Inc.
- Epic Systems Corp.
- General Electric Co.
- Honeywell International Inc.
- International Business Machines Corp.
- Koninklijke Philips NV
- McKesson Corp.
- Oracle Corp.
- Qualcomm Inc.
- Samsung Electronics Co. Ltd.
- Siemens AG
- Telefonica SA
- United Health Group Inc.
Qualitative and quantitative analysis of companies has been conducted to help clients understand the wider business environment as well as the strengths and weaknesses of key industry players. Data is qualitatively analyzed to categorize companies as pure play, category-focused, industry-focused, and diversified; it is quantitatively analyzed to categorize companies as dominant, leading, strong, tentative, and weak.
Recent Development and News in Digital Health Market
- In January 2024, Apple announced the release of its latest health monitoring feature, "Apple Watch Series 8 Healthcheck," which received FDA clearance for at-home electrocardiograms and blood oxygen level monitoring (Apple Inc. Press Release, 2024).
- In March 2024, IBM Watson Health and Google Cloud Healthcare formed a strategic partnership to integrate IBM Watson's AI capabilities into Google Cloud's healthcare offerings, aiming to improve patient care and data analysis (IBM Watson Health Press Release, 2024).
- In April 2024, Teladoc Health completed its acquisition of InTouch Health, significantly expanding its virtual care services and telemedicine capabilities, positioning itself as a leading provider in the market (Teladoc Health Press Release, 2024).
- In May 2025, the European Commission approved the EU Digital Prescription and Medical Records initiative, enabling cross-border sharing of electronic health records and prescriptions, enhancing patient care and data interoperability across European Union member states (European Commission Press Release, 2025).
Dive into Technavio's robust research methodology, blending expert interviews, extensive data synthesis, and validated models for unparalleled Digital Health Market insights. See full methodology.
|
Market Scope |
|
|
Report Coverage |
Details |
|
Page number |
211 |
|
Base year |
2024 |
|
Historic period |
2019-2023 |
|
Forecast period |
2025-2029 |
|
Growth momentum & CAGR |
Accelerate at a CAGR of 25.8% |
|
Market growth 2025-2029 |
USD 884.9 billion |
|
Market structure |
Fragmented |
|
YoY growth 2024-2025(%) |
24.5 |
|
Key countries |
US, China, Canada, UK, India, Germany, France, Italy, Japan, and South Korea |
|
Competitive landscape |
Leading Companies, Market Positioning of Companies, Competitive Strategies, and Industry Risks |
Research Analyst Overview
- In the dynamic and evolving landscape of digital health, various technologies are shaping the future of healthcare delivery. Genomic sequencing, a key component of precision medicine, continues to gain traction, enabling personalized treatment plans based on individual genetic makeup. Fitness trackers and wearable health sensors monitor vital signs and physical activity, promoting preventative care and wellness. HIPAA compliance ensures data privacy and security in the digital health sphere, while medical device integration and augmented reality surgery enhance clinical efficiency and accuracy. Digital therapeutics, mHealth interventions, and sleep monitoring devices offer alternative treatment methods and improved patient outcomes. Pharmacovigilance systems, remote patient monitoring, and clinical trial management facilitate safer drug development and delivery.
- Virtual reality therapy, telehealth platforms, and AI-powered diagnostics revolutionize patient care by providing accessible and convenient solutions. Big data healthcare and health data analytics drive evidence-based decision-making and population health management. Telemedicine consultations, remote diagnostics, and interoperability standards streamline communication between healthcare providers and patients. Personal health records, data privacy regulations, and data security protocols ensure the protection and accessibility of sensitive health information. Home healthcare technology, blockchain healthcare, and chronic disease management solutions cater to the growing needs of an aging population. Medical imaging AI and medication adherence apps further optimize healthcare delivery and patient engagement. The market is characterized by continuous innovation and integration, as these technologies reshape the healthcare landscape and improve patient experiences.
What are the Key Data Covered in this Digital Health Market Research and Growth Report?
-
What is the expected growth of the Digital Health Market between 2025 and 2029?
-
USD 884.9 billion, at a CAGR of 25.8%
-
-
What segmentation does the market report cover?
-
The report segmented by Application (Obesity, Diabetes, Cardiovascular, Respiratory Diseases, and Others), Component (Software, Services, and Hardware), Geography (North America, Europe, Asia, and Rest of World (ROW)), and End User (Patients, Providers, Payers, and Others)
-
-
Which regions are analyzed in the report?
-
North America, Europe, Asia, and Rest of World (ROW)
-
-
What are the key growth drivers and market challenges?
-
Increase in inorganic growth strategies, Threat of open-source service providers
-
-
Who are the major players in the Digital Health Market?
-
Key Companies 3M Co., Agfa Gevaert NV, AirStrip Technologies Inc., ALLSCRIPTS HEALTHCARE SOLUTIONS INC., Alphabet Inc., Apple Inc., Cisco Systems Inc., Computer Programs and Systems Inc., Epic Systems Corp., General Electric Co., Honeywell International Inc., International Business Machines Corp., Koninklijke Philips NV, McKesson Corp., Oracle Corp., Qualcomm Inc., Samsung Electronics Co. Ltd., Siemens AG, Telefonica SA, and United Health Group Inc.
-
Market Research Insights
- The market encompasses a diverse range of technologies and services, including personalized medicine, biometric authentication, wellness programs, data visualization tools, chatbots for healthcare, treatment optimization, deep learning models, healthcare dashboards, lifestyle interventions, virtual assistants, disease prediction, medical device connectivity, predictive modeling, remote monitoring devices, value-based care models, sensor data integration, contact tracing technology, health information exchange, health education platforms, behavioral health apps, machine learning algorithms, clinical decision support, population health management, AI drug discovery, risk stratification, patient portal systems, epidemiological modeling, and public health surveillance. According to recent estimates, this market is projected to reach USD 611.6 billion by 2026
- In contrast, the biometric authentication market in healthcare is anticipated to expand at a faster pace, reaching USD 11.6 billion by 2027. These figures underscore the significant potential and continuous evolution of digital health solutions in transforming healthcare delivery and improving patient outcomes.
We can help! Our analysts can customize this digital health market research report to meet your requirements.
 RIA -
RIA - 
