Canned Fruits Market Analysis APAC, Europe, North America, Middle East and Africa, South America - China, US, Germany, Japan, UK - Size and Forecast 2024-2028

Canned Fruits Market Analysis APAC, Europe, North America, Middle East and Africa, South America - China, US, Germany, Japan, UK - Size and Forecast 2024-2028

Published: Aug 2024 160 Pages SKU: IRTNTR76290

Market Overview at a Glance

$1.87 B
Market Opportunity
3.2%
CAGR
3.06
YoY growth 2023-2024(%)

Canned Fruits Market Size 2024-2028

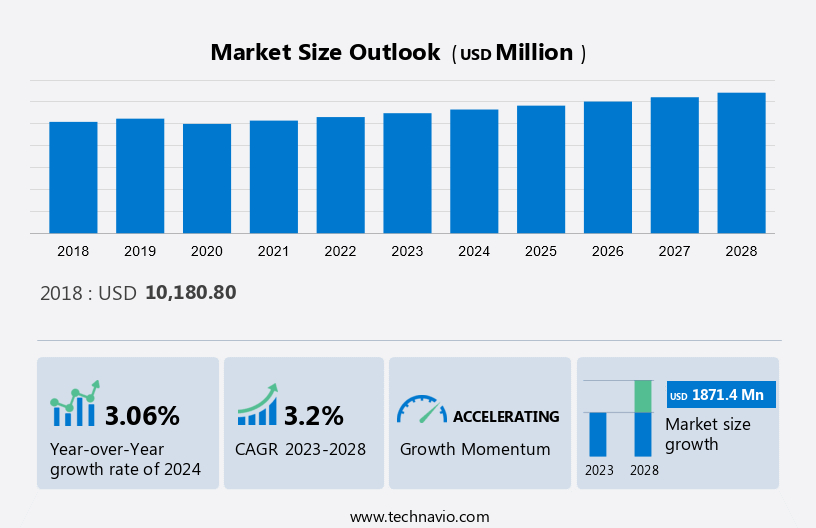
The canned fruits market size is forecast to increase by USD 1.87 billion between 2023 and 2028. accelerating at a CAGR of 3.2%. Market expansion hinges on several key factors, including the burgeoning realm of online retailing, which continues to witness robust growth. Simultaneously, the global market is experiencing a surge in product launches, catering to evolving consumer preferences and demands. Additionally, the modern pace of life, characterized by hectic schedules, is fueling a rising demand for convenience foods. These factors collectively drive the market forward, with consumers gravitating towards convenient options that align with their busy lifestyles. As online shopping becomes increasingly prevalent and canned fruits diversify their offerings, the market's trajectory is shaped by the intersection of innovation, consumer needs, and convenience, marking a significant evolution in the food retail landscape.

What will be the Size of the Market During the Forecast Period?

Canned Fruits Market Size

To learn more about this report, Download Report Sample

Market Dynamics

The market is thriving due to the efficiency of canning methods and the appeal of food products like canned fruits. This sector benefits from seasonality and the need for packaged fresh fruits that offer consistent nutritional value throughout the year. Sales of canned fruits are driven by their convenience, including their availability in air-tight cans and glass jars. These products are enriched with essential minerals, vitamins, and fiber, making them a healthy choice for diverse diets. The armed forces utilize canned fruits as part of their ration due to their long shelf life and durability. Regional markets see varied demand, influenced by factors such as frozen food options and the incorporation of animal food. The market growth and forecasting is also affected by the prevalence of microorganisms that can impact food safety.

Key Market Driver

Growth in online retailing is notably driving the canned fruits market growth. Rising internet penetration globally is leading to the growth of e-commerce businesses. E-commerce has provided new opportunities for companies in the canned fruits industry to boost their sales, extend their geographical presence, and enhance customer relations and profitability. Moreover, a rise in demand for convenient shopping, ease in searching for products, attractive deals, and tailored offers on products are expanding the demand for online shopping worldwide.

Moreover, in addition, the rising interest and choice for online shopping among consumers due to shopping convenience have led many manufacturers and distributors to emphasis more on sales through these online channels and e-commerce platforms. Further, such platforms help business-to-business (B2B) and business-to-consumer (B2C) operations. To support the hassle-free delivery of canned fruits to consumers, new businesses are improving supply chains and logistics. Such a trend is boosting companies to focus on the internet-savvy consumer segment and explore new online retail formats, which may drive the growth of the market during the forecast period.

Market Segment Trends

In the realm of canned fruits, Del Monte Foods has been a prominent player, offering a diverse range of products including the enticing Premium Gold Range featuring options like pineapple chunks and pineapple slices. The market segmentation is driven by various factors such as new product launches, catering to customer inclination towards organic food and clean-label products.Minimally processed food options are gaining traction among health-conscious consumers, focusing on nutritional properties like fiber, vitamins, and minerals. This resonates well with the increasing awareness among the vegetarian population seeking convenient products that align with their lifestyle preferences. While premium prices are associated with high-quality food from niche companies, effective pricing strategies consider household income variations and seasonal variations impacting the availability of fresh food.

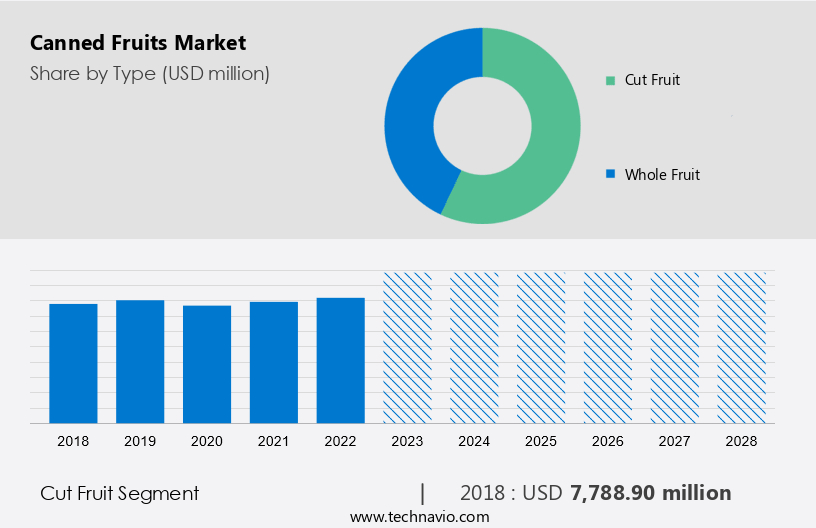
The Cut Fruit segment was the largest segment and valued at  USD 7.79 billion in 2018The primary stimulating aspects for the growth of the cut fruit segment of the market are rapid urbanization, changing food habits, rising income levels, and the rising significance of convenience food. Cans are specially made of aluminum and steel as they are non-toxic and can be recycled. Also, growing health concerns and the need to consume fruits as a part of a low-calorie diet are anticipated to drive segment growth.

Market  - Revenue Share by Cut Fruit Segment, 2018 - 2028.   

Canned Fruits Market Size

For more details on other segments, Download Sample Report 

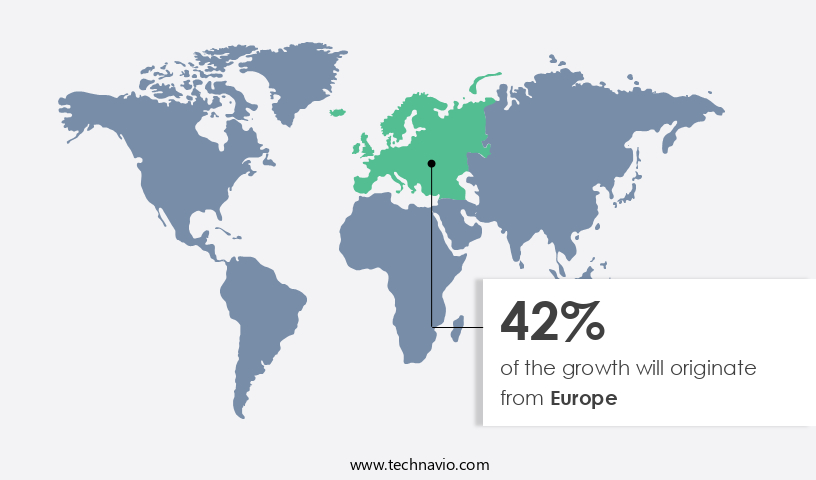
Europe is estimated to contribute 42% to the growth of the global market during the forecast period. Technavio’s analysts have elaborately explained the regional market trends and analysis and drivers that shape the market during the forecast period. Another region offering significant growth opportunities to companies is APAC. In APAC, the huge popularity of canned fruits among youngsters has expanded the consumption of canned fruits. Companies are expanding their market in the developing countries in APAC. New companies operating in the region are growing and strengthening their presence by establishing new varieties of canned fruit products. 

In addition, the increased economic development in the region has created job opportunities, which, in turn, has resulted in an affluent population base that is hard-pressed for time. Consumers majorly look for convenience in the region, even if it comes at an extra expense. There has been an increase in demand for canned fruits not only in Japan and South Korea but also in developing nations such as India and China which in turn drive the market growth in the region during the forecast period. 

Market Size, By Region, Global, 2018- 2028.   

Canned Fruits Market Share by Geography

To understand geographic trends Download Report Sample

Market Companies Overview

The Market is fragmented in nature. Some significant players include Ayam Sarl, Bikaner Polymers Pvt. Ltd, Campbell Soup Co., CHB Group, Del Monte Foods Inc., Delicia Foods India Pvt. Ltd., Dole plc,

The market research report also includes detailed analyses of the competitive landscape of the market and information about 15 market companies, including:

Knouse Foods Inc: The company offers canned fruits such as Shredded young green jackfruit in brine, Dole tropical gold pineapple pizza wedges, Fancy pineapple chunks.

Kwality Foods, Mitsubishi Corp., Revant Foods Pvt. Ltd., RFG Holdings Ltd., Seneca Foods Corp., Shandong Lixing Tin Food Co. Ltd., SunOpta Inc., The Kraft Heinz Co., Tiger Brands Ltd., Tropical Food Machinery srl, World Finer Foods LLC, and Conagra Brands Inc.

Segment Overview

The market research and growth report provides comprehensive data (region wise segment analysis), with forecasts and estimates in "USD Billion" for the period 2024 to 2028, as well as historical data from 2018 to 2022 for the following segments.

  • Type Outlook 
    • Cut fruit
    • Whole fruit
  • Distribution Channel Outlook 
    • Offline
    • Online
  • Region Outlook 
    • North America
      • The U.S.
      • Canada
    • South America
      • Chile 
      • Brazil
    • Europe
      • The U.K.
      • Germany
      • France
      • Rest of Europe
    • APAC
      • China
      • India
    • Middle East & Africa
      • Saudi Arabia
      • South Africa
      • Rest of the Middle East & Africa

You may also interested in below market reports:

  • Canned Food Market Analysis Europe, North America, APAC, Middle East and Africa, South America - US, China, Spain, UK, Japan - Size and Forecast 
  • Processed Fruits Market by Product and Geography - Forecast and Analysis
  • Canned Tuna Market Analysis Europe, North America, APAC, Middle East and Africa, South America - US, Spain, Germany, Japan, Canada - Size and Forecast 

Market Analyst Overview

The market is expanding due to advancements in canning technology and growing consumer demand for convenient food products. Canning preserves the nutritional value of fresh produce, offering preserved fruits in air-tight cans and glass jars. The COVID-19 pandemic has increased reliance on packaged fresh fruits and frozen food as staples. Regional markets are witnessing varied growth, influenced by factors such as seasonality and local preferences. Sales of canned fruits are also driven by celebrity endorsements and social media promotions, which boost product visibility. Furthermore, women’s employment and armed forces rationing contribute to increased animal food and food adulteration concerns, highlighting the importance of safe, long-lasting food storage solutions. 

In addition, the market is experiencing growth due to increased demand for ready-to-eat food products and portable storage methods. Juice-dipped canned fruits such as canned peaches, canned pineapples, canned mixed fruits, canned citrus fruits, canned pears, and canned oranges offer health benefits, especially for managing diabetes. These products are available in supermarkets/hypermarkets, convenience stores, specialty stores, and through independent retailers. Major industry players like Dole Foods Company, Rhodes Food Group, and Roland Foods are prominent in this sector. Regional markets, including Australia, Belgium, and the Netherlands, are expanding with variations in economic regions affecting price fluctuations and shelf life. The rise of working women and the need for convenient food options contribute to the increasing popularity of whole fruits and cut fruits.

Market Scope

Report Coverage

Details

Page number

160

Base year

2023

Historic period

2018-2022

Forecast period

2024-2028

Growth momentum & CAGR

Accelerate at a CAGR of 3.2%

Market growth 2024-2028

USD 1.87 billion

Market structure

Fragmented

YoY growth 2023-2024(%)

3.06

Regional analysis

APAC, Europe, North America, Middle East and Africa, and South America

Performing market contribution

Europe at 42%

Key countries

China, US, Germany, Japan, and UK

Competitive landscape

Leading Companies, Market Positioning of Companies, Competitive Strategies, and Industry Risks

Key companies profiled

Ayam Sarl, Bikaner Polymers Pvt. Ltd, Campbell Soup Co., CHB Group, Conagra Brands Inc., Del Monte Foods Inc., Delicia Foods India Pvt. Ltd., Dole plc, Knouse Foods Inc., Kwality Foods, Mitsubishi Corp., Revant Foods Pvt. Ltd., RFG Holdings Ltd, Seneca Foods Corp., Shandong Lixing Tin Food Co. Ltd., SunOpta Inc., The Kraft Heinz Co., Tiger Brands Ltd., Tropical Food Machinery srl, and World Finer Foods LLC

Market dynamics

Parent market growth analysis, Market Forecasting, Market growth inducers and obstacles, Fast-growing and slow-growing segment analysis, COVID-19 impact and recovery analysis and future consumer dynamics, and Market condition analysis for the market forecast period.

Customization purview

If our market report has not included the data that you are looking for, you can reach out to our analysts and get segments customized.

View PDF Sample

What are the Key Data Covered in this Market Research Report?

  • CAGR of the market during the forecast period
  • Detailed information on factors that will drive the growth of the market between 2024 and 2028
  • Precise estimation of the market  size and its contribution of the market in focus to the parent market
  • Accurate predictions about upcoming market growth and trends and changes in consumer behavior
  • Growth of the market industry across APAC, Europe, North America, Middle East and Africa, and South America
  • Thorough market forecast analysis of the market’s competitive landscape and detailed information about companies
  • Comprehensive market analysis and report analysis of factors that will challenge the growth of market companies

We can help! Our analysts can customize this market research report to meet your requirements. 

Get in touch

1 Executive Summary

  • 1.1 Market overview
    • Executive Summary - Chart on Market Overview
    • Executive Summary - Data Table on Market Overview
    • Executive Summary - Chart on Global Market Characteristics
    • Executive Summary - Chart on Market by Geography
    • Executive Summary - Chart on Market Segmentation by Type
    • Executive Summary - Chart on Market Segmentation by Distribution Channel
    • Executive Summary - Chart on Incremental Growth
    • Executive Summary - Data Table on Incremental Growth
    • Executive Summary - Chart on Company Market Positioning

2 Market Landscape

  • 2.1 Market ecosystem
    • Parent Market
    • Data Table on - Parent Market
  • 2.2 Market characteristics
    • Market characteristics analysis
  • 2.3 Value chain analysis
    • Value Chain Analysis

3 Market Sizing

  • 3.1 Market definition
    • Offerings of companies included in the market definition
  • 3.2 Market segment analysis
    • Market segments
  • 3.3 Market size 2023
    • 3.4 Market outlook: Forecast for 2023-2028
      • Chart on Global - Market size and forecast 2023-2028 ($ million)
      • Data Table on Global - Market size and forecast 2023-2028 ($ million)
      • Chart on Global Market: Year-over-year growth 2023-2028 (%)
      • Data Table on Global Market: Year-over-year growth 2023-2028 (%)

    4 Historic Market Size

    • 4.1 Global Canned Fruits Market 2018 - 2022
      • Historic Market Size - Data Table on Global Canned Fruits Market 2018 - 2022 ($ million)
    • 4.2 Type segment analysis 2018 - 2022
      • Historic Market Size - Type Segment 2018 - 2022 ($ million)
    • 4.3 Distribution Channel segment analysis 2018 - 2022
      • Historic Market Size - Distribution Channel Segment 2018 - 2022 ($ million)
    • 4.4 Geography segment analysis 2018 - 2022
      • Historic Market Size - Geography Segment 2018 - 2022 ($ million)
    • 4.5 Country segment analysis 2018 - 2022
      • Historic Market Size - Country Segment 2018 - 2022 ($ million)

    5 Five Forces Analysis

    • 5.1 Five forces summary
      • Five forces analysis - Comparison between 2023 and 2028
    • 5.2 Bargaining power of buyers
      • Bargaining power of buyers - Impact of key factors 2023 and 2028
    • 5.3 Bargaining power of suppliers
      • Bargaining power of suppliers - Impact of key factors in 2023 and 2028
    • 5.4 Threat of new entrants
      • Threat of new entrants - Impact of key factors in 2023 and 2028
    • 5.5 Threat of substitutes
      • Threat of substitutes - Impact of key factors in 2023 and 2028
    • 5.6 Threat of rivalry
      • Threat of rivalry - Impact of key factors in 2023 and 2028
    • 5.7 Market condition
      • Chart on Market condition - Five forces 2023 and 2028

    6 Market Segmentation by Type

    • 6.1 Market segments
      • Chart on Type - Market share 2023-2028 (%)
      • Data Table on Type - Market share 2023-2028 (%)
    • 6.2 Comparison by Type
      • Chart on Comparison by Type
      • Data Table on Comparison by Type
    • 6.3 Cut fruit - Market size and forecast 2023-2028
      • Chart on Cut fruit - Market size and forecast 2023-2028 ($ million)
      • Data Table on Cut fruit - Market size and forecast 2023-2028 ($ million)
      • Chart on Cut fruit - Year-over-year growth 2023-2028 (%)
      • Data Table on Cut fruit - Year-over-year growth 2023-2028 (%)
    • 6.4 Whole fruit - Market size and forecast 2023-2028
      • Chart on Whole fruit - Market size and forecast 2023-2028 ($ million)
      • Data Table on Whole fruit - Market size and forecast 2023-2028 ($ million)
      • Chart on Whole fruit - Year-over-year growth 2023-2028 (%)
      • Data Table on Whole fruit - Year-over-year growth 2023-2028 (%)
    • 6.5 Market opportunity by Type
      • Market opportunity by Type ($ million)
      • Data Table on Market opportunity by Type ($ million)

    7 Market Segmentation by Distribution Channel

    • 7.1 Market segments
      • Chart on Distribution Channel - Market share 2023-2028 (%)
      • Data Table on Distribution Channel - Market share 2023-2028 (%)
    • 7.2 Comparison by Distribution Channel
      • Chart on Comparison by Distribution Channel
      • Data Table on Comparison by Distribution Channel
    • 7.3 Offline - Market size and forecast 2023-2028
      • Chart on Offline - Market size and forecast 2023-2028 ($ million)
      • Data Table on Offline - Market size and forecast 2023-2028 ($ million)
      • Chart on Offline - Year-over-year growth 2023-2028 (%)
      • Data Table on Offline - Year-over-year growth 2023-2028 (%)
    • 7.4 Online - Market size and forecast 2023-2028
      • Chart on Online - Market size and forecast 2023-2028 ($ million)
      • Data Table on Online - Market size and forecast 2023-2028 ($ million)
      • Chart on Online - Year-over-year growth 2023-2028 (%)
      • Data Table on Online - Year-over-year growth 2023-2028 (%)
    • 7.5 Market opportunity by Distribution Channel
      • Market opportunity by Distribution Channel ($ million)
      • Data Table on Market opportunity by Distribution Channel ($ million)

    8 Customer Landscape

    • 8.1 Customer landscape overview
      • Analysis of price sensitivity, lifecycle, customer purchase basket, adoption rates, and purchase criteria

    9 Geographic Landscape

    • 9.1 Geographic segmentation
      • Chart on Market share by geography 2023-2028 (%)
      • Data Table on Market share by geography 2023-2028 (%)
    • 9.2 Geographic comparison
      • Chart on Geographic comparison
      • Data Table on Geographic comparison
    • 9.3 APAC - Market size and forecast 2023-2028
      • Chart on APAC - Market size and forecast 2023-2028 ($ million)
      • Data Table on APAC - Market size and forecast 2023-2028 ($ million)
      • Chart on APAC - Year-over-year growth 2023-2028 (%)
      • Data Table on APAC - Year-over-year growth 2023-2028 (%)
    • 9.4 Europe - Market size and forecast 2023-2028
      • Chart on Europe - Market size and forecast 2023-2028 ($ million)
      • Data Table on Europe - Market size and forecast 2023-2028 ($ million)
      • Chart on Europe - Year-over-year growth 2023-2028 (%)
      • Data Table on Europe - Year-over-year growth 2023-2028 (%)
    • 9.5 North America - Market size and forecast 2023-2028
      • Chart on North America - Market size and forecast 2023-2028 ($ million)
      • Data Table on North America - Market size and forecast 2023-2028 ($ million)
      • Chart on North America - Year-over-year growth 2023-2028 (%)
      • Data Table on North America - Year-over-year growth 2023-2028 (%)
    • 9.6 Middle East and Africa - Market size and forecast 2023-2028
      • Chart on Middle East and Africa - Market size and forecast 2023-2028 ($ million)
      • Data Table on Middle East and Africa - Market size and forecast 2023-2028 ($ million)
      • Chart on Middle East and Africa - Year-over-year growth 2023-2028 (%)
      • Data Table on Middle East and Africa - Year-over-year growth 2023-2028 (%)
    • 9.7 South America - Market size and forecast 2023-2028
      • Chart on South America - Market size and forecast 2023-2028 ($ million)
      • Data Table on South America - Market size and forecast 2023-2028 ($ million)
      • Chart on South America - Year-over-year growth 2023-2028 (%)
      • Data Table on South America - Year-over-year growth 2023-2028 (%)
    • 9.8 China - Market size and forecast 2023-2028
      • Chart on China - Market size and forecast 2023-2028 ($ million)
      • Data Table on China - Market size and forecast 2023-2028 ($ million)
      • Chart on China - Year-over-year growth 2023-2028 (%)
      • Data Table on China - Year-over-year growth 2023-2028 (%)
    • 9.9 US - Market size and forecast 2023-2028
      • Chart on US - Market size and forecast 2023-2028 ($ million)
      • Data Table on US - Market size and forecast 2023-2028 ($ million)
      • Chart on US - Year-over-year growth 2023-2028 (%)
      • Data Table on US - Year-over-year growth 2023-2028 (%)
    • 9.10 Germany - Market size and forecast 2023-2028
      • Chart on Germany - Market size and forecast 2023-2028 ($ million)
      • Data Table on Germany - Market size and forecast 2023-2028 ($ million)
      • Chart on Germany - Year-over-year growth 2023-2028 (%)
      • Data Table on Germany - Year-over-year growth 2023-2028 (%)
    • 9.11 Japan - Market size and forecast 2023-2028
      • Chart on Japan - Market size and forecast 2023-2028 ($ million)
      • Data Table on Japan - Market size and forecast 2023-2028 ($ million)
      • Chart on Japan - Year-over-year growth 2023-2028 (%)
      • Data Table on Japan - Year-over-year growth 2023-2028 (%)
    • 9.12 UK - Market size and forecast 2023-2028
      • Chart on UK - Market size and forecast 2023-2028 ($ million)
      • Data Table on UK - Market size and forecast 2023-2028 ($ million)
      • Chart on UK - Year-over-year growth 2023-2028 (%)
      • Data Table on UK - Year-over-year growth 2023-2028 (%)
    • 9.13 Market opportunity by geography
      • Market opportunity by geography ($ million)
      • Data Tables on Market opportunity by geography ($ million)

    10 Drivers, Challenges, and Opportunity/Restraints

    • 10.1 Market drivers
      • 10.2 Market challenges
        • 10.3 Impact of drivers and challenges
          • Impact of drivers and challenges in 2023 and 2028
        • 10.4 Market opportunities/restraints

          11 Competitive Landscape

          • 11.1 Overview
            • 11.2 Competitive Landscape
              • Overview on criticality of inputs and factors of differentiation
            • 11.3 Landscape disruption
              • Overview on factors of disruption
            • 11.4 Industry risks
              • Impact of key risks on business

            12 Competitive Analysis

            • 12.1 Companies profiled
              • Companies covered
            • 12.2 Market positioning of companies
              • Matrix on companies position and classification
            • 12.3 Ayam Sarl
              • Ayam Sarl - Overview
              • Ayam Sarl - Product / Service
              • Ayam Sarl - Key offerings
            • 12.4 CHB Group
              • CHB Group - Overview
              • CHB Group - Product / Service
              • CHB Group - Key offerings
            • 12.5 Conagra Brands Inc.
              • Conagra Brands Inc. - Overview
              • Conagra Brands Inc. - Business segments
              • Conagra Brands Inc. - Key news
              • Conagra Brands Inc. - Key offerings
              • Conagra Brands Inc. - Segment focus
            • 12.6 Del Monte Foods Inc.
              • Del Monte Foods Inc. - Overview
              • Del Monte Foods Inc. - Product / Service
              • Del Monte Foods Inc. - Key offerings
            • 12.7 Delicia Foods India Pvt. Ltd.
              • Delicia Foods India Pvt. Ltd. - Overview
              • Delicia Foods India Pvt. Ltd. - Product / Service
              • Delicia Foods India Pvt. Ltd. - Key offerings
            • 12.8 Dole plc
              • Dole plc - Overview
              • Dole plc - Business segments
              • Dole plc - Key offerings
              • Dole plc - Segment focus
            • 12.9 Mitsubishi Corp.
              • Mitsubishi Corp. - Overview
              • Mitsubishi Corp. - Business segments
              • Mitsubishi Corp. - Key news
              • Mitsubishi Corp. - Key offerings
              • Mitsubishi Corp. - Segment focus
            • 12.10 RFG Holdings Ltd
              • RFG Holdings Ltd - Overview
              • RFG Holdings Ltd - Business segments
              • RFG Holdings Ltd - Key offerings
              • RFG Holdings Ltd - Segment focus
            • 12.11 Seneca Foods Corp.
              • Seneca Foods Corp. - Overview
              • Seneca Foods Corp. - Product / Service
              • Seneca Foods Corp. - Key offerings
            • 12.12 Shandong Lixing Tin Food Co. Ltd.
              • Shandong Lixing Tin Food Co. Ltd. - Overview
              • Shandong Lixing Tin Food Co. Ltd. - Product / Service
              • Shandong Lixing Tin Food Co. Ltd. - Key offerings
            • 12.13 SunOpta Inc.
              • SunOpta Inc. - Overview
              • SunOpta Inc. - Business segments
              • SunOpta Inc. - Key news
              • SunOpta Inc. - Key offerings
              • SunOpta Inc. - Segment focus
            • 12.14 The Kraft Heinz Co.
              • The Kraft Heinz Co. - Overview
              • The Kraft Heinz Co. - Business segments
              • The Kraft Heinz Co. - Key news
              • The Kraft Heinz Co. - Key offerings
              • The Kraft Heinz Co. - Segment focus
            • 12.15 Tiger Brands Ltd.
              • Tiger Brands Ltd. - Overview
              • Tiger Brands Ltd. - Product / Service
              • Tiger Brands Ltd. - Key offerings
            • 12.16 Tropical Food Machinery srl
              • Tropical Food Machinery srl - Overview
              • Tropical Food Machinery srl - Product / Service
              • Tropical Food Machinery srl - Key offerings
            • 12.17 World Finer Foods LLC
              • World Finer Foods LLC - Overview
              • World Finer Foods LLC - Product / Service
              • World Finer Foods LLC - Key offerings

            13 Appendix

            • 13.1 Scope of the report
              • 13.2 Inclusions and exclusions checklist
                • Inclusions checklist
                • Exclusions checklist
              • 13.3 Currency conversion rates for US$
                • Currency conversion rates for US$
              • 13.4 Research methodology
                • Research methodology
              • 13.5 Data procurement
                • Information sources
              • 13.6 Data validation
                • Data validation
              • 13.7 Validation techniques employed for market sizing
                • Validation techniques employed for market sizing
              • 13.8 Data synthesis
                • Data synthesis
              • 360 degree market analysis
                • 360 degree market analysis
              • 13.10 List of abbreviations
                • List of abbreviations

              Research Methodology

              Technavio presents a detailed picture of the market by way of study, synthesis, and summation of data from multiple sources. The analysts have presented the various facets of the market with a particular focus on identifying the key industry influencers. The data thus presented is comprehensive, reliable, and the result of extensive research, both primary and secondary.

              INFORMATION SOURCES

              Primary sources

              • Manufacturers and suppliers
              • Channel partners
              • Industry experts
              • Strategic decision makers

              Secondary sources

              • Industry journals and periodicals
              • Government data
              • Financial reports of key industry players
              • Historical data
              • Press releases

              DATA ANALYSIS

              Data Synthesis

              • Collation of data
              • Estimation of key figures
              • Analysis of derived insights

              Data Validation

              • Triangulation with data models
              • Reference against proprietary databases
              • Corroboration with industry experts

              REPORT WRITING

              Qualitative

              • Market drivers
              • Market challenges
              • Market trends
              • Five forces analysis

              Quantitative

              • Market size and forecast
              • Market segmentation
              • Geographical insights
              • Competitive landscape

              Interested in this report?

              Get your sample now to see our research methodology and insights!

              Download Now

              Frequently Asked Questions

              Canned Fruits market growth will increase by $ 1871.4 mn during 2024-2028 .

              The Canned Fruits market is expected to grow at a CAGR of 3.2% during 2024-2028 .

              Canned Fruits market is segmented by Type( Cut fruit, Whole fruit) Distribution Channel( Offline, Online)

              Ayam Sarl, Bikaner Polymers Pvt. Ltd, Campbell Soup Co., CHB Group, Conagra Brands Inc., Del Monte Foods Inc., Delicia Foods India Pvt. Ltd., Dole plc, Knouse Foods Inc., Kwality Foods, Mitsubishi Corp., Revant Foods Pvt. Ltd., RFG Holdings Ltd, Seneca Foods Corp., Shandong Lixing Tin Food Co. Ltd., SunOpta Inc., The Kraft Heinz Co., Tiger Brands Ltd., Tropical Food Machinery srl, World Finer Foods LLC are a few of the key vendors in the Canned Fruits market.

              Europe will register the highest growth rate of 42% among the other regions. Therefore, the Canned Fruits market in Europe is expected to garner significant business opportunities for the vendors during the forecast period.

              China, US, Germany, Japan, UK

              • Growth in online retailingIncreasing internet penetration worldwide is leading to the growth of e-commerce businesses across the world. A rise in demand for convenient shopping is the driving factor this market.
              • ease in searching for products is the driving factor this market.
              • attractive deals is the driving factor this market.
              • and tailored offers on products are increasing the demand for online shopping globally. Online retailing has provided opportunities for vendors in the canned fruits industry to increase their sales is the driving factor this market.
              • expand their geographical presence is the driving factor this market.
              • and improve customer relations and profitability. An online presence allows manufacturers and distributors to improve their product visibility across geographies. With greater geographic coverage is the driving factor this market.
              • vendors can explore opportunities in new and emerging markets. The growing interest and preference for online shopping among consumers is the driving factor this market.
              • owing to shopping convenience is the driving factor this market.
              • have led many manufacturers and distributors to focus on sales through online channels and e-commerce platforms. Additionally is the driving factor this market.
              • online and e-commerce channels support business-to-business (B2B) and business-to-consumer (B2C) operations. New businesses are improving supply chains and logistics to support the hassle-free delivery of canned fruits to consumers. The growing number of online shoppers across the world may increase the sales of canned fruit products through online channels. This trend is encouraging vendors to concentrate on the internet-savvy consumer segment and explore new online retail formats is the driving factor this market.
              • which may boost the growth of the global canned fruits market during the forecast period. is the driving factor this market.

              The Canned Fruits market vendors should focus on grabbing business opportunities from the Cut fruit segment as it accounted for the largest market share in the base year.