Processed Fruits Market Analysis, Size, and Forecast 2025-2029: APAC (India, China, and Japan), Europe (Germany, UK, and France), North America (US, Canada, and Mexico), Middle East and Africa (Saudi Arabia, UAE, and South Africa), South America (Brazil and Argentina), and Rest of World (ROW)

Processed Fruits Market Analysis, Size, and Forecast 2025-2029:
APAC (India, China, and Japan), Europe (Germany, UK, and France), North America (US, Canada, and Mexico), Middle East and Africa (Saudi Arabia, UAE, and South Africa), South America (Brazil and Argentina), and Rest of World (ROW)

Published: Dec 2025 288 Pages SKU: IRTNTR73884

Market Overview at a Glance

$216.3 B
Market Opportunity
7.9%
CAGR 2024 - 2029
52.3%
APAC Growth
$243.4 B
Fresh cut segment 2023

Processed Fruits Market Size 2025-2029

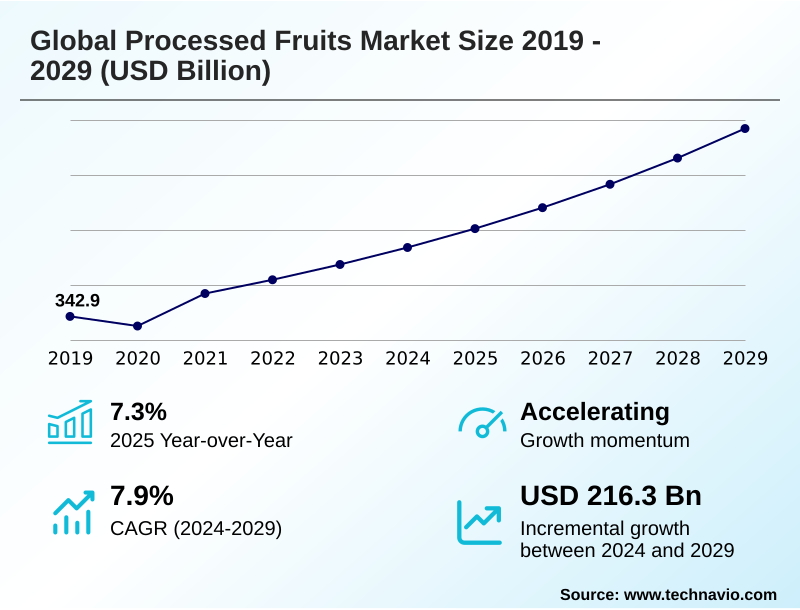
The processed fruits market size is valued to increase by USD 216.3 billion, at a CAGR of 7.9% from 2024 to 2029. Increase in demand for processed fruits will drive the processed fruits market.

Major Market Trends & Insights

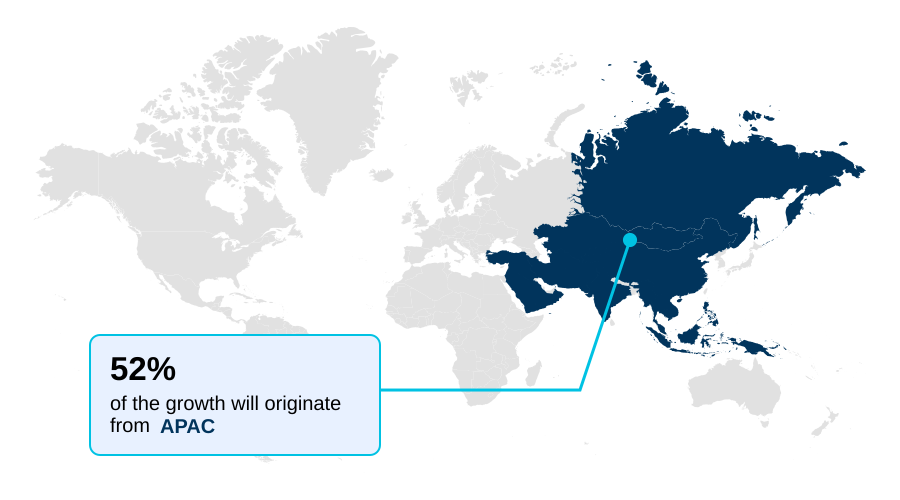
  • APAC dominated the market and accounted for a 52.3% growth during the forecast period.
  • By Product - Fresh cut segment was valued at USD 243.4 billion in 2023
  • By Category - Berries segment accounted for the largest market revenue share in 2023

Market Size & Forecast

  • Market Opportunities: USD 341.6 billion
  • Market Future Opportunities: USD 216.3 billion
  • CAGR from 2024 to 2029 : 7.9%

Market Summary

What will be the Size of the Processed Fruits Market during the forecast period?

Get Key Insights on Market Forecast (PDF) Request Free Sample

How is the Processed Fruits Market Segmented?

The processed fruits industry research report provides comprehensive data (region-wise segment analysis), with forecasts and estimates in "USD billion" for the period 2025-2029, as well as historical data from 2019-2023 for the following segments.
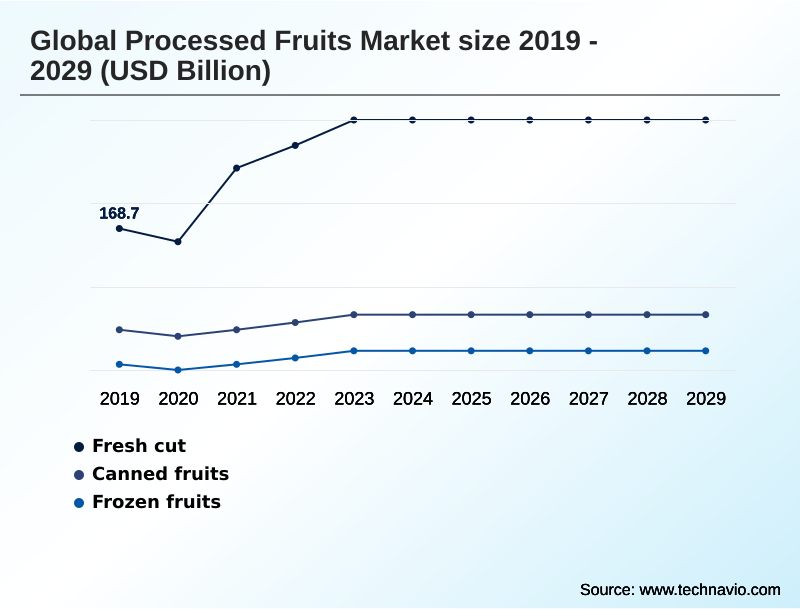
  • Product
    • Fresh cut
    • Canned fruits
    • Frozen fruits
  • Category
    • Berries
    • Citrus fruits
    • Tropical fruits
  • Distribution channel
    • Offline
    • Online
  • Geography
    • APAC
      • India
      • China
      • Japan
    • Europe
      • Germany
      • UK
      • France
    • North America
      • US
      • Canada
      • Mexico
    • Middle East and Africa
      • Saudi Arabia
      • UAE
      • South Africa
    • South America
      • Brazil
      • Argentina
    • Rest of World (ROW)

By Product Insights

The fresh cut segment is estimated to witness significant growth during the forecast period.

Request Free Sample

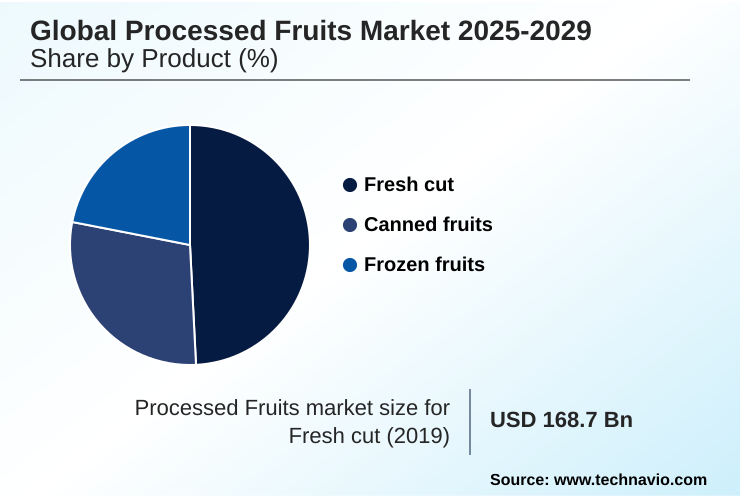
The Fresh cut segment was valued at USD 243.4 billion in 2023 and showed a gradual increase during the forecast period.

Request Free Sample

Regional Analysis

APAC is estimated to contribute 52.3% to the growth of the global market during the forecast period.Technavio’s analysts have elaborately explained the regional trends and drivers that shape the market during the forecast period.

See How Processed Fruits Market Demand is Rising in APAC Request Free Sample

Market Dynamics

Our researchers analyzed the data with 2024 as the base year, along with the key drivers, trends, and challenges. A holistic analysis of drivers will help companies refine their marketing strategies to gain a competitive advantage.

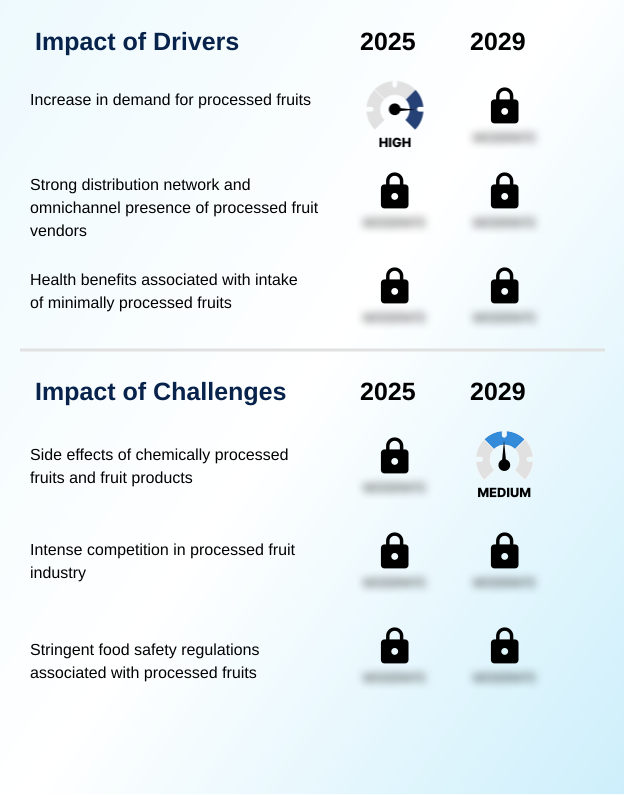
What are the key market drivers leading to the rise in the adoption of Processed Fruits Industry?

What are the market trends shaping the Processed Fruits Industry?

What challenges does the Processed Fruits Industry face during its growth?

Exclusive Technavio Analysis on Customer Landscape

The processed fruits market forecasting report includes the adoption lifecycle of the market, covering from the innovator’s stage to the laggard’s stage. It focuses on adoption rates in different regions based on penetration. Furthermore, the processed fruits market report also includes key purchase criteria and drivers of price sensitivity to help companies evaluate and develop their market growth analysis strategies.

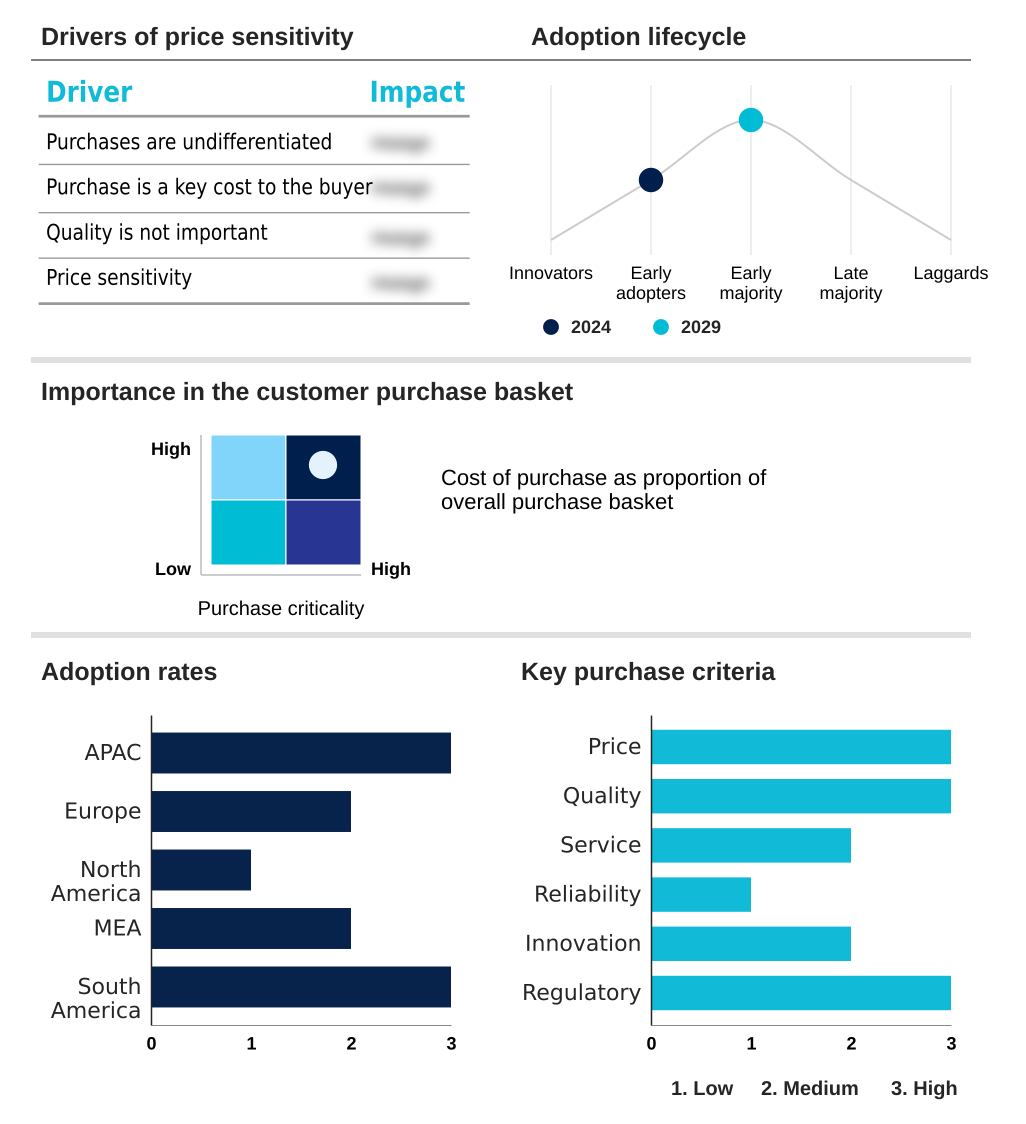
Customer Landscape of Processed Fruits Industry

Competitive Landscape

Companies are implementing various strategies, such as strategic alliances, processed fruits market forecast, partnerships, mergers and acquisitions, geographical expansion, and product/service launches, to enhance their presence in the industry.

AGRANA Beteiligungs AG -

The industry research and growth report includes detailed analyses of the competitive landscape of the market and information about key companies, including:

  • AGRANA Beteiligungs AG
  • Aohata Corp.
  • Calavo Growers Inc.
  • Capricorn Food Products India Ltd.
  • CHB Group
  • Del Monte Foods Inc.
  • Delicia Foods India Pvt. Ltd.
  • Dole plc
  • Mysore Fruit Products Pvt. Ltd.
  • Ninos Fresh Cut Fruit and Veg LLC
  • RFG Holdings Ltd.
  • Royal Ridge Fruits
  • Speyfruit Ltd.
  • Sysco Corp.
  • US Foods Holding Corp.

Qualitative and quantitative analysis of companies has been conducted to help clients understand the wider business environment as well as the strengths and weaknesses of key industry players. Data is qualitatively analyzed to categorize companies as pure play, category-focused, industry-focused, and diversified; it is quantitatively analyzed to categorize companies as dominant, leading, strong, tentative, and weak.

Recent Development and News in Processed fruits market

Dive into Technavio’s robust research methodology, blending expert interviews, extensive data synthesis, and validated models for unparalleled Processed Fruits Market insights. See full methodology.

Market Scope
Page number 288
Base year 2024
Historic period 2019-2023
Forecast period 2025-2029
Growth momentum & CAGR Accelerate at a CAGR of 7.9%
Market growth 2025-2029 USD 216.3 billion
Market structure Fragmented
YoY growth 2024-2025(%) 7.3%
Key countries India, China, Japan, South Korea, Australia, Indonesia, Germany, UK, France, Italy, Spain, The Netherlands, US, Canada, Mexico, Saudi Arabia, UAE, South Africa, Egypt, Nigeria, Brazil, Argentina and Chile
Competitive landscape Leading Companies, Market Positioning of Companies, Competitive Strategies, and Industry Risks

Request Free Sample

Research Analyst Overview

What are the Key Data Covered in this Processed Fruits Market Research and Growth Report?

  • What is the expected growth of the Processed Fruits Market between 2025 and 2029?

    • USD 216.3 billion, at a CAGR of 7.9%

  • What segmentation does the market report cover?

    • The report is segmented by Product (Fresh cut, Canned fruits, and Frozen fruits), Category (Berries, Citrus fruits, and Tropical fruits), Distribution Channel (Offline, and Online) and Geography (APAC, Europe, North America, Middle East and Africa, South America)

  • Which regions are analyzed in the report?

    • APAC, Europe, North America, Middle East and Africa and South America

  • What are the key growth drivers and market challenges?

    • Increase in demand for processed fruits, Side effects of chemically processed fruits and fruit products

  • Who are the major players in the Processed Fruits Market?

    • AGRANA Beteiligungs AG, Aohata Corp., Calavo Growers Inc., Capricorn Food Products India Ltd., CHB Group, Del Monte Foods Inc., Delicia Foods India Pvt. Ltd., Dole plc, Mysore Fruit Products Pvt. Ltd., Ninos Fresh Cut Fruit and Veg LLC, RFG Holdings Ltd., Royal Ridge Fruits, Speyfruit Ltd., Sysco Corp. and US Foods Holding Corp.

Market Research Insights

We can help! Our analysts can customize this processed fruits market research report to meet your requirements.

Get in touch

1. Executive Summary

1.1 Market overview

Executive Summary - Chart on Market Overview
Executive Summary - Data Table on Market Overview
Executive Summary - Chart on Global Market Characteristics
Executive Summary - Chart on Market by Geography
Executive Summary - Chart on Market Segmentation by Product
Executive Summary - Chart on Market Segmentation by Category
Executive Summary - Chart on Market Segmentation by Distribution Channel
Executive Summary - Chart on Incremental Growth
Executive Summary - Data Table on Incremental Growth
Executive Summary - Chart on Company Market Positioning

2. Technavio Analysis

2.1 Analysis of price sensitivity, lifecycle, customer purchase basket, adoption rates, and purchase criteria

2.2 Criticality of inputs and Factors of differentiation

Chart on Overview on criticality of inputs and factors of differentiation

2.3 Factors of disruption

Chart on Overview on factors of disruption

2.4 Impact of drivers and challenges

Chart on Impact of drivers and challenges in 2024 and 2029

3. Market Landscape

3.1 Market ecosystem

Chart on Parent Market
Data Table on - Parent Market

3.2 Market characteristics

Chart on Market characteristics analysis

3.3 Value chain analysis

Chart on Value chain analysis

4. Market Sizing

4.1 Market definition

Data Table on Offerings of companies included in the market definition

4.2 Market segment analysis

Market segments

4.3 Market size 2024

4.4 Market outlook: Forecast for 2024-2029

Chart on Global - Market size and forecast 2024-2029 ($ billion)
Data Table on Global - Market size and forecast 2024-2029 ($ billion)
Chart on Global Market: Year-over-year growth 2024-2029 (%)
Data Table on Global Market: Year-over-year growth 2024-2029 (%)

5. Historic Market Size

5.1 Global Processed Fruits Market 2019 - 2023

Historic Market Size - Data Table on Global Processed Fruits Market 2019 - 2023 ($ billion)

5.2 Product segment analysis 2019 - 2023

Historic Market Size - Product Segment 2019 - 2023 ($ billion)

5.3 Category segment analysis 2019 - 2023

Historic Market Size - Category Segment 2019 - 2023 ($ billion)

5.4 Distribution Channel segment analysis 2019 - 2023

Historic Market Size - Distribution Channel Segment 2019 - 2023 ($ billion)

5.5 Geography segment analysis 2019 - 2023

Historic Market Size - Geography Segment 2019 - 2023 ($ billion)

5.6 Country segment analysis 2019 - 2023

Historic Market Size - Country Segment 2019 - 2023 ($ billion)

6. Qualitative Analysis

6.1 The AI impact on global processed fruits market

7. Five Forces Analysis

7.1 Five forces summary

Five forces analysis - Comparison between 2024 and 2029

7.2 Bargaining power of buyers

Bargaining power of buyers - Impact of key factors 2024 and 2029

7.3 Bargaining power of suppliers

Bargaining power of suppliers - Impact of key factors in 2024 and 2029

7.4 Threat of new entrants

Threat of new entrants - Impact of key factors in 2024 and 2029

7.5 Threat of substitutes

Threat of substitutes - Impact of key factors in 2024 and 2029

7.6 Threat of rivalry

Threat of rivalry - Impact of key factors in 2024 and 2029

7.7 Market condition

Chart on Market condition - Five forces 2024 and 2029

8. Market Segmentation by Product

8.1 Market segments

Chart on Product - Market share 2024-2029 (%)
Data Table on Product - Market share 2024-2029 (%)

8.2 Comparison by Product

Chart on Comparison by Product
Data Table on Comparison by Product

8.3 Fresh cut - Market size and forecast 2024-2029

Chart on Fresh cut - Market size and forecast 2024-2029 ($ billion)
Data Table on Fresh cut - Market size and forecast 2024-2029 ($ billion)
Chart on Fresh cut - Year-over-year growth 2024-2029 (%)
Data Table on Fresh cut - Year-over-year growth 2024-2029 (%)

8.4 Canned fruits - Market size and forecast 2024-2029

Chart on Canned fruits - Market size and forecast 2024-2029 ($ billion)
Data Table on Canned fruits - Market size and forecast 2024-2029 ($ billion)
Chart on Canned fruits - Year-over-year growth 2024-2029 (%)
Data Table on Canned fruits - Year-over-year growth 2024-2029 (%)

8.5 Frozen fruits - Market size and forecast 2024-2029

Chart on Frozen fruits - Market size and forecast 2024-2029 ($ billion)
Data Table on Frozen fruits - Market size and forecast 2024-2029 ($ billion)
Chart on Frozen fruits - Year-over-year growth 2024-2029 (%)
Data Table on Frozen fruits - Year-over-year growth 2024-2029 (%)

8.6 Market opportunity by Product

Market opportunity by Product ($ billion)
Data Table on Market opportunity by Product ($ billion)

9. Market Segmentation by Category

9.1 Market segments

Chart on Market Segmentation by Category - Market share 2024-2029 (%)
Data Table on Market Segmentation by Category - Market share 2024-2029 (%)

9.2 Comparison by Market Segmentation by Category

Chart on Comparison by Market Segmentation by Category
Data Table on Comparison by Market Segmentation by Category

9.3 Berries - Market size and forecast 2024-2029

Chart on Berries - Market size and forecast 2024-2029 ($ billion)
Data Table on Berries - Market size and forecast 2024-2029 ($ billion)
Chart on Berries - Year-over-year growth 2024-2029 (%)
Data Table on Berries - Year-over-year growth 2024-2029 (%)

9.4 Citrus fruits - Market size and forecast 2024-2029

Chart on Citrus fruits - Market size and forecast 2024-2029 ($ billion)
Data Table on Citrus fruits - Market size and forecast 2024-2029 ($ billion)
Chart on Citrus fruits - Year-over-year growth 2024-2029 (%)
Data Table on Citrus fruits - Year-over-year growth 2024-2029 (%)

9.5 Tropical fruits - Market size and forecast 2024-2029

Chart on Tropical fruits - Market size and forecast 2024-2029 ($ billion)
Data Table on Tropical fruits - Market size and forecast 2024-2029 ($ billion)
Chart on Tropical fruits - Year-over-year growth 2024-2029 (%)
Data Table on Tropical fruits - Year-over-year growth 2024-2029 (%)

9.6 Market opportunity by Market Segmentation by Category

Market opportunity by Market Segmentation by Category ($ billion)
Data Table on Market opportunity by Market Segmentation by Category ($ billion)

10. Market Segmentation by Distribution Channel

10.1 Market segments

Chart on Distribution Channel - Market share 2024-2029 (%)
Data Table on Distribution Channel - Market share 2024-2029 (%)

10.2 Comparison by Distribution Channel

Chart on Comparison by Distribution Channel
Data Table on Comparison by Distribution Channel

10.3 Offline - Market size and forecast 2024-2029

Chart on Offline - Market size and forecast 2024-2029 ($ billion)
Data Table on Offline - Market size and forecast 2024-2029 ($ billion)
Chart on Offline - Year-over-year growth 2024-2029 (%)
Data Table on Offline - Year-over-year growth 2024-2029 (%)

10.4 Online - Market size and forecast 2024-2029

Chart on Online - Market size and forecast 2024-2029 ($ billion)
Data Table on Online - Market size and forecast 2024-2029 ($ billion)
Chart on Online - Year-over-year growth 2024-2029 (%)
Data Table on Online - Year-over-year growth 2024-2029 (%)

10.5 Market opportunity by Distribution Channel

Market opportunity by Distribution Channel ($ billion)
Data Table on Market opportunity by Distribution Channel ($ billion)

11. Customer Landscape

11.1 Customer landscape overview

Analysis of price sensitivity, lifecycle, customer purchase basket, adoption rates, and purchase criteria

12. Geographic Landscape

12.1 Geographic segmentation

Chart on Market share by geography 2024-2029 (%)
Data Table on Market share by geography 2024-2029 (%)

12.2 Geographic comparison

Chart on Geographic comparison
Data Table on Geographic comparison

12.3 APAC - Market size and forecast 2024-2029

Chart on APAC - Market size and forecast 2024-2029 ($ billion)
Data Table on APAC - Market size and forecast 2024-2029 ($ billion)
Chart on APAC - Year-over-year growth 2024-2029 (%)
Data Table on APAC - Year-over-year growth 2024-2029 (%)
Chart on Regional Comparison - APAC
Data Table on Regional Comparison - APAC

12.3.1 India - Market size and forecast 2024-2029

Chart on India - Market size and forecast 2024-2029 ($ billion)
Data Table on India - Market size and forecast 2024-2029 ($ billion)
Chart on India - Year-over-year growth 2024-2029 (%)
Data Table on India - Year-over-year growth 2024-2029 (%)

12.3.2 China - Market size and forecast 2024-2029

Chart on China - Market size and forecast 2024-2029 ($ billion)
Data Table on China - Market size and forecast 2024-2029 ($ billion)
Chart on China - Year-over-year growth 2024-2029 (%)
Data Table on China - Year-over-year growth 2024-2029 (%)

12.3.3 Japan - Market size and forecast 2024-2029

Chart on Japan - Market size and forecast 2024-2029 ($ billion)
Data Table on Japan - Market size and forecast 2024-2029 ($ billion)
Chart on Japan - Year-over-year growth 2024-2029 (%)
Data Table on Japan - Year-over-year growth 2024-2029 (%)

12.3.4 South Korea - Market size and forecast 2024-2029

Chart on South Korea - Market size and forecast 2024-2029 ($ billion)
Data Table on South Korea - Market size and forecast 2024-2029 ($ billion)
Chart on South Korea - Year-over-year growth 2024-2029 (%)
Data Table on South Korea - Year-over-year growth 2024-2029 (%)

12.3.5 Australia - Market size and forecast 2024-2029

Chart on Australia - Market size and forecast 2024-2029 ($ billion)
Data Table on Australia - Market size and forecast 2024-2029 ($ billion)
Chart on Australia - Year-over-year growth 2024-2029 (%)
Data Table on Australia - Year-over-year growth 2024-2029 (%)

12.3.6 Indonesia - Market size and forecast 2024-2029

Chart on Indonesia - Market size and forecast 2024-2029 ($ billion)
Data Table on Indonesia - Market size and forecast 2024-2029 ($ billion)
Chart on Indonesia - Year-over-year growth 2024-2029 (%)
Data Table on Indonesia - Year-over-year growth 2024-2029 (%)

12.4 Europe - Market size and forecast 2024-2029

Chart on Europe - Market size and forecast 2024-2029 ($ billion)
Data Table on Europe - Market size and forecast 2024-2029 ($ billion)
Chart on Europe - Year-over-year growth 2024-2029 (%)
Data Table on Europe - Year-over-year growth 2024-2029 (%)
Chart on Regional Comparison - Europe
Data Table on Regional Comparison - Europe

12.4.1 Germany - Market size and forecast 2024-2029

Chart on Germany - Market size and forecast 2024-2029 ($ billion)
Data Table on Germany - Market size and forecast 2024-2029 ($ billion)
Chart on Germany - Year-over-year growth 2024-2029 (%)
Data Table on Germany - Year-over-year growth 2024-2029 (%)

12.4.2 UK - Market size and forecast 2024-2029

Chart on UK - Market size and forecast 2024-2029 ($ billion)
Data Table on UK - Market size and forecast 2024-2029 ($ billion)
Chart on UK - Year-over-year growth 2024-2029 (%)
Data Table on UK - Year-over-year growth 2024-2029 (%)

12.4.3 France - Market size and forecast 2024-2029

Chart on France - Market size and forecast 2024-2029 ($ billion)
Data Table on France - Market size and forecast 2024-2029 ($ billion)
Chart on France - Year-over-year growth 2024-2029 (%)
Data Table on France - Year-over-year growth 2024-2029 (%)

12.4.4 Italy - Market size and forecast 2024-2029

Chart on Italy - Market size and forecast 2024-2029 ($ billion)
Data Table on Italy - Market size and forecast 2024-2029 ($ billion)
Chart on Italy - Year-over-year growth 2024-2029 (%)
Data Table on Italy - Year-over-year growth 2024-2029 (%)

12.4.5 Spain - Market size and forecast 2024-2029

Chart on Spain - Market size and forecast 2024-2029 ($ billion)
Data Table on Spain - Market size and forecast 2024-2029 ($ billion)
Chart on Spain - Year-over-year growth 2024-2029 (%)
Data Table on Spain - Year-over-year growth 2024-2029 (%)

12.4.6 The Netherlands - Market size and forecast 2024-2029

Chart on The Netherlands - Market size and forecast 2024-2029 ($ billion)
Data Table on The Netherlands - Market size and forecast 2024-2029 ($ billion)
Chart on The Netherlands - Year-over-year growth 2024-2029 (%)
Data Table on The Netherlands - Year-over-year growth 2024-2029 (%)

12.5 North America - Market size and forecast 2024-2029

Chart on North America - Market size and forecast 2024-2029 ($ billion)
Data Table on North America - Market size and forecast 2024-2029 ($ billion)
Chart on North America - Year-over-year growth 2024-2029 (%)
Data Table on North America - Year-over-year growth 2024-2029 (%)
Chart on Regional Comparison - North America
Data Table on Regional Comparison - North America

12.5.1 US - Market size and forecast 2024-2029

Chart on US - Market size and forecast 2024-2029 ($ billion)
Data Table on US - Market size and forecast 2024-2029 ($ billion)
Chart on US - Year-over-year growth 2024-2029 (%)
Data Table on US - Year-over-year growth 2024-2029 (%)

12.5.2 Canada - Market size and forecast 2024-2029

Chart on Canada - Market size and forecast 2024-2029 ($ billion)
Data Table on Canada - Market size and forecast 2024-2029 ($ billion)
Chart on Canada - Year-over-year growth 2024-2029 (%)
Data Table on Canada - Year-over-year growth 2024-2029 (%)

12.5.3 Mexico - Market size and forecast 2024-2029

Chart on Mexico - Market size and forecast 2024-2029 ($ billion)
Data Table on Mexico - Market size and forecast 2024-2029 ($ billion)
Chart on Mexico - Year-over-year growth 2024-2029 (%)
Data Table on Mexico - Year-over-year growth 2024-2029 (%)

12.6 Middle East and Africa - Market size and forecast 2024-2029

Chart on Middle East and Africa - Market size and forecast 2024-2029 ($ billion)
Data Table on Middle East and Africa - Market size and forecast 2024-2029 ($ billion)
Chart on Middle East and Africa - Year-over-year growth 2024-2029 (%)
Data Table on Middle East and Africa - Year-over-year growth 2024-2029 (%)
Chart on Regional Comparison - Middle East and Africa
Data Table on Regional Comparison - Middle East and Africa

12.6.1 Saudi Arabia - Market size and forecast 2024-2029

Chart on Saudi Arabia - Market size and forecast 2024-2029 ($ billion)
Data Table on Saudi Arabia - Market size and forecast 2024-2029 ($ billion)
Chart on Saudi Arabia - Year-over-year growth 2024-2029 (%)
Data Table on Saudi Arabia - Year-over-year growth 2024-2029 (%)

12.6.2 UAE - Market size and forecast 2024-2029

Chart on UAE - Market size and forecast 2024-2029 ($ billion)
Data Table on UAE - Market size and forecast 2024-2029 ($ billion)
Chart on UAE - Year-over-year growth 2024-2029 (%)
Data Table on UAE - Year-over-year growth 2024-2029 (%)

12.6.3 South Africa - Market size and forecast 2024-2029

Chart on South Africa - Market size and forecast 2024-2029 ($ billion)
Data Table on South Africa - Market size and forecast 2024-2029 ($ billion)
Chart on South Africa - Year-over-year growth 2024-2029 (%)
Data Table on South Africa - Year-over-year growth 2024-2029 (%)

12.6.4 Egypt - Market size and forecast 2024-2029

Chart on Egypt - Market size and forecast 2024-2029 ($ billion)
Data Table on Egypt - Market size and forecast 2024-2029 ($ billion)
Chart on Egypt - Year-over-year growth 2024-2029 (%)
Data Table on Egypt - Year-over-year growth 2024-2029 (%)

12.6.5 Nigeria - Market size and forecast 2024-2029

Chart on Nigeria - Market size and forecast 2024-2029 ($ billion)
Data Table on Nigeria - Market size and forecast 2024-2029 ($ billion)
Chart on Nigeria - Year-over-year growth 2024-2029 (%)
Data Table on Nigeria - Year-over-year growth 2024-2029 (%)

12.7 South America - Market size and forecast 2024-2029

Chart on South America - Market size and forecast 2024-2029 ($ billion)
Data Table on South America - Market size and forecast 2024-2029 ($ billion)
Chart on South America - Year-over-year growth 2024-2029 (%)
Data Table on South America - Year-over-year growth 2024-2029 (%)
Chart on Regional Comparison - South America
Data Table on Regional Comparison - South America

12.7.1 Brazil - Market size and forecast 2024-2029

Chart on Brazil - Market size and forecast 2024-2029 ($ billion)
Data Table on Brazil - Market size and forecast 2024-2029 ($ billion)
Chart on Brazil - Year-over-year growth 2024-2029 (%)
Data Table on Brazil - Year-over-year growth 2024-2029 (%)

12.7.2 Argentina - Market size and forecast 2024-2029

Chart on Argentina - Market size and forecast 2024-2029 ($ billion)
Data Table on Argentina - Market size and forecast 2024-2029 ($ billion)
Chart on Argentina - Year-over-year growth 2024-2029 (%)
Data Table on Argentina - Year-over-year growth 2024-2029 (%)

12.7.3 Chile - Market size and forecast 2024-2029

Chart on Chile - Market size and forecast 2024-2029 ($ billion)
Data Table on Chile - Market size and forecast 2024-2029 ($ billion)
Chart on Chile - Year-over-year growth 2024-2029 (%)
Data Table on Chile - Year-over-year growth 2024-2029 (%)

12.8 Market opportunity by geography

Market opportunity by geography ($ billion)
Data Tables on Market opportunity by geography ($ billion)

13. Drivers, Challenges, and Opportunity

13.1 Market drivers

Increase in demand for processed fruits
Strong distribution network and omnichannel presence of processed fruit vendors
Health benefits associated with intake of minimally processed fruits

13.2 Market challenges

Side effects of chemically processed fruits and fruit products
Intense competition in processed fruit industry
Stringent food safety regulations associated with processed fruits

13.3 Impact of drivers and challenges

Impact of drivers and challenges in 2024 and 2029

13.4 Market opportunities

Increasing online presence of processed fruit vendors
Processed fruit manufacturers and distributors venturing into private-label marketplace
Increasing popularity of superfruits

14. Competitive Landscape

14.1 Overview

14.2

Overview on criticality of inputs and factors of differentiation

14.3 Landscape disruption

Overview on factors of disruption

14.4 Industry risks

Impact of key risks on business

15. Competitive Analysis

15.1 Companies profiled

Companies covered

15.2 Company ranking index

15.3 Market positioning of companies

Matrix on companies position and classification

15.4 AGRANA Beteiligungs AG

AGRANA Beteiligungs AG - Overview
AGRANA Beteiligungs AG - Business segments
AGRANA Beteiligungs AG - Key news
AGRANA Beteiligungs AG - Key offerings
AGRANA Beteiligungs AG - Segment focus
SWOT

15.5 Aohata Corp.

Aohata Corp. - Overview
Aohata Corp. - Product / Service
Aohata Corp. - Key offerings
SWOT

15.6 Calavo Growers Inc.

Calavo Growers Inc. - Overview
Calavo Growers Inc. - Business segments
Calavo Growers Inc. - Key news
Calavo Growers Inc. - Key offerings
Calavo Growers Inc. - Segment focus
SWOT

15.7 Capricorn Food Products India Ltd.

Capricorn Food Products India Ltd. - Overview
Capricorn Food Products India Ltd. - Product / Service
Capricorn Food Products India Ltd. - Key offerings
SWOT

15.8 CHB Group

CHB Group - Overview
CHB Group - Product / Service
CHB Group - Key offerings
SWOT

15.9 Del Monte Foods Inc.

Del Monte Foods Inc. - Overview
Del Monte Foods Inc. - Product / Service
Del Monte Foods Inc. - Key offerings
SWOT

15.10 Delicia Foods India Pvt. Ltd.

Delicia Foods India Pvt. Ltd. - Overview
Delicia Foods India Pvt. Ltd. - Product / Service
Delicia Foods India Pvt. Ltd. - Key offerings
SWOT

15.11 Dole plc

Dole plc - Overview
Dole plc - Business segments
Dole plc - Key offerings
Dole plc - Segment focus
SWOT

15.12 Mysore Fruit Products Pvt. Ltd.

Mysore Fruit Products Pvt. Ltd. - Overview
Mysore Fruit Products Pvt. Ltd. - Product / Service
Mysore Fruit Products Pvt. Ltd. - Key offerings
SWOT

15.13 Ninos Fresh Cut Fruit and Veg LLC

Ninos Fresh Cut Fruit and Veg LLC - Overview
Ninos Fresh Cut Fruit and Veg LLC - Product / Service
Ninos Fresh Cut Fruit and Veg LLC - Key offerings
SWOT

15.14 RFG Holdings Ltd.

RFG Holdings Ltd. - Overview
RFG Holdings Ltd. - Business segments
RFG Holdings Ltd. - Key offerings
RFG Holdings Ltd. - Segment focus
SWOT

15.15 Royal Ridge Fruits

Royal Ridge Fruits - Overview
Royal Ridge Fruits - Product / Service
Royal Ridge Fruits - Key offerings
SWOT

15.16 Speyfruit Ltd.

Speyfruit Ltd. - Overview
Speyfruit Ltd. - Product / Service
Speyfruit Ltd. - Key offerings
SWOT

15.17 Sysco Corp.

Sysco Corp. - Overview
Sysco Corp. - Business segments
Sysco Corp. - Key news
Sysco Corp. - Key offerings
Sysco Corp. - Segment focus
SWOT

15.18 US Foods Holding Corp.

US Foods Holding Corp. - Overview
US Foods Holding Corp. - Product / Service
US Foods Holding Corp. - Key offerings
SWOT

16. Appendix

16.1 Scope of the report

Market definition
Objectives
Notes and caveats

16.2 Inclusions and exclusions checklist

Inclusions checklist
Exclusions checklist

16.3 Currency conversion rates for US$

16.4 Research methodology

16.5 Data procurement

Information sources

16.6 Data validation

16.7 Validation techniques employed for market sizing

16.8 Data synthesis

16.9 360 degree market analysis

16.10 List of abbreviations

Research Methodology

Technavio presents a detailed picture of the market by way of study, synthesis, and summation of data from multiple sources. The analysts have presented the various facets of the market with a particular focus on identifying the key industry influencers. The data thus presented is comprehensive, reliable, and the result of extensive research, both primary and secondary.

INFORMATION SOURCES

Primary sources

  • Manufacturers and suppliers
  • Channel partners
  • Industry experts
  • Strategic decision makers

Secondary sources

  • Industry journals and periodicals
  • Government data
  • Financial reports of key industry players
  • Historical data
  • Press releases

DATA ANALYSIS

Data Synthesis

  • Collation of data
  • Estimation of key figures
  • Analysis of derived insights

Data Validation

  • Triangulation with data models
  • Reference against proprietary databases
  • Corroboration with industry experts

REPORT WRITING

Qualitative

  • Market drivers
  • Market challenges
  • Market trends
  • Five forces analysis

Quantitative

  • Market size and forecast
  • Market segmentation
  • Geographical insights
  • Competitive landscape

Interested in this report?

Get your sample now to see our research methodology and insights!

Download Now

Frequently Asked Questions

Processed Fruits market growth will increase by USD 216.3 billion during 2025-2029.

The Processed Fruits market is expected to grow at a CAGR of 7.9% during 2025-2029.

Processed Fruits market is segmented by Product (Fresh cut, Canned fruits, Frozen fruits) Category (Berries, Citrus fruits, Tropical fruits) Distribution channel (Offline, Online)

AGRANA Beteiligungs AG, Aohata Corp., Calavo Growers Inc., Capricorn Food Products India Ltd., CHB Group, Del Monte Foods Inc., Delicia Foods India Pvt. Ltd., Dole plc, Mysore Fruit Products Pvt. Ltd., Ninos Fresh Cut Fruit and Veg LLC, RFG Holdings Ltd., Royal Ridge Fruits, Speyfruit Ltd., Sysco Corp., US Foods Holding Corp. are a few of the key vendors in the Processed Fruits market.

APAC will register the highest growth rate of 52.3% among the other regions. Therefore, the Processed Fruits market in APAC is expected to garner significant business opportunities for the vendors during the forecast period.

India, China, Japan, South Korea, Australia, Indonesia, Germany, UK, France, Italy, Spain, The Netherlands, US, Canada, Mexico, Saudi Arabia, UAE, South Africa, Egypt, Nigeria, Brazil, Argentina, Chile

  • Increase in demand for processed fruits is the driving factor this market.

The Processed Fruits market vendors should focus on grabbing business opportunities from the Product segment as it accounted for the largest market share in the base year.