
Carbon Dioxide Removal Market Size 2024-2028
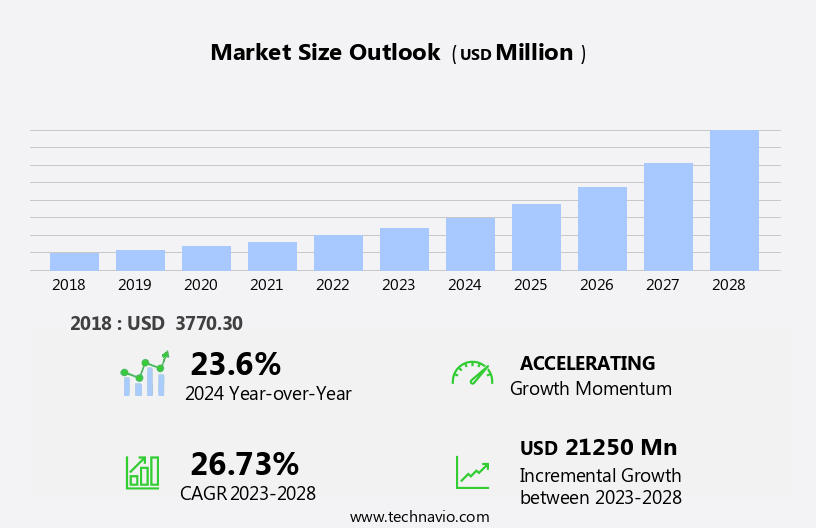
The carbon dioxide removal market size is forecast to increase by USD 21.25 billion, at a CAGR of 26.73% between 2023 and 2028.
- The Carbon Dioxide Removal (CDR) market is experiencing significant growth due to increasing investments in direct air capture technology. This technology, which absorbs CO2 directly from the atmosphere, is gaining traction as a promising solution for reducing greenhouse gas emissions. However, the market's growth is not without challenges. One of the primary obstacles is the permanence of carbon storage solutions. Despite advancements in carbon capture and storage (CCS) technology, ensuring the long-term stability of stored CO2 remains a concern. As the demand for CDR technologies continues to rise, companies must address this challenge to build trust and confidence in their offerings.
- Additionally, the market faces regulatory hurdles and high implementation costs, which may limit its growth potential. To capitalize on market opportunities and navigate challenges effectively, companies must focus on developing robust carbon storage solutions and collaborating with governments and industry partners to address regulatory and financial barriers.
What will be the Size of the Carbon Dioxide Removal Market during the forecast period?
The market continues to evolve, driven by the pressing need for climate change mitigation and the increasing demand for net zero emissions. The market encompasses a range of applications, from carbon mineralization and co2 utilization to carbon capture plants and negative emissions technologies. These solutions are integrated into various sectors, including renewable energy and clean technology, to enhance their carbon footprint reduction capabilities. Carbon capture feasibility and cost remain key considerations in the deployment of carbon capture systems. Co2 capture membranes and sorbents play crucial roles in this process, with ongoing research and development efforts aimed at improving their efficiency and reducing costs.
The carbon capture equipment market is expanding, with an increasing number of co2 capture plants coming online. Carbon pricing and emissions trading schemes are also shaping the market, providing financial incentives for carbon capture deployment. The use of carbon removal credits is gaining traction as a means of offsetting emissions and achieving carbon neutrality. The ongoing unfolding of market activities reveals a dynamic and complex landscape, with continued innovation and collaboration required to effectively address the challenges of climate change. Greenhouse gas removal technologies, including direct air capture and carbon sequestration, are essential components of the market.
These solutions offer promising opportunities for co2 utilization and storage, contributing to the development of a circular carbon economy. The integration of negative emissions technologies into industrial processes, such as enhanced oil recovery, is another area of focus, with potential for significant emissions reductions. The carbon capture market is characterized by its continuous evolution, with new developments and trends emerging regularly. The market's ongoing dynamism reflects the urgent need for effective climate change solutions and the potential for innovative technologies to make a significant impact on reducing greenhouse gas emissions.
How is this Carbon Dioxide Removal Industry segmented?
The carbon dioxide removal industry research report provides comprehensive data (region-wise segment analysis), with forecasts and estimates in "USD million" for the period 2024-2028, as well as historical data from 2018-2022 for the following segments.
- Technology
- DAC
- CCS
- Bioenergy with CCS
- Soil carbon sequestration
- Others
- Application
- Industrial
- Agricultural
- Energy production
- End-User
- Corporations
- Governments
- Carbon Credit Markets
- Deployment Type
- Land-Based
- Ocean-Based
- Geography
- North America
- US
- Canada
- Europe
- France
- Germany
- Netherlands
- UK
- Middle East and Africa
- South Africa
- UAE
- APAC
- Australia
- China
- India
- Japan
- South Korea
- South America
- Brazil
- Rest of World (ROW)
- North America
By Technology Insights
The dac segment is estimated to witness significant growth during the forecast period.
Carbon dioxide removal (CDR) markets have witnessed notable growth with the increasing emphasis on climate change mitigation and net zero emissions. One prominent CDR method is Direct Air Capture (DAC), which can be deployed at various scales, from small facilities to large industrial plants. This flexibility makes it an attractive solution for diverse locations, enabling seamless integration into existing infrastructures. DAC's geological storage capability allows for permanent carbon dioxide burial or utilization in various products, contributing to long-term emissions reduction. DAC's unique ability to provide permanent carbon dioxide removal sets it apart from other techniques that may only result in temporary atmospheric reductions.
Moreover, DAC requires significantly less land compared to other methods like reforestation or soil carbon sequestration. Renewable energy integration and carbon pricing policies further boost the deployment of DAC and other CDR technologies. Carbon capture systems, including membranes and equipment, play a crucial role in DAC processes. Carbon capture and utilization, mineralization, and negative emissions technologies are other evolving trends in the CDR market. Environmental regulations continue to drive the demand for CDR projects, as companies seek to minimize their carbon footprint and comply with emissions trading schemes. Carbon removal credits generated from these projects can be traded on emissions markets, providing financial incentives for their implementation.
The integration of DAC with enhanced oil recovery processes offers additional economic benefits while reducing greenhouse gas emissions. Overall, the CDR market is expected to continue growing as the world seeks innovative climate change solutions.
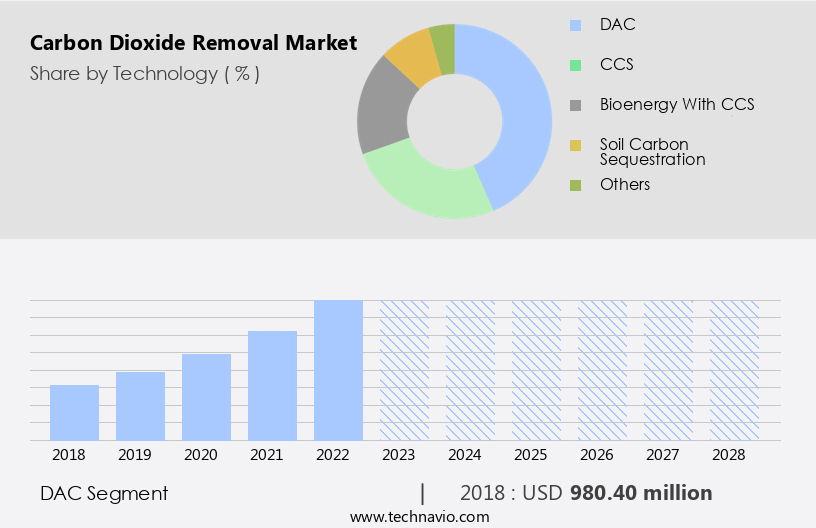
The DAC segment was valued at USD 980.40 billion in 2018 and showed a gradual increase during the forecast period.
Regional Analysis
North America is estimated to contribute 56% to the growth of the global market during the forecast period.Technavio's analysts have elaborately explained the regional trends and drivers that shape the market during the forecast period.
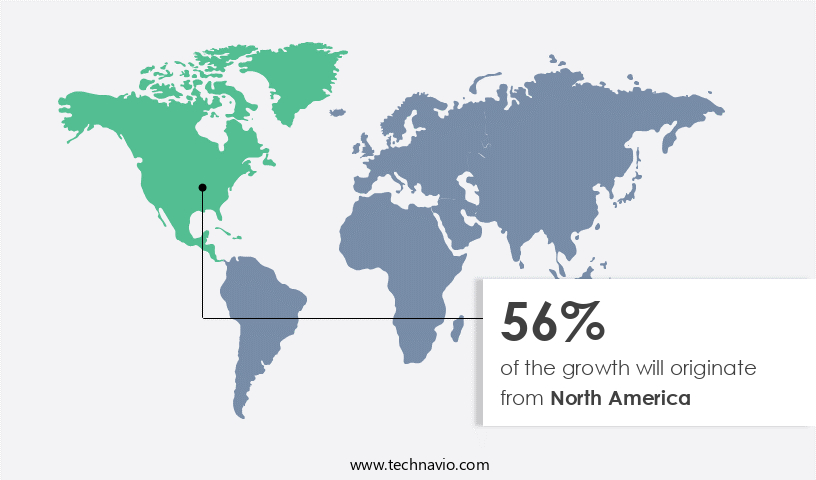
The Carbon Dioxide Removal (CDR) market in North America is experiencing significant growth due to increasing climate change concerns and net-zero emission targets. Major corporations, particularly in the tech and energy sectors, are investing heavily in CDR as part of their sustainability strategies. The United States government is also supporting this trend through legislation like the Inflation Reduction Act, which offers tax incentives for CDR projects. Canada is similarly promoting CDR research and implementation. This robust demand is driven by advanced technological capabilities and abundant geological storage potential in the region, particularly in areas such as the Gulf Coast.
Renewable energy sources are also playing a role in CDR, with direct air capture and carbon utilization technologies gaining traction. Carbon capture and storage (CCS) systems, including carbon capture membranes and equipment, are essential components of CDR projects. Carbon pricing and emissions trading are also influencing the market, as companies seek to reduce their carbon footprint and comply with environmental regulations. Negative emissions technologies, such as carbon mineralization and carbon capture plants, are also gaining attention as potential solutions to help reach net-zero emissions. The CDR market is expected to continue growing as more companies and governments commit to climate action and decarbonization efforts.
Market Dynamics
Our researchers analyzed the data with 2023 as the base year, along with the key drivers, trends, and challenges. A holistic analysis of drivers will help companies refine their marketing strategies to gain a competitive advantage.
What are the key market drivers leading to the rise in the adoption of Carbon Dioxide Removal Industry?
- A significant investment in carbon dioxide removal technologies is the primary market catalyst. Investments in the R and D of next-generation capture technologies have increased over the years. Besides, governments are undertaking initiatives to promote carbon capture and storage technology, and this is contributing to market growth. Both private and public sectors are investing heavily in the testing and commercialization of low-carbon technology as this reduces carbon costs and protects the environment. In December 2023, the U.S. Department of Energy (DOE) announced an one million US dollar investment towards carbon dioxide removal technology innovation.
- It is essential to progress carbon dioxide removal technologies, such as direct air capture, to realize the historic climate and clean energy agenda of the Biden-Harris Administration.Increased funding is accelerating research and development which leads to more efficient and cost-effective carbon dioxide removal technologies. Improved technologies make carbon dioxide removal more commercially viable which will positively impact the growth of global carbon dioxide removal market during forecast period.
What are the market trends shaping the Carbon Dioxide Removal Industry?
- Direct air capture technology is gaining increasing popularity as an emerging market trend. This innovative technology, which involves the removal of carbon dioxide directly from the atmosphere, is becoming increasingly important in the global efforts to mitigate climate change.DAC technology has been gaining significant traction in recent years as a promising approach to carbon dioxide removal. This technology, which extracts carbon dioxide directly from the ambient air, has seen increased investment and development efforts from both private companies and government initiatives. The growing interest is driven by potential of DAC to address historical emissions and its flexibility in deployment locations. Recent technological advancements have improved efficiency and reduced costs, making DAC more economically viable. Major corporations have begun partnering with DAC companies to offset their emissions, while some governments are incorporating DAC into their climate strategies.
- As the urgency to combat climate change intensifies, DAC is increasingly viewed as a necessary component of a comprehensive emissions reduction strategy, complementing other mitigation efforts. For example, in 2023, Amazon backed the largest direct air capture technology deployment globally, to remove carbon from the environment. Amazon is investing in Carbon Capture America, Inc. and buying carbon removal credits from 1PointFive to hasten the development of DAC technologies. As part of its Climate Pledge goal to achieve net-zero carbon emissions, Amazon is making this DAC investment. Growing popularity of DAC will fuel the growth of the global market in focus during forecast period.
What challenges does the Carbon Dioxide Removal Industry face during its growth?
- The permanence of carbon storage solutions poses a significant challenge to the industry's growth, as ensuring long-term effectiveness is crucial for the successful implementation and expansion of carbon capture and storage technologies. The issue of permanence in carbon storage solutions presents a significant challenge for the global carbon dioxide removal market. Many potential buyers of carbon removal services, including companies and governments, are hesitant to invest in solutions that may not guarantee long-term storage of captured carbon dioxide. This concern stems from the risk that stored carbon could be re-released into the atmosphere due to natural processes, human activities, or unforeseen events, effectively negating the initial removal efforts.
- Different CDR technologies have varying degrees of reliability in terms of how long they can effectively sequester carbon. Additionally, accurately measuring the real climate benefits of these technologies remains complex, particularly for methods like direct air capture and carbon mineralization, where reliable volumetric measurements are crucial. As a result, the global carbon dioxide removal market faces challenges in attracting investment and scaling up operations, as stakeholders seek assurances of durable carbon sequestration to justify their financial commitments and meet their long-term climate goals. Thus, the issue of permanence in carbon storage solutions may hamper the growth of the global market in focus during forecast period.
Exclusive Customer Landscape
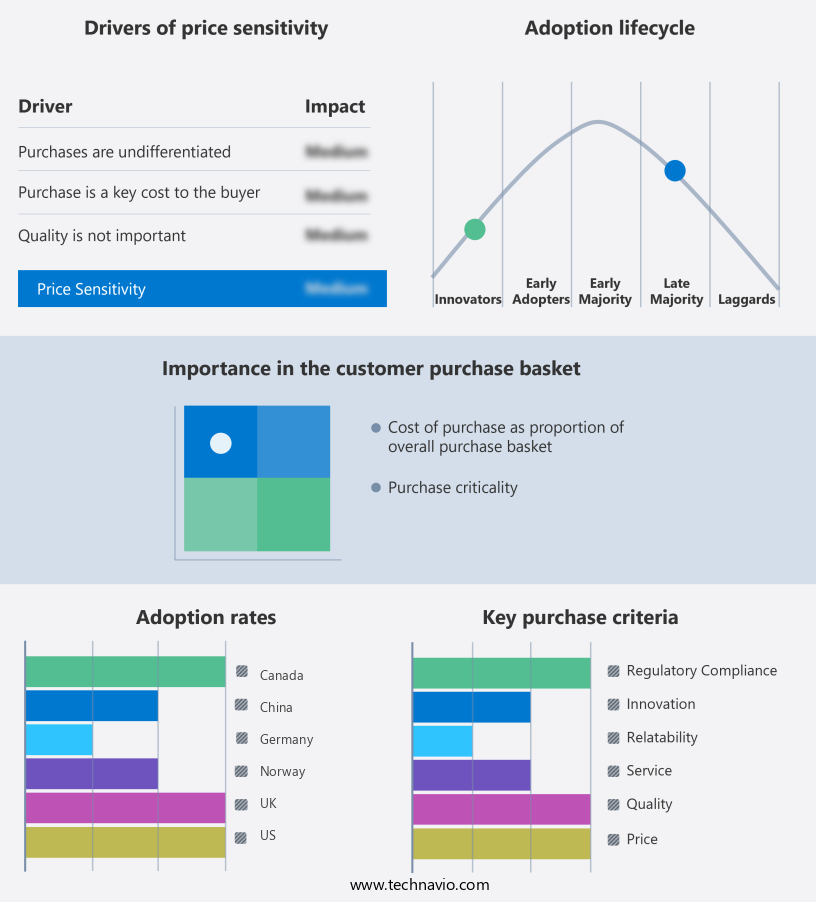
The carbon dioxide removal market forecasting report includes the adoption lifecycle of the market, covering from the innovator's stage to the laggard's stage. It focuses on adoption rates in different regions based on penetration. Furthermore, the carbon dioxide removal market report also includes key purchase criteria and drivers of price sensitivity to help companies evaluate and develop their market growth analysis strategies.
Customer Landscape
Key Companies & Market Insights
Companies are implementing various strategies, such as strategic alliances, carbon dioxide removal market forecast, partnerships, mergers and acquisitions, geographical expansion, and product/service launches, to enhance their presence in the industry.
Aker Carbon Capture - The company specializes in providing carbon dioxide removal services, including Carbon Capture as a Service and the innovative JustCatch carbon capture plant. Our offerings leverage advanced technologies to effectively reduce carbon emissions and promote sustainability. Through these solutions, we help businesses and organizations meet their decarbonization goals while enhancing their environmental footprint. Our expertise in carbon capture technology enables US to deliver customized, scalable, and cost-effective services to a diverse range of industries. By partnering with US, clients can confidently navigate the complexities of carbon management and contribute to a more sustainable future.
The industry research and growth report includes detailed analyses of the competitive landscape of the market and information about key companies, including:
- Aker Carbon Capture
- Calix Ltd.
- CAPTURA CORP.
- Carbfix hf.
- Carbon Capture America, Inc.
- Carbon Clean Solutions Ltd.
- Carbon Engineering ULC.,
- Carbon8 Systems Ltd.
- CarbonCure Technologies Inc.
- CarbonFree
- Climeworks
- CSI Oil and Gas Pte Ltd
- Equatic Inc
- FuelCell Energy Inc.
- Global Thermostat
- LanzaTech Global Inc.
- Linde Plc
- NET Power
- Saipem S.p.A.
- Shell plc
- Svante Technologies Inc.
Qualitative and quantitative analysis of companies has been conducted to help clients understand the wider business environment as well as the strengths and weaknesses of key industry players. Data is qualitatively analyzed to categorize companies as pure play, category-focused, industry-focused, and diversified; it is quantitatively analyzed to categorize companies as dominant, leading, strong, tentative, and weak.
Recent Development and News in Carbon Dioxide Removal Market
- In March 2023, Carbon Clean Solutions, a leading carbon dioxide removal technology company, announced the commercial launch of their CarbonClean DLE (Direct Air Capture with Low Energy) solution. This innovative technology, which reduces the energy consumption of CO2 capture by up to 75% compared to traditional methods, marks a significant advancement in the carbon capture industry (Carbon Clean Solutions Press Release).
- In July 2024, Shell and Carbon Clean Solutions entered into a strategic partnership to deploy CarbonClean DLE technology at Shell's ethane cracker plant in Pennsylvania, USA. This collaboration is expected to remove approximately 1 million metric tons of CO2 annually, making it one of the largest direct air capture projects globally (Shell Newsroom).
- In October 2024, Global Thermostat, a California-based CO2 removal company, secured a USD100 million Series C funding round, led by Breakthrough Energy Ventures and Bill Gates. This investment will support the expansion of their mineral carbonation technology, which permanently stores CO2 in mineral form (Global Thermostat Press Release).
- In February 2025, the European Union passed the Fit for 55 package, a set of legislative proposals aimed at reducing the EU's greenhouse gas emissions by at least 55% by 2030. This policy change includes a Carbon Border Adjustment Mechanism, which puts a carbon price on imports to ensure fair competition with EU industries using carbon pricing (European Commission Press Release). This regulatory initiative is expected to drive demand for CO2 removal technologies in Europe.
Research Analyst Overview
- The CO2 removal market is experiencing significant growth and innovation, driven by the increasing demand for sustainable solutions to mitigate greenhouse gas emissions. Several technologies are at the forefront of this development, including mineral carbonation, solid sorbents, membrane separation, and electrochemical capture. These CO2 removal technologies are transforming industries by providing new applications for CO2-based materials and fuels. Mineral carbonation and solid sorbents offer promising solutions for large-scale CO2 capture, while membrane separation and electrochemical capture focus on selective CO2 removal. Regulatory policies and investment in CO2 removal research are also fueling innovation in this sector. Carbon sequestration technology, such as CCS, is complementing CO2 removal efforts by storing captured CO2 underground.
- Ocean fertilization and CO2-based fuels are additional areas of exploration for the CO2 removal industry. The market for CO2 removal is dynamic, with continuous advancements in technology and policy driving progress. Companies are investing in R&D to improve efficiency and reduce costs, making CO2 removal a viable and essential component of the global transition to a low-carbon economy.
Dive into Technavio's robust research methodology, blending expert interviews, extensive data synthesis, and validated models for unparalleled Carbon Dioxide Removal Market insights. See full methodology.
|
Market Scope |
|
|
Report Coverage |
Details |
|
Page number |
204 |
|
Base year |
2023 |
|
Historic period |
2018-2022 |
|
Forecast period |
2024-2028 |
|
Growth momentum & CAGR |
Accelerate at a CAGR of 26.73% |
|
Market growth 2024-2028 |
USD 21250 million |
|
Market structure |
Fragmented |
|
YoY growth 2023-2024(%) |
23.6 |
|
Key countries |
US, China, UK, Germany, India, Japan, Canada, UAE, Brazil, South Korea, France, Netherlands, Australia, South Africa, and Rest of World (ROW) |
|
Competitive landscape |
Leading Companies, Market Positioning of Companies, Competitive Strategies, and Industry Risks |
What are the Key Data Covered in this Carbon Dioxide Removal Market Research and Growth Report?
- CAGR of the Carbon Dioxide Removal industry during the forecast period
- Detailed information on factors that will drive the growth and forecasting between 2024 and 2028
- Precise estimation of the size of the market and its contribution of the industry in focus to the parent market
- Accurate predictions about upcoming growth and trends and changes in consumer behaviour
- Growth of the market across North America, Europe, APAC, South America, and Middle East and Africa
- Thorough analysis of the market's competitive landscape and detailed information about companies
- Comprehensive analysis of factors that will challenge the carbon dioxide removal market growth of industry companies
We can help! Our analysts can customize this carbon dioxide removal market research report to meet your requirements.
 RIA -
RIA - 
