Casing Cementation Hardware Market Size 2025-2029
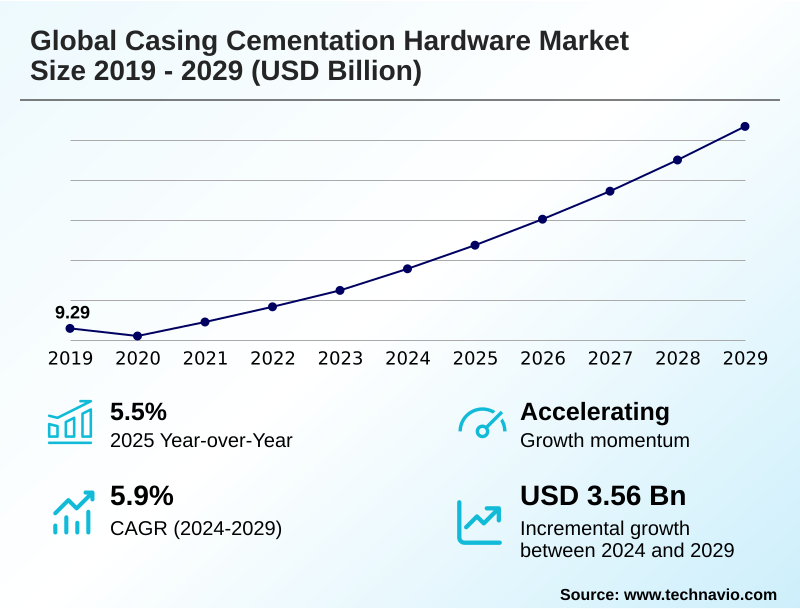
The casing cementation hardware market size is valued to increase by USD 3.56 billion, at a CAGR of 5.9% from 2024 to 2029. Increasing investments in upstream oil and gas operations will drive the casing cementation hardware market.
Major Market Trends & Insights
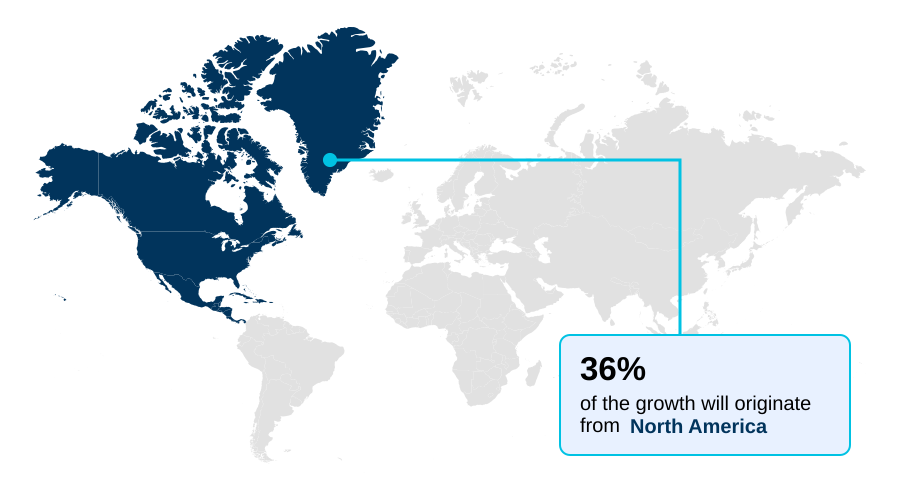
- North America dominated the market and accounted for a 36.4% growth during the forecast period.
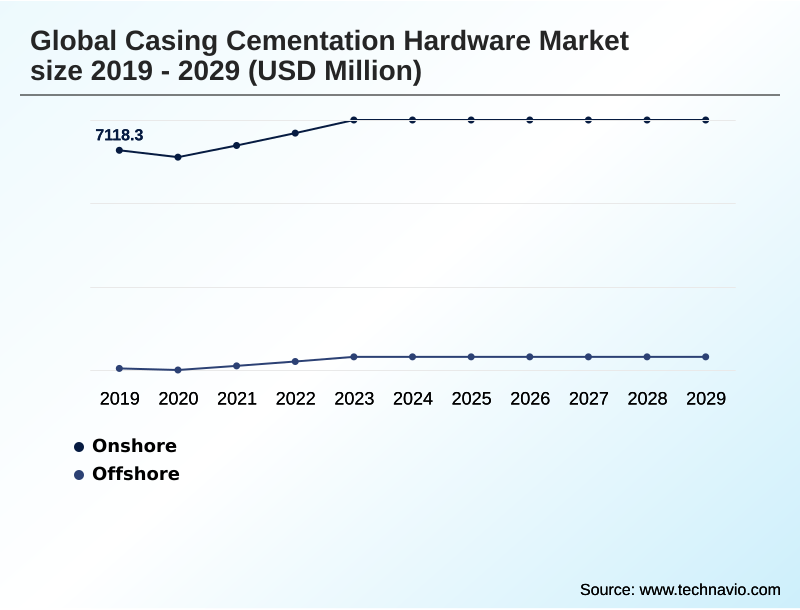
- By Application - Onshore segment was valued at USD 7.81 billion in 2023
- By Type - Casing hardware segment accounted for the largest market revenue share in 2023
Market Size & Forecast
- Market Opportunities: USD 5.06 billion
- Market Future Opportunities: USD 3.56 billion
- CAGR from 2024 to 2029 : 5.9%
Market Summary
- The Casing Cementation Hardware Market is fundamental to ensuring safety and efficiency in oil and gas extraction. Demand is closely linked to exploration and production activities, where ensuring zonal isolation and long-term wellbore integrity are paramount. Key drivers include the global need for energy and the push into more challenging drilling environments, such as deepwater and unconventional shale plays.
- These environments require highly engineered float equipment and casing hardware. A significant trend is the adoption of intelligent completion technologies, which integrate downhole sensors to provide real-time data, optimizing the cementing process. For instance, an operator in a high-pressure field can use this data to adjust cement slurry properties dynamically, preventing costly well integrity issues and reducing non-productive time.
- However, the market faces challenges from volatile commodity prices, which can delay or cancel capital-intensive projects, and increasing competition from alternative energy sources that shift investment focus away from fossil fuels.
What will be the Size of the Casing Cementation Hardware Market during the forecast period?
Get Key Insights on Market Forecast (PDF) Get Free Sample
How is the Casing Cementation Hardware Market Segmented?
The casing cementation hardware industry research report provides comprehensive data (region-wise segment analysis), with forecasts and estimates in "USD million" for the period 2025-2029, as well as historical data from 2019-2023 for the following segments.
- Application
- Onshore
- Offshore
- Type
- Casing hardware
- Cementation hardware
- Material
- Steel
- Aluminum
- Composite materials
- Others
- Geography
- North America
- US
- Canada
- Mexico
- Europe
- UK
- The Netherlands
- Germany
- APAC
- China
- Australia
- India
- Middle East and Africa
- Saudi Arabia
- UAE
- South America
- Brazil
- Argentina
- Rest of World (ROW)
- North America
By Application Insights
The onshore segment is estimated to witness significant growth during the forecast period.
The onshore segment of the casing cementation hardware market is driven by high-volume well drilling and completion activities in unconventional resources.
These upstream oil and gas operations necessitate robust solutions to ensure wellbore integrity and effective zonal isolation, particularly as operators focus on maximizing output while controlling costs.
The deployment of the complete casing string, along with essential float equipment and cementing plugs, is standard practice. Advanced centralizers are critical for ensuring proper standoff in long laterals, a key factor in successful oil and gas exploration.
Innovations, including the integration of downhole sensors, are improving outcomes, with some operations reporting a 15% improvement in cement placement accuracy. This focus on efficiency and reliability underpins the demand within onshore drilling programs.
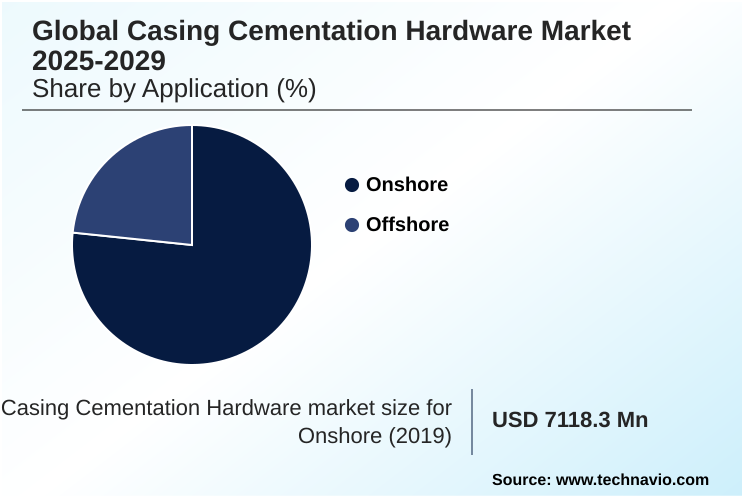
The Onshore segment was valued at USD 7.81 billion in 2023 and showed a gradual increase during the forecast period.
Regional Analysis
North America is estimated to contribute 36.4% to the growth of the global market during the forecast period.Technavio’s analysts have elaborately explained the regional trends and drivers that shape the market during the forecast period.
See How Casing Cementation Hardware Market Demand is Rising in North America Get Free Sample
The geographic landscape is shaped by regional exploration and production (E&P) activity, with North America leading incremental growth, accounting for over 36% of the market opportunity. This is driven by a high rig count and sustained well construction programs.
The performance of casing hardware is critical, as managing torque and drag in long laterals directly impacts project economics. Advanced centralizer design and specialized casing running services are key enablers in this region.
The focus on optimizing the entire cementing process ensures better reservoir connectivity and long-term output. Key to this is the integration of advanced wellbore cleanup tools, rig instrumentation software, and other cementing accessories.
The efficient oilfield equipment supply chain in the region supports a drilling efficiency improvement of nearly 15% compared to less mature markets.
Market Dynamics
Our researchers analyzed the data with 2024 as the base year, along with the key drivers, trends, and challenges. A holistic analysis of drivers will help companies refine their marketing strategies to gain a competitive advantage.
- Strategic decision-making in the sector increasingly revolves around specialized applications and long-term performance. For instance, casing cementation for high-pressure wells is no longer a one-size-fits-all approach; it demands specific cement slurry design for HPHT environments and robust hardware. Similarly, improving drill-out efficiency with dissolvable plugs has become a key performance indicator in unconventional plays.
- Advanced centralizer design for horizontal drilling is critical for managing torque and drag in complex wellbores and ensuring a uniform annular barrier. In deepwater projects, mitigating sustained casing pressure is a top priority, often addressed through automated cement placement in subsea systems and specialized liner hanger systems for extended reach drilling.
- The role of float equipment in primary cementing remains fundamental, but its design is evolving for deepwater exploration. New frontiers like geothermal energy create distinct hardware requirements for geothermal well construction. Likewise, the advent of carbon capture and storage necessitates unique casing hardware to guarantee permanent sequestration. As operators tackle wellbore instability, cementing solutions and casing string design are co-developed.
- Intelligent completion for multilateral wells is another area where optimizing reservoir connectivity via completion design is showing results, with some integrated approaches improving production forecasts by over 20% compared to traditional methods. Finally, even well abandonment is becoming more sophisticated, using specialized cementing hardware to ensure environmental compliance.
What are the key market drivers leading to the rise in the adoption of Casing Cementation Hardware Industry?
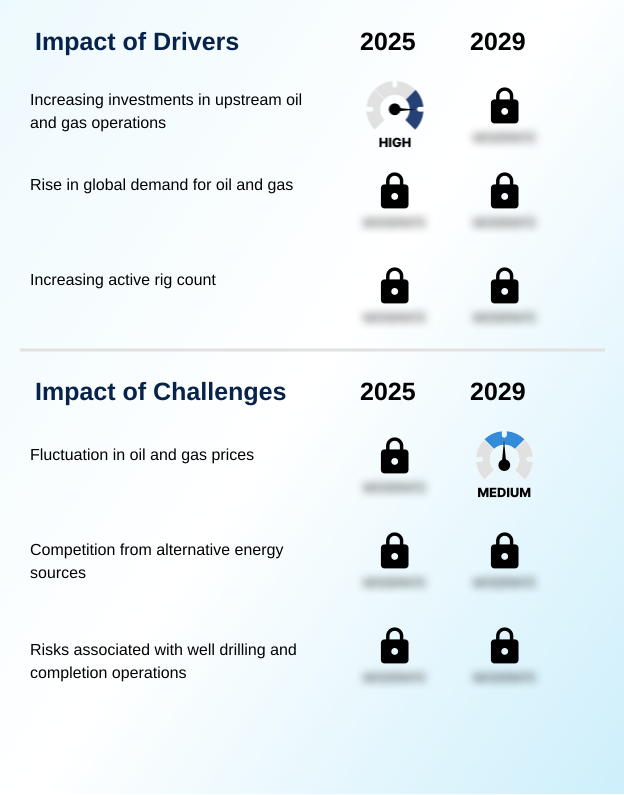
- Increasing investments in upstream oil and gas operations represent a key driver for market growth.
- Market growth is significantly propelled by the industry's focus on maximizing asset value and operational efficiency. The drive to reduce non-productive time, which can account for up to 25% of well construction costs, fuels demand for reliable hardware.
- Innovations like dissolvable plug technology are critical, improving post-frac intervention times. Demand for specialized deepwater exploration hardware, including advanced float collar and float shoe designs, is rising with the increase in offshore projects.
- To mitigate risks of cementing failure prevention, operators are investing in superior cement slurry formulations and corrosion resistant alloys.
- These production enhancement services are supported by robust cementing head equipment and technologies targeting wellbore instability, ensuring long-term well performance in both conventional and subsea processing units.
What are the market trends shaping the Casing Cementation Hardware Industry?
- The development of intelligent well-completion technologies is an influential market trend, involving the integration of downhole sensors and remote-control systems to optimize reservoir production.
- The evolution of well completion technology is reshaping market dynamics, driven by the need for efficiency in complex drilling environments. Advanced drilling techniques, such as horizontal drilling and multilateral wells, are becoming standard, demanding sophisticated hardware. In response, downhole tool manufacturing is focused on creating solutions for deepwater drilling and high-pressure high-temperature (HPHT) conditions.
- Innovations in casing equipment product design include the development of premium-grade casing materials that withstand harsh subsea systems. Furthermore, the adoption of automated cement placement systems, which can improve cementing success rates by over 20%, is a key trend.
- This focus on technology-driven well integrity management helps operators address the complexities of modern hydraulic fracturing operations and achieve higher production yields.
What challenges does the Casing Cementation Hardware Industry face during its growth?
- Fluctuations in oil and gas prices pose a key challenge affecting the industry's growth trajectory and investment decisions.
- Navigating market challenges requires addressing both operational risks and external pressures. The risk of sustained casing pressure necessitates a flawless annular barrier, which is a primary focus of oilfield services technology. Failures can lead to costly well abandonment solutions.
- The push for greater drill-out efficiency is driving innovation away from traditional hardware toward advanced liner hanger systems and sub-surface release plugs. Simultaneously, the energy transition creates new opportunities, with investment directed toward geothermal well construction and carbon capture and storage (CCS) projects.
- These applications demand specialized stage cementing tools and smart completion systems capable of remote well monitoring, with some geothermal projects requiring hardware to perform reliably for decades, a standard 30% higher than conventional wells.
Exclusive Technavio Analysis on Customer Landscape
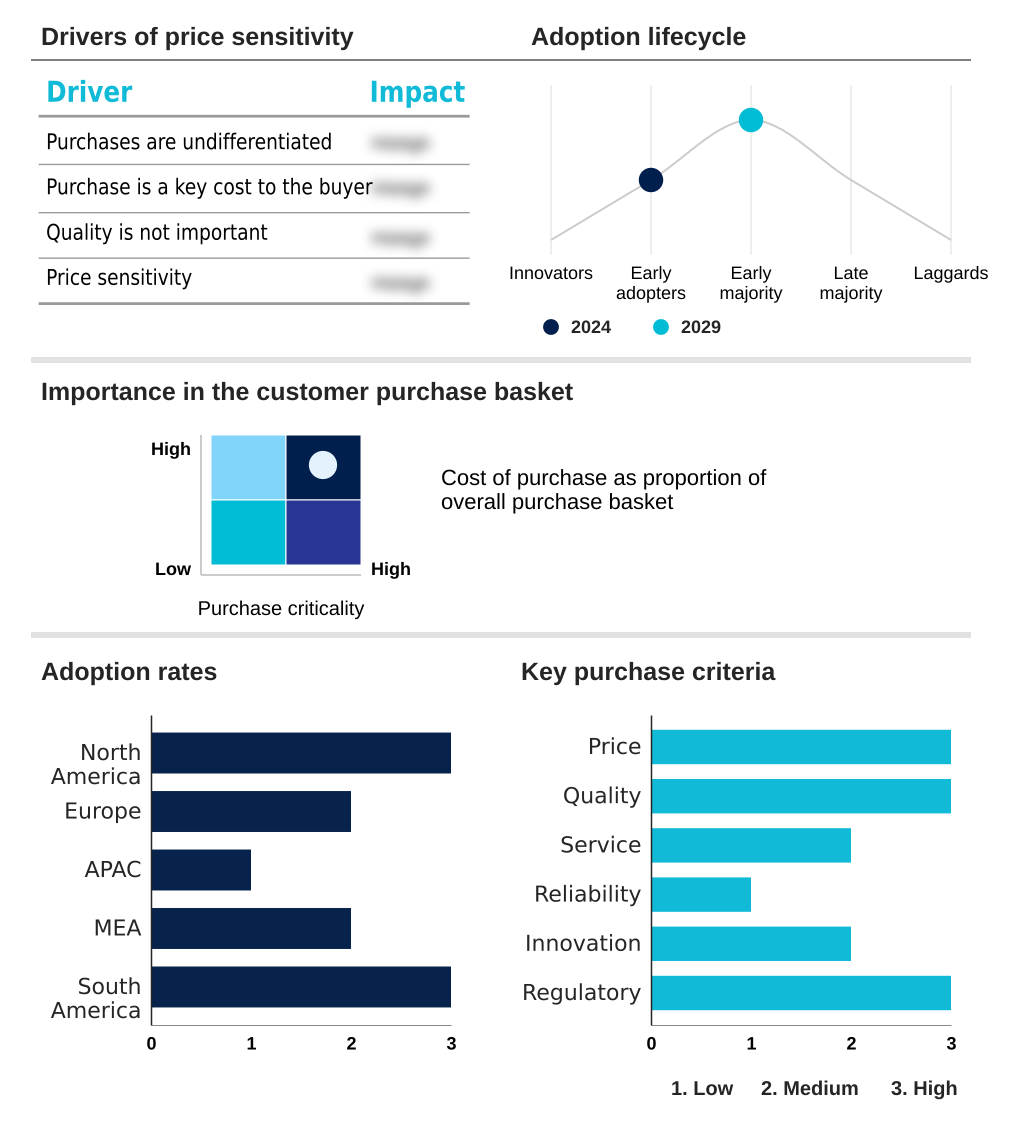
The casing cementation hardware market forecasting report includes the adoption lifecycle of the market, covering from the innovator’s stage to the laggard’s stage. It focuses on adoption rates in different regions based on penetration. Furthermore, the casing cementation hardware market report also includes key purchase criteria and drivers of price sensitivity to help companies evaluate and develop their market growth analysis strategies.
Customer Landscape of Casing Cementation Hardware Industry
Competitive Landscape
Companies are implementing various strategies, such as strategic alliances, casing cementation hardware market forecast, partnerships, mergers and acquisitions, geographical expansion, and product/service launches, to enhance their presence in the industry.
Baker Hughes Co. - Specialized cementing equipment is offered to optimize oil and gas exploration by enabling precise casing pipe installation at various depths, enhancing overall well construction.
The industry research and growth report includes detailed analyses of the competitive landscape of the market and information about key companies, including:
- Baker Hughes Co.
- Centek Holdings Ltd.
- DRILLING TOOLS INTERNATIONAL
- Drillstar Industries
- Ferro-Tube Oil Tools Co. LP
- Forum Energy Technologies Inc.
- Halliburton Co.
- Innovex
- Nabors Industries Ltd.
- Neoz Energy Pvt Ltd.
- NOV Inc.
- Schlumberger Ltd.
- Summit Casing Equipment
- Tenaris SA
- TMK
- Trican Well Service Ltd.
- Vallourec SA
- Varel Energy Solutions
- Weatherford International Plc
Qualitative and quantitative analysis of companies has been conducted to help clients understand the wider business environment as well as the strengths and weaknesses of key industry players. Data is qualitatively analyzed to categorize companies as pure play, category-focused, industry-focused, and diversified; it is quantitatively analyzed to categorize companies as dominant, leading, strong, tentative, and weak.
Recent Development and News in Casing cementation hardware market
- In September 2024, Baker Hughes Co. secured a major five-year contract to supply comprehensive casing and cementing hardware for a significant deepwater project offshore Brazil, reinforcing its presence in the region.
- In November 2024, Schlumberger Ltd. and a leading cloud provider announced a strategic collaboration to integrate real-time drilling data with AI-powered cement job modeling, aiming to enhance zonal isolation assurance in complex wells.
- In January 2025, Halliburton Co. launched its new 'Echo-Dissolve' series, a line of fully dissolvable frac plugs designed to reduce drill-out times by up to 75% in unconventional well completions.
- In March 2025, NOV Inc. announced the acquisition of a specialized composite materials firm for approximately $150 million to expand its portfolio of lightweight, corrosion-resistant centralizers for deepwater and HPHT applications.
Dive into Technavio’s robust research methodology, blending expert interviews, extensive data synthesis, and validated models for unparalleled Casing Cementation Hardware Market insights. See full methodology.
| Market Scope | |
|---|---|
| Page number | 291 |
| Base year | 2024 |
| Historic period | 2019-2023 |
| Forecast period | 2025-2029 |
| Growth momentum & CAGR | Accelerate at a CAGR of 5.9% |
| Market growth 2025-2029 | USD 3562.6 million |
| Market structure | Fragmented |
| YoY growth 2024-2025(%) | 5.5% |
| Key countries | US, Canada, Mexico, Russia, UK, Norway, The Netherlands, Germany, Spain, China, Australia, India, Malaysia, Indonesia, Japan, Saudi Arabia, UAE, Iraq, Algeria, Egypt, Brazil, Argentina and Chile |
| Competitive landscape | Leading Companies, Market Positioning of Companies, Competitive Strategies, and Industry Risks |
Research Analyst Overview
- The Casing Cementation Hardware Market is critical for safe and sustainable exploration and production (E&P). Its core function is to ensure wellbore integrity through effective zonal isolation, achieved via a meticulously engineered cementing process. This involves a suite of products, including the casing string, centralizers, and specialized float equipment like the float collar and float shoe.
- Key to successful well construction is the performance of cementing plugs and the cementing head during cement slurry placement. A major boardroom focus is mitigating long-term operational risk, such as sustained casing pressure, which is directly linked to the quality of the annular barrier.
- The industry is evolving beyond conventional methods, with intelligent completion and downhole sensors providing real-time data to optimize outcomes. For example, deploying corrosion resistant alloys in HPHT environments has been shown to extend well life by over 30%. This shift towards data-driven well completion technology, especially for horizontal drilling and hydraulic fracturing in deepwater drilling, is paramount.
- As the rig count fluctuates, the emphasis on efficiency—reducing non-productive time and addressing wellbore instability—dictates technology investment, impacting everything from liner hanger systems to sub-surface release plugs.
What are the Key Data Covered in this Casing Cementation Hardware Market Research and Growth Report?
-
What is the expected growth of the Casing Cementation Hardware Market between 2025 and 2029?
-
USD 3.56 billion, at a CAGR of 5.9%
-
-
What segmentation does the market report cover?
-
The report is segmented by Application (Onshore, Offshore), Type (Casing hardware, Cementation hardware), Material (Steel, Aluminum, Composite materials, Others) and Geography (North America, Europe, APAC, Middle East and Africa, South America)
-
-
Which regions are analyzed in the report?
-
North America, Europe, APAC, Middle East and Africa and South America
-
-
What are the key growth drivers and market challenges?
-
Increasing investments in upstream oil and gas operations, Fluctuation in oil and gas prices
-
-
Who are the major players in the Casing Cementation Hardware Market?
-
Baker Hughes Co., Centek Holdings Ltd., DRILLING TOOLS INTERNATIONAL, Drillstar Industries, Ferro-Tube Oil Tools Co. LP, Forum Energy Technologies Inc., Halliburton Co., Innovex, Nabors Industries Ltd., Neoz Energy Pvt Ltd., NOV Inc., Schlumberger Ltd., Summit Casing Equipment, Tenaris SA, TMK, Trican Well Service Ltd., Vallourec SA, Varel Energy Solutions and Weatherford International Plc
-
Market Research Insights
- The casing cementation hardware market is defined by a push for operational efficiency and the adoption of advanced technologies. Casing running services are now integral to complex well designs, where advanced centralizer design can reduce non-productive time by over 15%.
- In upstream oil and gas operations, effective wellbore cleanup tools are crucial for ensuring a strong cement bond, directly impacting long-term well integrity management. The oilfield equipment supply chain is adapting to provide just-in-time cementing accessories for varied drilling campaigns, from deepwater exploration to onshore unconventional resources.
- As drilling efficiency optimization becomes a primary goal, operators are adopting rig instrumentation software and automated cement placement systems, which have demonstrated a capacity to improve cementing success rates by more than 20% compared to manual methods.
We can help! Our analysts can customize this casing cementation hardware market research report to meet your requirements.
 RIA -
RIA - 
