
Intelligent Completion Market Size 2026-2030
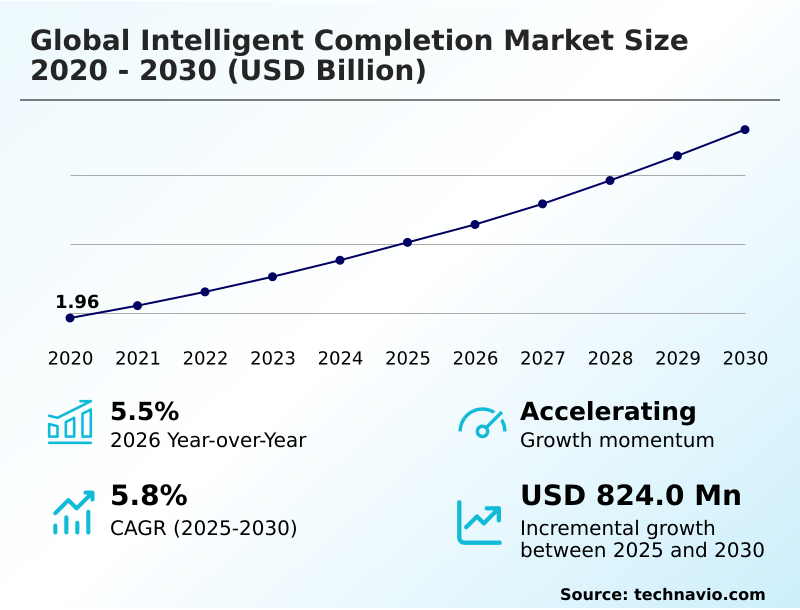
The intelligent completion market size is valued to increase by USD 824 million, at a CAGR of 5.8% from 2025 to 2030. Increasing reservoir complexity and drive for enhanced recovery will drive the intelligent completion market.
Major Market Trends & Insights
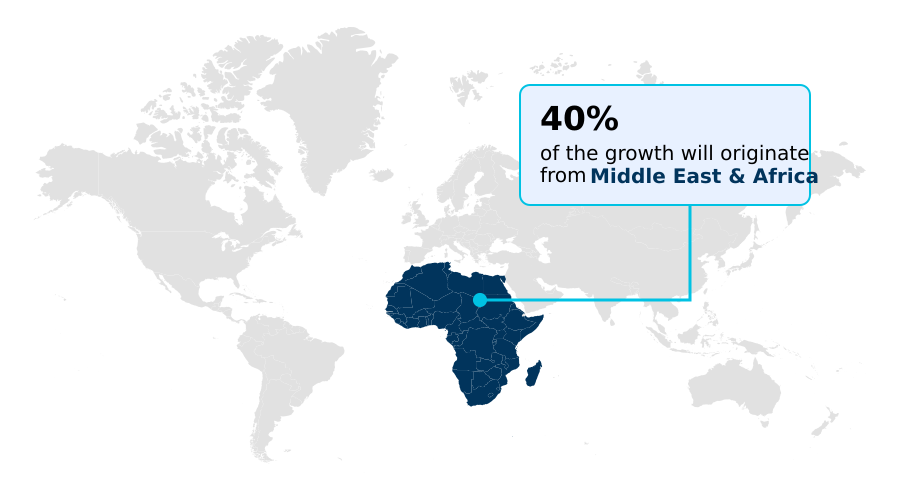
- Middle East and Africa dominated the market and accounted for a 40% growth during the forecast period.
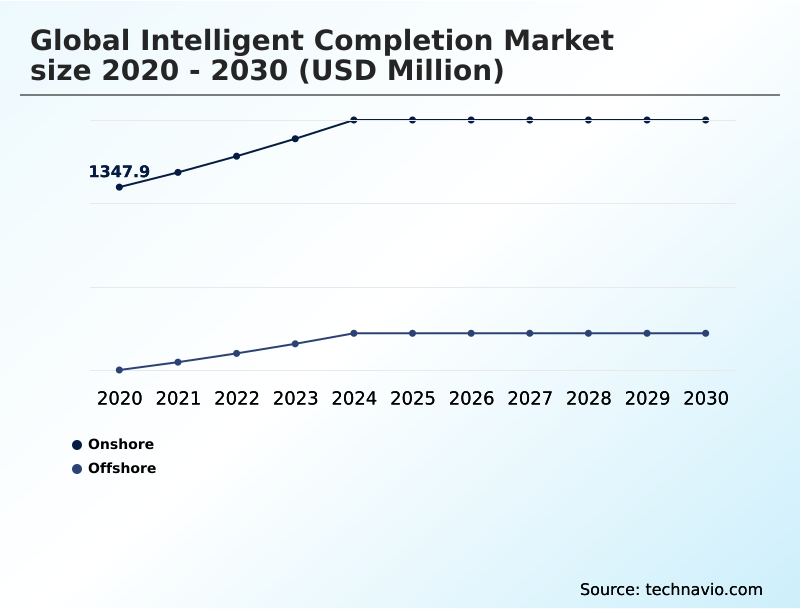
- By Application - Onshore segment was valued at USD 1.62 billion in 2024
- By Technology - Hydraulic segment accounted for the largest market revenue share in 2024
Market Size & Forecast
- Market Opportunities: USD 1.37 billion
- Market Future Opportunities: USD 824 million
- CAGR from 2025 to 2030 : 5.8%
Market Summary
- The intelligent completion market is foundational to the modern digital oilfield, offering remote control over reservoir performance to maximize asset value. The core of the technology involves installing permanent downhole sensors and remotely actuated flow control devices, enabling operators to acquire real-time data and make adjustments without costly well interventions.
- This capability is crucial in complex geological settings, such as deepwater environments and unconventional shale plays, where traditional methods are inefficient. For instance, an operator of a subsea asset can use an interventionless completion technology to manage production from multiple zones, leveraging data from downhole instrumentation for proactive production management.
- This data-driven reservoir analysis allows for the precise management of water injection in enhanced oil recovery projects, optimizing sweep efficiency and increasing the ultimate recovery factor.
- This shift from reactive to proactive well management, driven by digital oilfield integration and a focus on lifecycle well cost reduction, is a central pillar of the industry's push for greater operational efficiency and sustainability, all powered by real-time zonal control and autonomous well optimization.
What will be the Size of the Intelligent Completion Market during the forecast period?
Get Key Insights on Market Forecast (PDF) Get Free Sample
How is the Intelligent Completion Market Segmented?
The intelligent completion industry research report provides comprehensive data (region-wise segment analysis), with forecasts and estimates in "USD million" for the period 2026-2030, as well as historical data from 2020-2024 for the following segments.
- Application
- Onshore
- Offshore
- Technology
- Hydraulic
- Electric
- Hybrid
- Component
- Downhole monitoring systems
- Downhole control systems
- Surface control systems
- Communication systems
- Geography
- Middle East and Africa
- Saudi Arabia
- UAE
- South Africa
- North America
- US
- Canada
- Mexico
- Europe
- UK
- France
- Germany
- APAC
- China
- India
- Japan
- South America
- Brazil
- Argentina
- Rest of World (ROW)
- Middle East and Africa
By Application Insights
The onshore segment is estimated to witness significant growth during the forecast period.
Onshore applications are driven by the need to optimize unconventional resources and mature fields through enhanced oil recovery.
In shale plays, remotely actuated flow control and interval control valves manage production from distinct fracture stages, improving drawdown management by over 15%.
This granular control is facilitated by advanced downhole monitoring systems and downhole control systems, which are managed by integrated surface control systems. The technology enables real-time production optimization and supports complex reservoir management strategies.
As the industry advances, the adoption of all-electric architectures over traditional electro-hydraulic control systems is growing, particularly in steam assisted gravity drainage operations and for future carbon capture utilization storage projects, addressing the demands of unconventional shale resources.
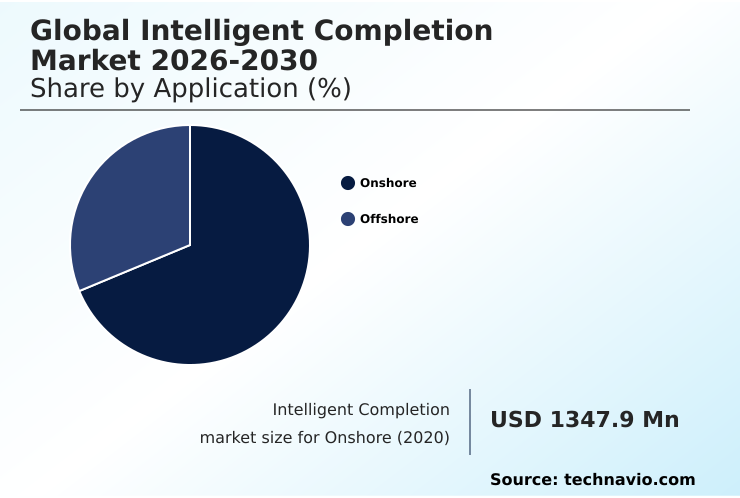
The Onshore segment was valued at USD 1.62 billion in 2024 and showed a gradual increase during the forecast period.
Regional Analysis
Middle East and Africa is estimated to contribute 40% to the growth of the global market during the forecast period.Technavio’s analysts have elaborately explained the regional trends and drivers that shape the market during the forecast period.
See How Intelligent Completion Market Demand is Rising in Middle East and Africa Get Free Sample
The geographic landscape of the intelligent completion market is diverse, shaped by regional drivers and asset types.
The Middle East and Africa lead in incremental growth opportunities, accounting for nearly 40% of the market expansion, largely through brownfield digitalization projects in mature fields.
In North America, the focus is on unconventional asset optimization, where advanced downhole instrumentation is used to enhance production from shale plays.
Meanwhile, South America, particularly Brazil, dominates in deepwater field development, with a focus on pre-salt reservoir development requiring robust systems for high-pressure, high-temperature environments.
Europe's mature market prioritizes mature field rejuvenation, using zonal isolation tools and electric actuation to extend asset life and improve sweep efficiency in EOR projects by up to 20%.
This regional specialization underscores the technology's adaptability, from managing subsea production systems to deploying inflow control devices in complex onshore wells.
Market Dynamics
Our researchers analyzed the data with 2025 as the base year, along with the key drivers, trends, and challenges. A holistic analysis of drivers will help companies refine their marketing strategies to gain a competitive advantage.
- Strategic decision-making in the intelligent completion market requires a nuanced understanding of specific applications and technical trade-offs. The debate over all-electric vs hydraulic completion reliability continues, with each architecture offering distinct advantages depending on the operational context. For instance, fiber optic sensing for SAGD optimization provides unparalleled thermal data, which is critical for managing steam chambers.
- In contrast, developing intelligent completion for deepwater gas fields prioritizes long-term pressure containment and flow assurance. The ability to achieve zonal isolation in multilateral wells is a key enabler for complex reservoir architectures, while effectively managing water coning with ICVs is a primary goal in mature fields.
- For secondary and tertiary recovery, downhole monitoring for EOR projects provides the essential feedback loop for injection strategies. A significant focus for technology providers is developing cost-effective completions for unconventional wells, as the economics of shale plays are highly sensitive. The reliability of electronics in HPHT environments remains a critical research area, pushing the boundaries of material science.
- Simultaneously, the application of intelligent systems for CCUS injection wells is growing, where monitoring well integrity with DAS is crucial for long-term storage security. This technology also enables optimizing flow in geothermal wells and is vital for reducing intervention in offshore assets. Advanced data integration for digital oilfield platforms allows for real-time data for reservoir model calibration.
- In unconventional fields, these systems help in managing frac hits in shale plays, while in conventional ones, they focus on improving sweep efficiency with zonal control and optimizing commingled production streams. The ultimate goal is the automating production with closed-loop systems, which is becoming increasingly viable.
- These specialized systems show failure rates several points lower than those in standard production environments, highlighting their superior performance in controlled applications.
What are the key market drivers leading to the rise in the adoption of Intelligent Completion Industry?
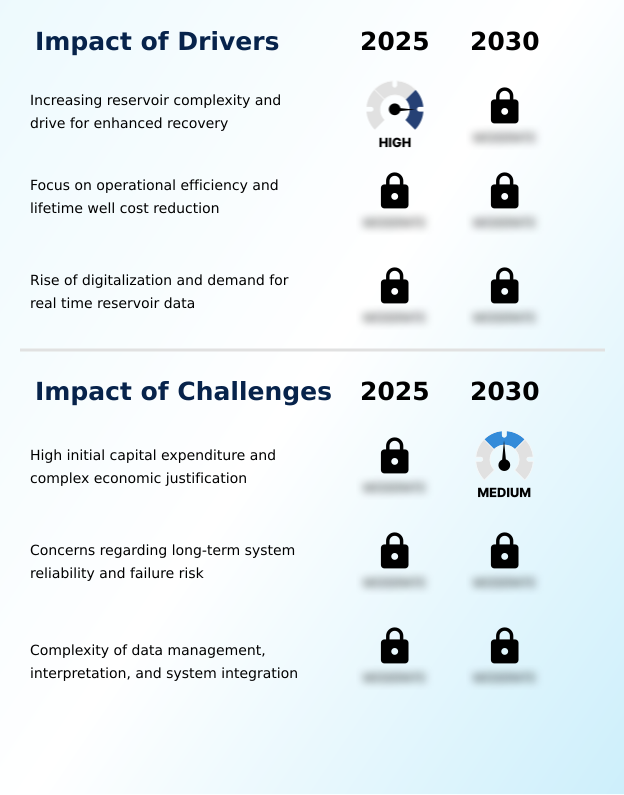
- The market is primarily driven by increasing reservoir complexity and the continuous industry-wide push for enhanced hydrocarbon recovery from challenging assets.
- The primary driver for market growth is the imperative to maximize recovery from increasingly complex assets while enhancing operational efficiency.
- The technology facilitates this by providing real-time reservoir data, which is essential for calibrating reservoir simulation models and enabling data-driven production decisions.
- This capability significantly reduces the need for physical well interventions, with some operators reporting a reduction in intervention-related costs by over 70%. In deepwater and subsea environments, this remote operational control is critical for subsea well intervention avoidance.
- The technology is also a key enabler for enhanced oil recovery schemes and emerging applications like carbon capture utilization storage and geothermal energy extraction, where precise zonal control is fundamental.
- By providing continuous zonal monitoring and enabling remote well testing, intelligent completions improve ultimate recovery by as much as 15% and ensure long-term well integrity.
What are the market trends shaping the Intelligent Completion Industry?
- A key trend shaping the market is the deep integration of artificial intelligence and advanced data analytics. This convergence elevates reservoir management workflows by enabling predictive and prescriptive optimization.
- A defining market trend is the convergence of advanced hardware and data analytics, creating a closed-loop autonomous system for well management. The move towards all-electric architectures, powered by a single downhole electrical cable, is driven by a demand for higher reliability and precision, reducing system response times by up to 50% compared to legacy hydraulic systems.
- These systems enable sophisticated zonal production allocation through precise control of downhole flow control valves and downhole actuators. Advanced downhole telemetry systems feed a constant stream of data from downhole sensors into analytical platforms. This allows for dynamic drawdown strategies and hydraulic fracturing optimization in real time.
- The ultimate vision is the self-adjusting well concept, where an autonomous inflow control valve can preemptively mitigate issues, improving forecast accuracy by over 15% and driving the future of advanced reservoir surveillance.
What challenges does the Intelligent Completion Industry face during its growth?
- A key challenge impeding market growth is the high initial capital expenditure of the technology, coupled with the complexity of justifying the investment through long-term value projections.
- The primary market challenges revolve around high initial costs, long-term reliability, and data management complexity. The upfront capital expenditure for an intelligent system can be two to three times that of a conventional completion, creating a significant barrier for projects with tight economic margins.
- Furthermore, concerns about the long-term reliability of the downhole permanent cable and other electronics in harsh environments lead to a focus on interventionless completion technologies.
- A major hurdle is the complexity of data management; without robust digital oilfield integration, the vast amount of data from fiber optic sensing solutions, such as distributed temperature sensing and distributed acoustic sensing, can become overwhelming.
- Data interpretation and integration can account for up to 40% of the ongoing operational workload if not properly managed, hindering the path toward autonomous well optimization and true real-time zonal control.
Exclusive Technavio Analysis on Customer Landscape
The intelligent completion market forecasting report includes the adoption lifecycle of the market, covering from the innovator’s stage to the laggard’s stage. It focuses on adoption rates in different regions based on penetration. Furthermore, the intelligent completion market report also includes key purchase criteria and drivers of price sensitivity to help companies evaluate and develop their market growth analysis strategies.
Customer Landscape of Intelligent Completion Industry
Competitive Landscape
Companies are implementing various strategies, such as strategic alliances, intelligent completion market forecast, partnerships, mergers and acquisitions, geographical expansion, and product/service launches, to enhance their presence in the industry.
Archer Ltd. - Delivering systems for downhole data collection, transmission, and analysis, enabling real-time remote control of reservoir zones to optimize well performance.
The industry research and growth report includes detailed analyses of the competitive landscape of the market and information about key companies, including:
- Archer Ltd.
- Baker Hughes Co.
- Expro Group Holdings NV
- Halliburton Co.
- InflowControl
- Interwell Norway AS
- Metrol Technology
- NOV Inc.
- Oceaneering International Inc.
- Packers Plus Energy Services Inc
- RGL Reservoir Management
- Rubicon Oilfield International
- Schlumberger Ltd.
- TCO AS
- TechnipFMC plc
- Tendeka
- Weatherford International Plc
- Welltec AS
- Ziebel
Qualitative and quantitative analysis of companies has been conducted to help clients understand the wider business environment as well as the strengths and weaknesses of key industry players. Data is qualitatively analyzed to categorize companies as pure play, category-focused, industry-focused, and diversified; it is quantitatively analyzed to categorize companies as dominant, leading, strong, tentative, and weak.
Recent Development and News in Intelligent completion market
- In January 2025, Schlumberger announced the successful deployment of its next-generation intelligent completion system in the Permian Basin, enhancing real-time monitoring and operational efficiency.
- In March 2025, Halliburton and Baker Hughes revealed a strategic collaboration to integrate their respective intelligent completion technologies, aiming to provide more comprehensive and seamless downhole solutions.
- In April 2025, Equinor completed a pilot program retrofitting subsea wells in the Troll field with advanced all-electric intelligent completion systems from Baker Hughes, improving control and reducing environmental risk.
- In May 2025, ADNOC initiated a large-scale brownfield digitalization project to retrofit thousands of existing onshore wells with intelligent completion technologies to improve recovery factors and extend asset life.
Dive into Technavio’s robust research methodology, blending expert interviews, extensive data synthesis, and validated models for unparalleled Intelligent Completion Market insights. See full methodology.
| Market Scope | |
|---|---|
| Page number | 300 |
| Base year | 2025 |
| Historic period | 2020-2024 |
| Forecast period | 2026-2030 |
| Growth momentum & CAGR | Accelerate at a CAGR of 5.8% |
| Market growth 2026-2030 | USD 824.0 million |
| Market structure | Fragmented |
| YoY growth 2025-2026(%) | 5.5% |
| Key countries | Saudi Arabia, UAE, South Africa, Israel, Turkey, US, Canada, Mexico, UK, France, Germany, Italy, The Netherlands, Spain, China, India, Japan, Australia, South Korea, Indonesia, Brazil, Argentina and Chile |
| Competitive landscape | Leading Companies, Market Positioning of Companies, Competitive Strategies, and Industry Risks |
Research Analyst Overview
- The intelligent completion market's evolution is defined by the integration of sophisticated hardware and software. Core systems combine downhole monitoring systems, downhole control systems, and surface control systems to provide a complete feedback loop. The hardware includes downhole sensors, downhole flow control valves, and interval control valves, often featuring an autonomous inflow control valve for passive management.
- Communication is enabled by downhole telemetry systems and the downhole permanent cable, which can be a downhole electrical cable for all-electric architectures or part of electro-hydraulic control systems. These systems deliver power to downhole actuators and a downhole electro-hydraulic power unit, enabling remotely actuated flow control and zonal control.
- Key enabling technologies are fiber optic sensing solutions, including distributed temperature sensing and distributed acoustic sensing, alongside permanent downhole gauges for point measurements. The trend towards electric actuation offers precision and faster response times, with some systems demonstrating a 30% quicker valve adjustment compared to legacy hydraulic actuation. This supports infinitely variable interval control for fine-tuning production.
- The integration of data from zonal monitoring, multiphase flow measurement, downhole fluid analysis, and remote well testing into production control platforms and reservoir simulation models is critical. Boardroom decisions increasingly focus on funding the digital infrastructure required to process this influx of real-time reservoir data, recognizing it as essential for optimizing high-pressure, high-temperature environments and complex subsea control systems.
What are the Key Data Covered in this Intelligent Completion Market Research and Growth Report?
-
What is the expected growth of the Intelligent Completion Market between 2026 and 2030?
-
USD 824 million, at a CAGR of 5.8%
-
-
What segmentation does the market report cover?
-
The report is segmented by Application (Onshore, and Offshore), Technology (Hydraulic, Electric, and Hybrid), Component (Downhole monitoring systems, Downhole control systems, Surface control systems, and Communication systems) and Geography (Middle East and Africa, North America, Europe, APAC, South America)
-
-
Which regions are analyzed in the report?
-
Middle East and Africa, North America, Europe, APAC and South America
-
-
What are the key growth drivers and market challenges?
-
Increasing reservoir complexity and drive for enhanced recovery, High initial capital expenditure and complex economic justification
-
-
Who are the major players in the Intelligent Completion Market?
-
Archer Ltd., Baker Hughes Co., Expro Group Holdings NV, Halliburton Co., InflowControl, Interwell Norway AS, Metrol Technology, NOV Inc., Oceaneering International Inc., Packers Plus Energy Services Inc, RGL Reservoir Management, Rubicon Oilfield International, Schlumberger Ltd., TCO AS, TechnipFMC plc, Tendeka, Weatherford International Plc, Welltec AS and Ziebel
-
Market Research Insights
- The intelligent completion market's momentum is driven by a strategic shift towards proactive production management, which reduces well intervention costs by over 60%. This evolution leverages digital oilfield integration, enabling real-time production optimization and complex reservoir management. In deepwater field development and unconventional asset optimization, adoption rates have increased as the technology proves essential for improving recovery factors by 5-10%.
- The focus on lifecycle well cost reduction is paramount, with data-driven reservoir analysis allowing operators to de-risk capital-intensive projects. Through advanced reservoir surveillance and autonomous well optimization, operators can achieve enhanced oil recovery with greater efficiency. This data-centric approach is reshaping operational strategies across the industry.
We can help! Our analysts can customize this intelligent completion market research report to meet your requirements.
 RIA -
RIA - 
