Casino Gaming Market Analysis US - Size and Forecast 2024-2028

Casino Gaming Market Analysis US - Size and Forecast 2024-2028

Published: Jul 2024 133 Pages SKU: IRTNTR70689

Market Overview at a Glance

$9.5 B
Market Opportunity
3.22%
CAGR
3.07
YoY growth 2023-2024(%)

US Casino Gaming Market Size 2024-2028 

The US casino gaming market size is estimated to grow by USD 9.5 billion accelerating at a CAGR of 3.22% between 2023 and 2028. The online casino industry is experiencing significant growth due to several key factors. Firstly, the increasing spending capability of customers, driven by economic stability and disposable income, is fueling a rise in demand for online gaming. Secondly, the penetration of online casino platforms has expanded exponentially, making gaming more accessible than ever before. Lastly, the easing of government regulations in various jurisdictions has allowed for the legalization and normalization of online casino gaming, further boosting its popularity. These factors combined are creating a favorable environment for the continued growth and success of the online casino industry.

Casino Gaming Market in US Size

Get Additional Information on this Report, Request Free Sample in PDF

Market Dynamics

The market is a dynamic and evolving industry, characterized by various gaming options and innovative technologies. The market caters to diverse end-use segments, including online and offline casinos, sports betting, lotteries, and gaming arcades. The market's growth is driven by several factors, including customer preferences for convenience and immersive gaming experiences. In terms of gaming options, the market offers a wide range, from traditional table games like poker and blackjack to slot machines and electronic games. The use of advanced technology, such as virtual reality and augmented reality, is becoming increasingly popular, providing players with a more engaging and interactive experience. The market also prioritizes sustainability, with a focus on eco-friendly packaging options and regulatory compliance. Sustainable packaging materials, such as bioplastics and paper, are gaining popularity, while regulatory pressure and customer awareness are driving the adoption of sustainable practices in the industry. The market is segmented based on end-use and closure options. Closure options include spout closures, which are commonly used in ready-to-drink beverages, and standard closures, which are used in various packaged food and beverage applications. The market also offers various treatment types, such as metal, plastic, and paper, to cater to diverse customer preferences.

Key Market Driver

The growth in spending capability of customers is a key driver boosting the market. The surge in dual-income households in the US signifies higher per capita disposable income, boosting affordability for luxury items and spending capacity. Globally, the workforce's female representation has risen substantially. In 2022, over 57% of US women were employed, and 70% of mothers with children under 18 were part of the workforce, elevating income levels. This economic empowerment has led to increased expenditure on recreational activities like sports betting, also becoming a status symbol among the affluent. The casino gaming market in the US is experiencing significant growth due to rising income levels, increased awareness, and enhanced security measures on online platforms.

Significant Market Trends

The public image enhancement is a key trend shaping the growth of the market in US. The US casino gaming market grapples with a tarnished public perception, leading to bans in certain states based on moral or religious grounds. The industry is often associated with fraud, prompting government monitoring to ensure vendor legitimacy and equal player opportunities. To rebuild trust, increased contributions to social welfare and developmental initiatives are being emphasized. These measures aim to enhance market credibility and encourage player confidence, fostering growth in the forecasted period.

Major Market Challenges

The difficulties in securing online payments is a key factor hindering the growth of the market in US. Most US casino gaming firms process payments via credit or debit cards, necessitating compliance with the Payment Card Industry Data Security Standard (PCI-DSS) to safeguard customers' financial information and minimize fraud. Adhering to PCI-DSS is crucial in reducing the risk of financial losses resulting from card-related fraud. Security solution providers like Thales Solutions offer end-to-end encryption services to enhance payment security for casino gaming companies. However, varying security budgets among companies may limit widespread implementation of external security services, presenting a substantial challenge to the US casino gaming market in the forecast period.

Market Segmentation

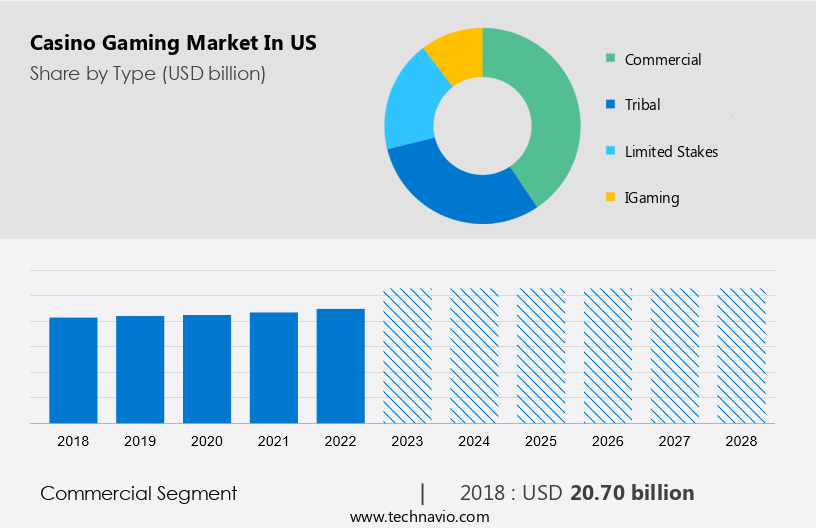
The commercial segment is set for significant growth in the US casino gambling market. Dominated by major players like commercial casinos, these establishments offer diverse gaming options, including traditional table games and the latest video slots. Many commercial casinos go beyond gaming, featuring luxury hotels, restaurants, and entertainment venues for a complete experience. Their success lies in attracting a broad customer base, from high rollers with VIP areas to casual players. Loyalty programs, offering perks like free games and hotel stays, contribute to customer retention. Overall, the commercial segment's strategic approach ensures a comprehensive and appealing entertainment experience for various audiences.

Casino Gaming Market in US Size

Get a glance at the market contribution of various segments Request Free Sample

The commercial segment was valued at USD 20.70 billion in 2018. The growth of commercial casinos in the US can also be attributed to the adoption of technology. Many casinos have integrated digital gaming options such as online slots and mobile betting to appeal to younger audiences who prefer gaming on mobile devices. In addition, advances in gaming software are making casinos more immersive and visual. Therefore, the factors mentioned above are expected to drive the growth of the commercial segment of the US Casino Gaming Market during the forecast period.  

Casino Gaming Market In US Customer Landscape

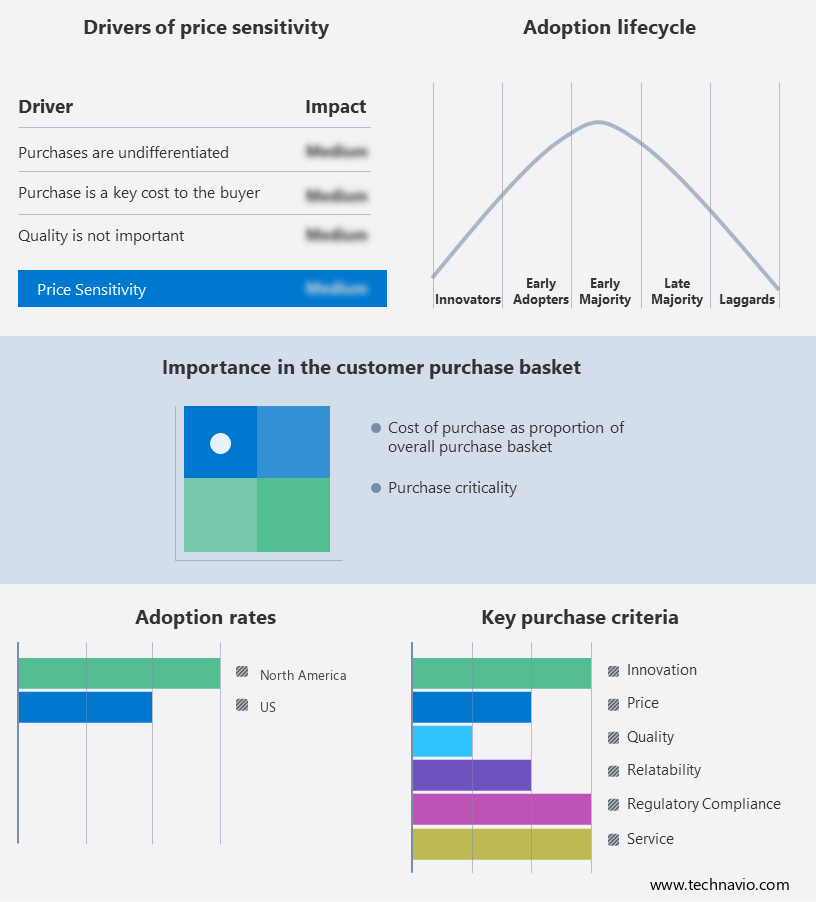
The market research report includes the adoption lifecycle of the market, covering from the innovator's stage to the laggard's stage. It focuses on adoption rates in different regions based on penetration. Furthermore, the report also includes key purchase criteria and drivers of price sensitivity to help companies evaluate and develop their growth strategies.

Casino Gaming Market in US Share by Geography

Segment Overview

The market research report provides comprehensive data (region wise segment analysis), with forecasts and estimates in "USD Billion" for the period 2024 to 2028, as well as historical data from 2018 to 2022 for the following segments.

  • Type Outlook
    • Commercial
    • Tribal
    • Limited stakes
    • iGaming
  • Platform Outlook
    • Traditional
    • Online

You may also be interested in:

  • Casino Gaming Market Analysis North America, APAC, Europe, South America, Middle East and Africa - US, Canada, China, France, Germany - Size and Forecast 
  • Casino Gaming Equipment Market Analysis North America, APAC, Europe, South America, Middle East and Africa - US, China, UK, Germany, Canada - Size and Forecast 
  • Philippines Casino Gaming Market by Type, Product, and Geography - Forecast and Analysis 

Market Analyst Overview

The casino gaming industry is continually evolving, with new games, technologies, and marketing tactics emerging to attract and retain customers. One area of innovation that has gained significant attention is sustainable packaging in the ready-to-eat (RTE) food sector. Instead of focusing on traditional transportation vehicles, casinos are now adopting eco-friendly packaging solutions for their snacks, beverages, and other RTE food offerings. Stand-up pouches made of lightweight, plastic-based materials like Polyethylene, Polypropylene, Polyethylene Terephthalate, polyhydroxyalkanoates, and polylactic acid are increasingly popular. These materials offer advantages such as flexibility, easy transportation, and reduced carbon footprint. Biodegradable materials, such as those derived from plant-based sources, are also gaining traction. Companies like Omniplast are leading the way with their innovative packaging solutions for the pet food industry. Closure options, such as reusable or recyclable metal and paper alternatives, are also being explored to further reduce waste. Marketing these sustainable packaging options effectively is crucial. Casinos can emphasize the ecological rating of their packaging and the regulatory pressure driving the shift towards sustainable solutions. Printed images of natural environments or eco-friendly messaging can be used to appeal to customers' growing awareness of sustainability. Food processing processes can also be highlighted as part of the marketing strategy. For instance, casinos can showcase how their use of sustainable packaging contributes to the frozen packaged industry's standardization and the overall growth of the packaged food market.

In conclusion, sustainable packaging is an effective marketing tactic for casinos looking to attract and retain customers. By offering RTE food and beverages in eco-friendly packaging, casinos can differentiate themselves from competitors, meet regulatory requirements, and align with customers' evolving values. The casino gaming market is diversifying with advancements in packaging machinery and flexible packaging products tailored for various needs. Packaging manufacturers are exploring innovations in plastic-based packaging products, including recyclable pouches and bioplastic materials like PHAs and PLA. This trend is evident in the alcoholic beverages and baby food products sectors, where plastic material and closure types enhance portability and food waste management. The frozen packaged industry and ready-to-eat meals benefit from flat pouch and small-sized packs solutions. Personal care and cosmetic applications also leverage plastic resins for packaging. Organized retail penetration and transportation vehicles play a role in distributing CPG products such as dried fruits, confectionery, and dairy products.

Market Scope

Report Coverage

Details

Page number

133

Base year

2023

Historic period

2018 - 2022

Forecast period

2024-2028

Growth momentum & CAGR

Accelerate at a CAGR of 3.22%

Market growth 2024-2028

USD 9.5 billion

Market structure

Fragmented

YoY growth 2023-2024(%)

3.07

Competitive landscape

Leading Companies, Market Positioning of Companies, Competitive Strategies, and Industry Risks

Key companies profiled

Angel Group Co. Ltd., Aristocrat Leisure Ltd., Bet365 Group Ltd., Caesars Entertainment Inc., Churchill Downs Inc., DraftKings Inc., Eclipse Gaming Systems, Entain Plc, Everi Holdings Inc., Fertitta Entertainment Inc., Incredible Technologies Inc., International Game Technology plc, INTRALOT SA, Kindred Group Plc, Konami Group Corp., Light and Wonder Inc., PENN Entertainment Inc., PlayAGS Inc., Rye Park LLC, and Universal Entertainment Corp.

Market dynamics

Parent market analysis, Market growth inducers and obstacles, Fast-growing and slow-growing segment analysis, Market growth and Forecasting, COVID 19 impact and recovery analysis and future consumer dynamics, Market condition analysis for market forecast period

Customization purview

If our market forecasting report has not included the data that you are looking for, you can reach out to our analysts and get segments customized.

Download PDF Sample

What are the Key Data Covered in this Casino Gaming Market Report?

  • CAGR of the market during the forecast period
  • Detailed information on factors that will drive the market growth and forecasting of the market between 2024 and 2028
  • Precise estimation of the market growth and trends, market size and its contribution to the parent market
  • Accurate predictions about upcoming market trends and analysis and changes in consumer behavior
  • Growth of the market across the US
  • Thorough market growth analysis of the market's competitive landscape and detailed information about companies
  • Comprehensive market analysis and report on the factors that will challenge the market research and growth of market companies

We can help! Our analysts can customize this market research report to meet your requirements. 

Get in touch

1 Executive Summary

  • 1.1 Market overview
    • Executive Summary - Chart on Market Overview
    • Executive Summary - Data Table on Market Overview
    • Executive Summary - Chart on Country Market Characteristics
    • Executive Summary - Chart on Market Segmentation by Type
    • Executive Summary - Chart on Market Segmentation by Platform
    • Executive Summary - Chart on Company Market Positioning

2 Market Landscape

  • 2.1 Market ecosystem
    • Parent Market
    • Data Table on - Parent Market
  • 2.2 Market characteristics
    • Market characteristics analysis
  • 2.3 Value chain analysis
    • Value Chain Analysis

3 Market Sizing

  • 3.1 Market definition
    • Offerings of companies included in the market definition
  • 3.2 Market segment analysis
    • Market segments
  • 3.3 Market size 2023
    • 3.4 Market outlook: Forecast for 2023-2028
      • Chart on US - Market size and forecast 2023-2028 ($ billion)
      • Data Table on US - Market size and forecast 2023-2028 ($ billion)
      • Chart on US: Year-over-year growth 2023-2028 (%)
      • Data Table on US: Year-over-year growth 2023-2028 (%)

    4 Historic Market Size

    • 4.1 Casino Gaming Market in US 2018 - 2022
      • Historic Market Size - Data Table on Casino Gaming Market in US 2018 - 2022 ($ billion)
    • 4.2 Type segment analysis 2018 - 2022
      • Historic Market Size - Type Segment 2018 - 2022 ($ billion)
    • 4.3 Platform segment analysis 2018 - 2022
      • Historic Market Size - Platform Segment 2018 - 2022 ($ billion)

    5 Five Forces Analysis

    • 5.1 Five forces summary
      • Five forces analysis - Comparison between 2023 and 2028
    • 5.2 Bargaining power of buyers
      • Bargaining power of buyers - Impact of key factors 2023 and 2028
    • 5.3 Bargaining power of suppliers
      • Bargaining power of suppliers - Impact of key factors in 2023 and 2028
    • 5.4 Threat of new entrants
      • Threat of new entrants - Impact of key factors in 2023 and 2028
    • 5.5 Threat of substitutes
      • Threat of substitutes - Impact of key factors in 2023 and 2028
    • 5.6 Threat of rivalry
      • Threat of rivalry - Impact of key factors in 2023 and 2028
    • 5.7 Market condition
      • Chart on Market condition - Five forces 2023 and 2028

    6 Market Segmentation by Type

    • 6.1 Market segments
      • Chart on Type - Market share 2023-2028 (%)
      • Data Table on Type - Market share 2023-2028 (%)
    • 6.2 Comparison by Type
      • Chart on Comparison by Type
      • Data Table on Comparison by Type
    • 6.3 Commercial - Market size and forecast 2023-2028
      • Chart on Commercial - Market size and forecast 2023-2028 ($ billion)
      • Data Table on Commercial - Market size and forecast 2023-2028 ($ billion)
      • Chart on Commercial - Year-over-year growth 2023-2028 (%)
      • Data Table on Commercial - Year-over-year growth 2023-2028 (%)
    • 6.4 Tribal - Market size and forecast 2023-2028
      • Chart on Tribal - Market size and forecast 2023-2028 ($ billion)
      • Data Table on Tribal - Market size and forecast 2023-2028 ($ billion)
      • Chart on Tribal - Year-over-year growth 2023-2028 (%)
      • Data Table on Tribal - Year-over-year growth 2023-2028 (%)
    • 6.5 Limited stakes - Market size and forecast 2023-2028
      • Chart on Limited stakes - Market size and forecast 2023-2028 ($ billion)
      • Data Table on Limited stakes - Market size and forecast 2023-2028 ($ billion)
      • Chart on Limited stakes - Year-over-year growth 2023-2028 (%)
      • Data Table on Limited stakes - Year-over-year growth 2023-2028 (%)
    • 6.6 iGaming - Market size and forecast 2023-2028
      • Chart on iGaming - Market size and forecast 2023-2028 ($ billion)
      • Data Table on iGaming - Market size and forecast 2023-2028 ($ billion)
      • Chart on iGaming - Year-over-year growth 2023-2028 (%)
      • Data Table on iGaming - Year-over-year growth 2023-2028 (%)
    • 6.7 Market opportunity by Type
      • Market opportunity by Type ($ billion)
      • Data Table on Market opportunity by Type ($ billion)

    7 Market Segmentation by Platform

    • 7.1 Market segments
      • Chart on Platform - Market share 2023-2028 (%)
      • Data Table on Platform - Market share 2023-2028 (%)
    • 7.2 Comparison by Platform
      • Chart on Comparison by Platform
      • Data Table on Comparison by Platform
    • 7.3 Traditional - Market size and forecast 2023-2028
      • Chart on Traditional - Market size and forecast 2023-2028 ($ billion)
      • Data Table on Traditional - Market size and forecast 2023-2028 ($ billion)
      • Chart on Traditional - Year-over-year growth 2023-2028 (%)
      • Data Table on Traditional - Year-over-year growth 2023-2028 (%)
    • 7.4 Online - Market size and forecast 2023-2028
      • Chart on Online - Market size and forecast 2023-2028 ($ billion)
      • Data Table on Online - Market size and forecast 2023-2028 ($ billion)
      • Chart on Online - Year-over-year growth 2023-2028 (%)
      • Data Table on Online - Year-over-year growth 2023-2028 (%)
    • 7.5 Market opportunity by Platform
      • Market opportunity by Platform ($ billion)
      • Data Table on Market opportunity by Platform ($ billion)

    8 Customer Landscape

    • 8.1 Customer landscape overview
      • Analysis of price sensitivity, lifecycle, customer purchase basket, adoption rates, and purchase criteria

    9 Drivers, Challenges, and Opportunity/Restraints

    • 9.1 Market drivers
      • 9.2 Market challenges
        • 9.3 Impact of drivers and challenges
          • Impact of drivers and challenges in 2023 and 2028
        • 9.4 Market opportunities/restraints

          10 Competitive Landscape

          • 10.1 Overview
            • 10.2 Competitive Landscape
              • Overview on criticality of inputs and factors of differentiation
            • 10.3 Landscape disruption
              • Overview on factors of disruption
            • 10.4 Industry risks
              • Impact of key risks on business

            11 Competitive Analysis

            • 11.1 Companies profiled
              • Companies covered
            • 11.2 Market positioning of companies
              • Matrix on companies position and classification
            • 11.3 Angel Group Co. Ltd.
              • Angel Group Co. Ltd. - Overview
              • Angel Group Co. Ltd. - Product / Service
              • Angel Group Co. Ltd. - Key offerings
            • 11.4 Aristocrat Leisure Ltd.
              • Aristocrat Leisure Ltd. - Overview
              • Aristocrat Leisure Ltd. - Business segments
              • Aristocrat Leisure Ltd. - Key offerings
              • Aristocrat Leisure Ltd. - Segment focus
            • 11.5 Bet365 Group Ltd.
              • Bet365 Group Ltd. - Overview
              • Bet365 Group Ltd. - Product / Service
              • Bet365 Group Ltd. - Key offerings
            • 11.6 Caesars Entertainment Inc.
              • Caesars Entertainment Inc. - Overview
              • Caesars Entertainment Inc. - Business segments
              • Caesars Entertainment Inc. - Key offerings
              • Caesars Entertainment Inc. - Segment focus
            • 11.7 Churchill Downs Inc.
              • Churchill Downs Inc. - Overview
              • Churchill Downs Inc. - Business segments
              • Churchill Downs Inc. - Key offerings
              • Churchill Downs Inc. - Segment focus
            • 11.8 Eclipse Gaming Systems
              • Eclipse Gaming Systems - Overview
              • Eclipse Gaming Systems - Product / Service
              • Eclipse Gaming Systems - Key offerings
            • 11.9 Incredible Technologies Inc.
              • Incredible Technologies Inc. - Overview
              • Incredible Technologies Inc. - Product / Service
              • Incredible Technologies Inc. - Key offerings
            • 11.10 International Game Technology plc
              • International Game Technology plc - Overview
              • International Game Technology plc - Business segments
              • International Game Technology plc - Key offerings
              • International Game Technology plc - Segment focus
            • 11.11 INTRALOT SA
              • INTRALOT SA - Overview
              • INTRALOT SA - Business segments
              • INTRALOT SA - Key offerings
              • INTRALOT SA - Segment focus
            • 11.12 Kindred Group Plc
              • Kindred Group Plc - Overview
              • Kindred Group Plc - Business segments
              • Kindred Group Plc - Key offerings
              • Kindred Group Plc - Segment focus
            • 11.13 Konami Group Corp.
              • Konami Group Corp. - Overview
              • Konami Group Corp. - Business segments
              • Konami Group Corp. - Key offerings
              • Konami Group Corp. - Segment focus
            • 11.14 Light and Wonder Inc.
              • Light and Wonder Inc. - Overview
              • Light and Wonder Inc. - Business segments
              • Light and Wonder Inc. - Key offerings
              • Light and Wonder Inc. - Segment focus
            • 11.15 PENN Entertainment Inc.
              • PENN Entertainment Inc. - Overview
              • PENN Entertainment Inc. - Business segments
              • PENN Entertainment Inc. - Key offerings
              • PENN Entertainment Inc. - Segment focus
            • 11.16 PlayAGS Inc.
              • PlayAGS Inc. - Overview
              • PlayAGS Inc. - Business segments
              • PlayAGS Inc. - Key offerings
              • PlayAGS Inc. - Segment focus
            • 11.17 Universal Entertainment Corp.
              • Universal Entertainment Corp. - Overview
              • Universal Entertainment Corp. - Business segments
              • Universal Entertainment Corp. - Key offerings
              • Universal Entertainment Corp. - Segment focus

            12 Appendix

            • 12.1 Scope of the report
              • 12.2 Inclusions and exclusions checklist
                • Inclusions checklist
                • Exclusions checklist
              • 12.3 Currency conversion rates for US$
                • Currency conversion rates for US$
              • 12.4 Research methodology
                • Research methodology
              • 12.5 Data procurement
                • Information sources
              • 12.6 Data validation
                • Data validation
              • 12.7 Validation techniques employed for market sizing
                • Validation techniques employed for market sizing
              • 12.8 Data synthesis
                • Data synthesis
              • 12.9 360 degree market analysis
                • 360 degree market analysis
              • 12.10 List of abbreviations
                • List of abbreviations

              Research Methodology

              Technavio presents a detailed picture of the market by way of study, synthesis, and summation of data from multiple sources. The analysts have presented the various facets of the market with a particular focus on identifying the key industry influencers. The data thus presented is comprehensive, reliable, and the result of extensive research, both primary and secondary.

              INFORMATION SOURCES

              Primary sources

              • Manufacturers and suppliers
              • Channel partners
              • Industry experts
              • Strategic decision makers

              Secondary sources

              • Industry journals and periodicals
              • Government data
              • Financial reports of key industry players
              • Historical data
              • Press releases

              DATA ANALYSIS

              Data Synthesis

              • Collation of data
              • Estimation of key figures
              • Analysis of derived insights

              Data Validation

              • Triangulation with data models
              • Reference against proprietary databases
              • Corroboration with industry experts

              REPORT WRITING

              Qualitative

              • Market drivers
              • Market challenges
              • Market trends
              • Five forces analysis

              Quantitative

              • Market size and forecast
              • Market segmentation
              • Geographical insights
              • Competitive landscape

              Interested in this report?

              Get your sample now to see our research methodology and insights!

              Download Now

              Frequently Asked Questions

              Casino Gamingin US market growth will increase by $ 9.5 bn during 2024-2028 .

              The Casino Gamingin US market is expected to grow at a CAGR of 3.22% during 2024-2028 .

              Casino Gamingin US market is segmented by Type( Commercial, Tribal, Limited stakes, iGaming) Platform( Traditional, Online)

              Angel Group Co. Ltd., Aristocrat Leisure Ltd., Bet365 Group Ltd., Caesars Entertainment Inc., Churchill Downs Inc., DraftKings Inc., Eclipse Gaming Systems, Entain Plc, Everi Holdings Inc., Fertitta Entertainment Inc., Incredible Technologies Inc., International Game Technology plc, INTRALOT SA, Kindred Group Plc, Konami Group Corp., Light and Wonder Inc., PENN Entertainment Inc., PlayAGS Inc., Rye Park LLC, Universal Entertainment Corp. are a few of the key vendors in the Casino Gamingin US market.

              North America will register the highest growth rate of 100% among the other regions. Therefore, the Casino Gamingin US market in North America is expected to garner significant business opportunities for the vendors during the forecast period.

              US

              • Growth in spending capability of customersThe rise in the number of double-income households indicates the high per capita disposable income in the US. This has increased the affordability of high-end products and the spending capability of customers in developed countries. Moreover is the driving factor this market.
              • the number of working women worldwide has increased considerably. In 2022 is the driving factor this market.
              • more than 57% of the women in the US were working is the driving factor this market.
              • and 70% of women with children below the age of 18 years participated in the labor force. This has boosted the income levels of individuals is the driving factor this market.
              • enabling them to increase their spending on leisure activities is the driving factor this market.
              • such as sports betting. It is also a status symbol for individuals of the high-income group. The demand for casino games has further increased over the past few years because of the growing variety of games. Earlier is the driving factor this market.
              • online casino games were not preferred because of low affordability is the driving factor this market.
              • limited awareness is the driving factor this market.
              • and high risks. However is the driving factor this market.
              • with the rise in income levels and increase in investments by vendors in the security of online platforms is the driving factor this market.
              • the casino gaming market in US is expected to have significant growth during the forecast period. is the driving factor this market.

              The Casino Gamingin US market vendors should focus on grabbing business opportunities from the Commercial segment as it accounted for the largest market share in the base year.