
Casino Gaming Equipment Market Analysis, Size, and Forecast 2026-2030: North America (US, Canada, and Mexico), APAC (China, Japan, and Australia), Europe (UK, Germany, and Italy), South America (Brazil, Argentina, and Chile), Middle East and Africa (South Africa, UAE, and Saudi Arabia), and Rest of World (ROW)

Casino Gaming Equipment Market Analysis, Size, and Forecast 2026-2030:
North America (US, Canada, and Mexico), APAC (China, Japan, and Australia), Europe (UK, Germany, and Italy), South America (Brazil, Argentina, and Chile), Middle East and Africa (South Africa, UAE, and Saudi Arabia), and Rest of World (ROW)

Published: Oct 2026 298 Pages SKU: IRTNTR41344

Market Overview at a Glance

$14.96 B
Market Opportunity
5.1%
CAGR 2025 - 2030
34.7%
APAC Growth
$29.15 B
Casinos segment 2024

Casino Gaming Equipment Market Size 2026-2030

The casino gaming equipment market size is valued to increase by USD 14.96 billion, at a CAGR of 5.1% from 2025 to 2030. Rapid technological modernization and adoption of cashless and connected gaming cabinets will drive the casino gaming equipment market.

Major Market Trends & Insights

  • APAC dominated the market and accounted for a 34.7% growth during the forecast period.
  • By End-user - Casinos segment was valued at USD 29.15 billion in 2024
  • By Type - Casino tables segment accounted for the largest market revenue share in 2024

Market Size & Forecast

  • Market Opportunities: USD 25.16 billion
  • Market Future Opportunities: USD 14.96 billion
  • CAGR from 2025 to 2030 : 5.1%

Market Summary

  • The Casino Gaming Equipment landscape is fundamentally transitioning from isolated electromechanical devices to highly interconnected digital ecosystems. This modernization maximizes floor yield while elevating interactive consumer engagement. In a real-world operational scenario, large-scale integrated resorts are replacing legacy coin-drop configurations with advanced smart cabinets featuring cashless digital wallets and near-field communication readers.
  • This transition reduces physical cage-processing times and cuts machine downtime related to currency jams by approximately 22%, significantly enhancing the overall velocity of play. A primary driver of this transition is the aggressive expansion of mega-resorts in newly regulated jurisdictions, requiring thousands of advanced electronic gaming machines to satisfy affluent tourist demand and secure baseline profitability.
  • Conversely, the rapid digitization of the casino floor introduces a critical structural challenge regarding cybersecurity vulnerabilities. The integration of proprietary software algorithms and server-to-screen communication protocols expands the digital attack surface, exposing operators to ransomware threats that can instantly halt network operations.
  • Consequently, equipment suppliers face escalating compliance expenditures to integrate robust hardware security modules and point-to-point encryption, balancing the push for digital frictionless transactions against the strict mandates of regulatory oversight.

What will be the Size of the Casino Gaming Equipment Market during the forecast period?
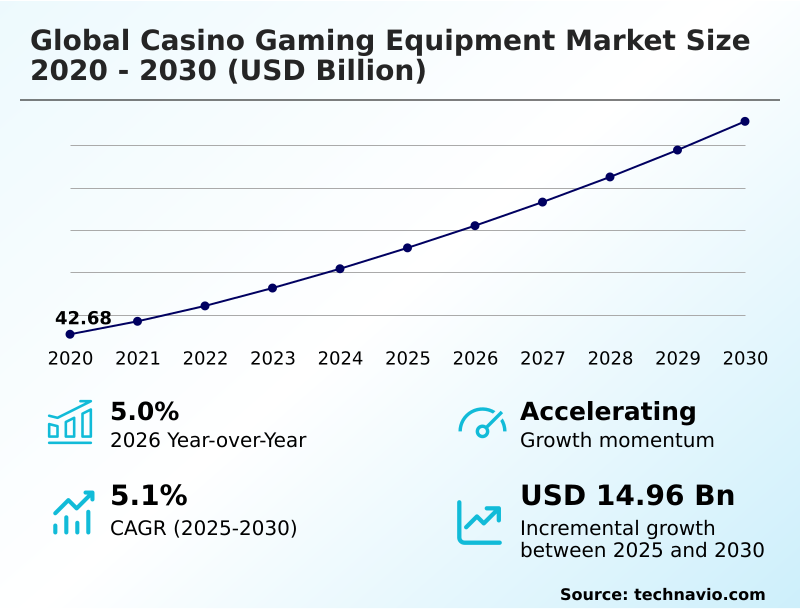
Get Key Insights on Market Forecast (PDF) Get Free Sample

How is the Casino Gaming Equipment Market Segmented?

The casino gaming equipment industry research report provides comprehensive data (region-wise segment analysis), with forecasts and estimates in "USD million" for the period 2026-2030, as well as historical data from 2020-2024 for the following segments.

  • End-user
    • Casinos
    • Malls
    • Others
  • Type
    • Casino tables
    • Slot machines
    • Gaming chips
    • Video poker machines
    • Others
  • Product type
    • Floor mounted
    • Portable
  • Geography
    • North America
      • US
      • Canada
      • Mexico
    • APAC
      • China
      • Japan
      • Australia
      • South Korea
      • Singapore
      • India
    • Europe
      • UK
      • Germany
      • Italy
      • France
      • Spain
      • Austria
    • South America
      • Brazil
      • Argentina
      • Chile
    • Middle East and Africa
      • South Africa
      • UAE
      • Saudi Arabia
      • Morocco
      • Egypt

By End-user Insights

The casinos segment is estimated to witness significant growth during the forecast period.

The integration of sophisticated hardware within dedicated casino environments continuously reshapes floor operations and revenue optimization. Large-scale installations of slot units and video lottery terminals require complex random number generation algorithms to guarantee operational integrity.

To streamline financial logistics, operators are heavily deploying automated currency handling devices and electronic wallet integrations, reducing manual cage-processing bottlenecks by over 25%.

Furthermore, the implementation of radio-frequency identification technology within physical chips, combined with table-based optical sensors, delivers unprecedented accuracy in capturing player transactional velocity.

The reliance on centralized casino management systems coupled with a tamper-proof random number generator ensures strict adherence to jurisdictional mandates.

Consequently, advanced automated payout mechanisms minimize terminal downtime, boosting the daily utilization rate of physical gaming assets and driving substantial operational yield improvements across the property.
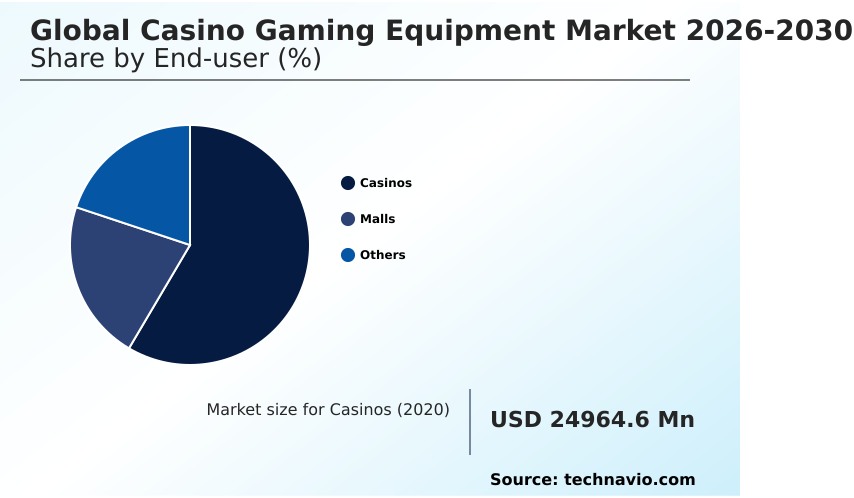
Get Free Sample

The Casinos segment was valued at USD 29.15 billion in 2024 and showed a gradual increase during the forecast period.
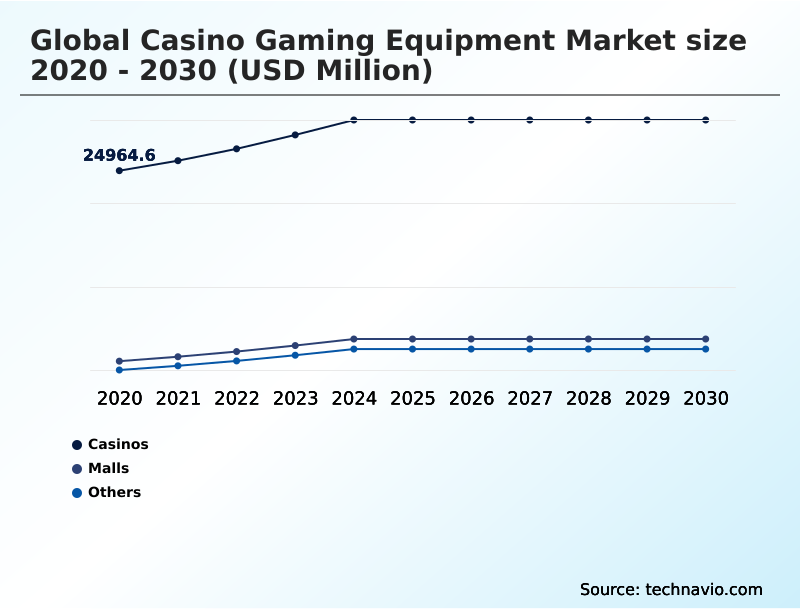
Get Free Sample

Regional Analysis

APAC is estimated to contribute 34.7% to the growth of the global market during the forecast period.Technavio’s analysts have elaborately explained the regional trends and drivers that shape the market during the forecast period.
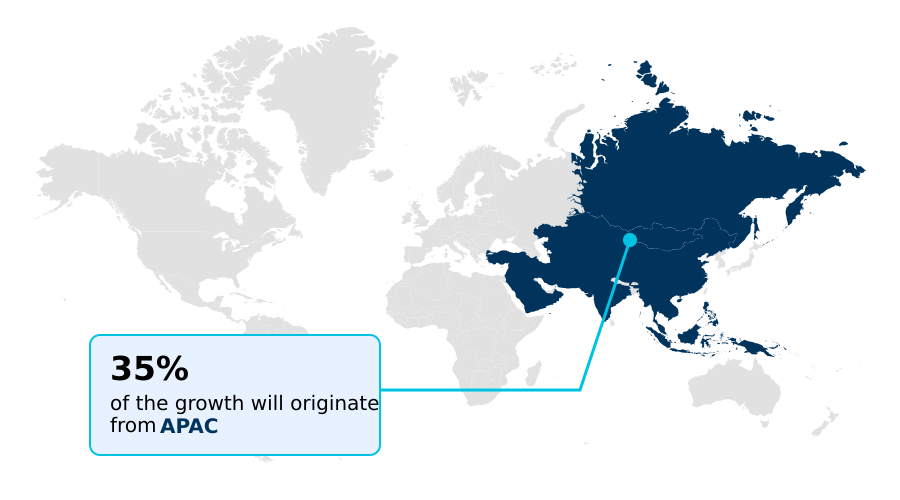
See How Casino Gaming Equipment Market Demand is Rising in APAC Get Free Sample

The geographic adoption of Casino Gaming Equipment varies significantly as international resort hubs prioritize distinct infrastructure layouts.

In APAC, the rapid expansion of integrated resorts has accelerated the deployment of hybrid electronic table games and multi-station gaming tables, mitigating regional dealer shortages while improving hands-played volume by 40% compared to traditional North American setups.

Conversely, North America heavily favors continuous upgrades to slot networks utilizing multi-denomination billing configurations and automated card shufflers to maximize individual unit yields.

The demand for contactless biometric authentication and secure biometric verification is rising universally, though adoption rates in Europe track roughly 15% higher due to strict regulatory compliance frameworks.

Consequently, operators are synchronizing their regional hardware with centralized property management databases to ensure cohesive cross-border data tracking and streamline localized operational audits.

Market Dynamics

Our researchers analyzed the data with 2025 as the base year, along with the key drivers, trends, and challenges. A holistic analysis of drivers will help companies refine their marketing strategies to gain a competitive advantage.

  • The ongoing modernization of the Casino Gaming Equipment environment demands continuous adaptation to consumer preferences and stringent regulatory compliance. Operators are actively transforming their primary floor spaces through the hybrid electronic table games layout, seamlessly blending live-dealer authenticity with the high-margin efficiency of automated digital terminals.
  • This architectural shift democratizes access for new demographics while accelerating gameplay volume by over 300%. Simultaneously, the smart connected gaming cabinets deployment enables real-time data tracking, integrating frictionless digital wallets directly at the machine level. To ensure robust anti-money laundering compliance, venues are prioritizing contactless biometric authentication system integration, cutting down manual identity verification times by roughly 40%.
  • The foundation of reliable cage management rests on secure ticket-in ticket-out validation hardware, effectively minimizing cash-handling delays and operational vulnerabilities. To further captivate passing foot traffic and prolong session duration, the widespread high-definition curved displays implementation immerses players in cinematic, haptic-enhanced narratives.
  • Together, these technological integrations allow hospitality conglomerates to optimize overall floor space yield, reduce long-term labor dependencies, and defend their physical assets against the expanding allure of mobile and digital wagering platforms.
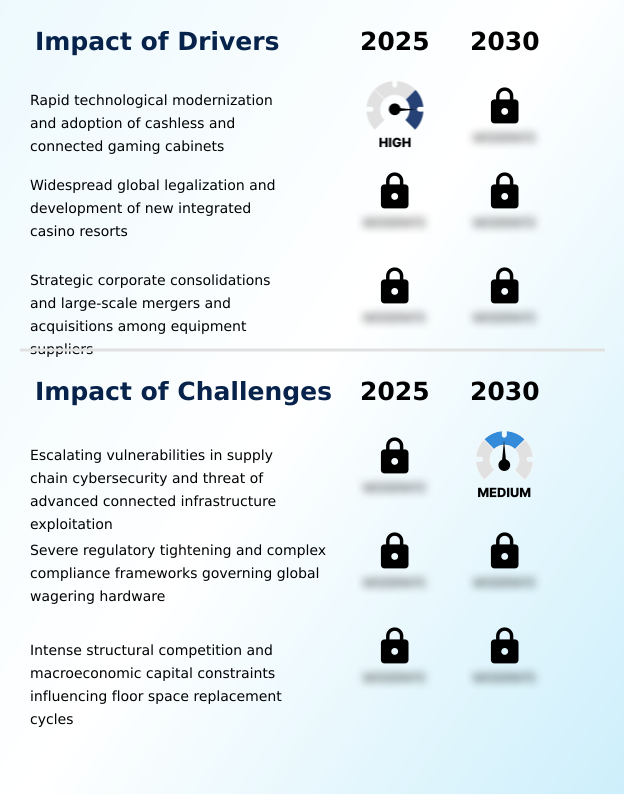
What are the key market drivers leading to the rise in the adoption of Casino Gaming Equipment Industry?

  • Rapid technological modernization and the widespread adoption of cashless, connected gaming cabinets serve as the primary drivers propelling operational expansion across the industry.

  • The rapid integration of connected hardware within the Casino Gaming Equipment ecosystem is accelerating to maximize average daily theoretical wins.
  • Operators are deploying high-definition curved displays and haptic feedback configurations within modular multi-game platforms, which elevates user interaction and effectively consolidates floor space. This hardware modernization directly increases overall floor yield by over 18% compared to isolated legacy machines.
  • Centralized casino management systems now leverage interconnected tracking systems and biometric player-tracking sensors to capture granular data. This allows facilities to build omnichannel loyalty systems and generate real-time auditing trails.
  • Consequently, the application of advanced predictive analytics empowers operators to optimize game volatility proactively. Automated utility hardware further streamlines operational bottlenecks, reducing manual oversight tasks and enhancing transactional throughput, securing substantial long-term operational cost reductions.

What are the market trends shaping the Casino Gaming Equipment Industry?

  • The accelerated adoption of cashless and contactless systems is rapidly digitizing terrestrial gaming equipment floors. This continuous technological integration stands as a primary trend optimizing operational efficiency across modern venues.

  • The Casino Gaming Equipment landscape is fundamentally shifting toward frictionless digital transactions, driven by the need to optimize floor efficiency and consumer engagement. Operators are increasingly integrating near-field communication readers and digital funding mechanisms directly into electronic gaming machines. This transition allows for customized cashless promotional incentives while reducing physical hardware downtime by nearly 20%.
  • Furthermore, the adoption of modular hardware architectures and over-the-air firmware updates ensures seamless software enhancements. The deployment of stadium-style layouts equipped with dynamic lighting setups transforms traditional spaces into immersive environments, increasing player retention rates by an estimated 15%.
  • By utilizing machine-learning software integration, facilities can dynamically predict user preferences, establishing a highly responsive environment that significantly outpaces legacy electromechanical configurations. Such innovations provide a continuous evolution in asset utilization.

What challenges does the Casino Gaming Equipment Industry face during its growth?

  • Escalating vulnerabilities within supply chain cybersecurity and the pervasive threat of advanced connected infrastructure exploitation present significant challenges to structural industry stability.

  • Escalating vulnerabilities within interconnected smart cabinets pose severe structural limitations across the Casino Gaming Equipment sector. As facilities adopt server-to-screen communication protocols, the digital attack surface expands, leaving complex proprietary software algorithms susceptible to sophisticated exploitation. A single compromised terminal can halt operations, decreasing daily operational uptime by up to 12% if widespread network isolation becomes necessary.
  • Consequently, suppliers are compelled to engineer robust anti-tamper designs alongside hardware security modules. The mandatory integration of point-to-point encryption and advanced point-to-point encryption mechanisms elevates manufacturing expenditures. While ticket-in ticket-out validation systems streamline financial flows, they demand intensive real-time behavioral monitoring to prevent fraudulent activities.
  • Navigating these compounding regulatory mandates and software remediation efforts compresses profit margins, forcing operators to absorb higher capital costs for sustained defensive network infrastructure.

Exclusive Technavio Analysis on Customer Landscape

The casino gaming equipment market forecasting report includes the adoption lifecycle of the market, covering from the innovator’s stage to the laggard’s stage. It focuses on adoption rates in different regions based on penetration. Furthermore, the casino gaming equipment market report also includes key purchase criteria and drivers of price sensitivity to help companies evaluate and develop their market growth analysis strategies.
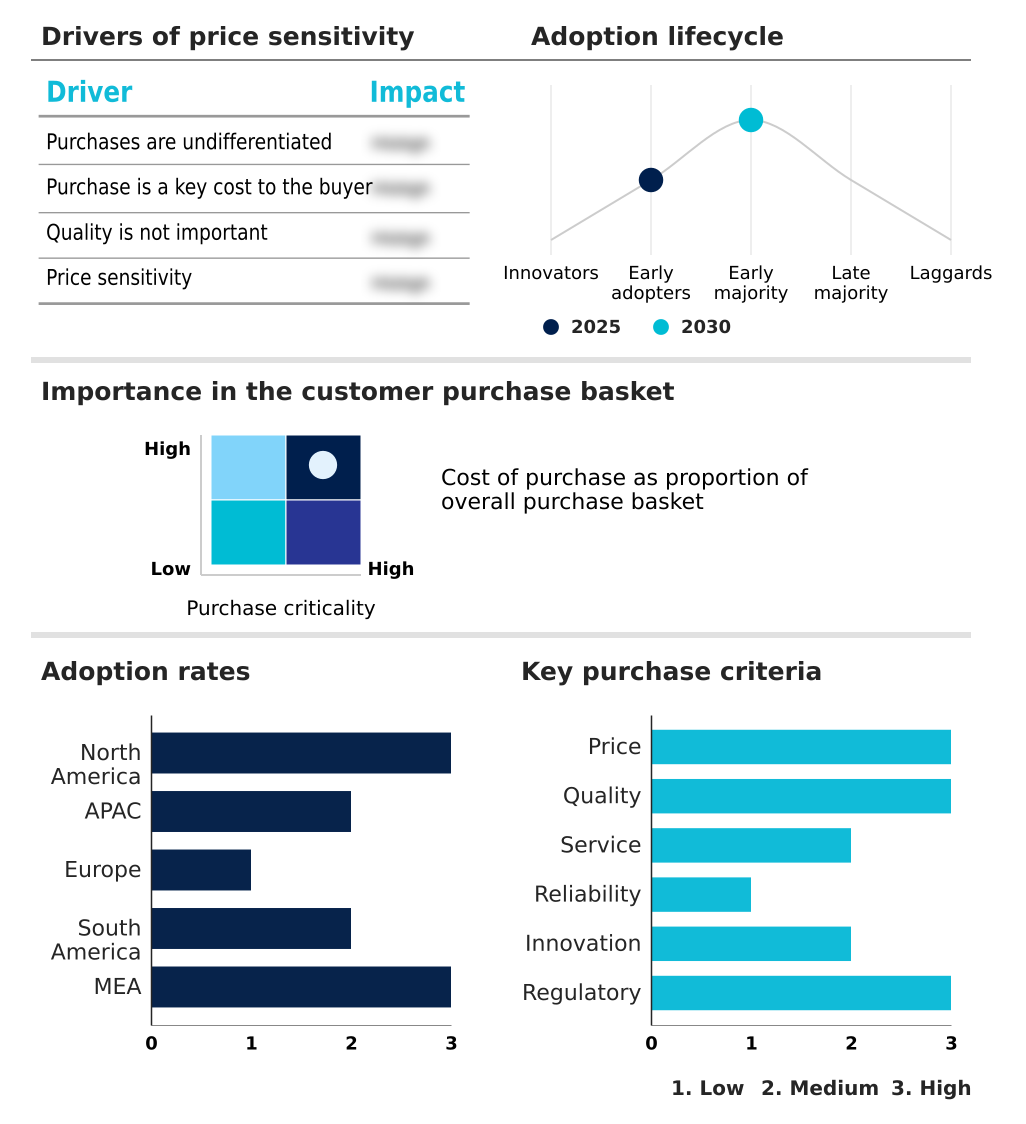
Customer Landscape of Casino Gaming Equipment Industry

Competitive Landscape

Companies are implementing various strategies, such as strategic alliances, casino gaming equipment market forecast, partnerships, mergers and acquisitions, geographical expansion, and product/service launches, to enhance their presence in the industry.

Abbiati Casino Equipment S.r.l. - The provider engineers premium casino gaming equipment, supplying sophisticated gaming tables, high-security chips, plaques, and durable accessories designed to elevate operational efficiency and structural floor aesthetics globally.

The industry research and growth report includes detailed analyses of the competitive landscape of the market and information about key companies, including:

  • Abbiati Casino Equipment S.r.l.
  • Ainsworth Game Technology Ltd.
  • APEX pro gaming s.r.o
  • Aristocrat Leisure Ltd.
  • CT Gaming
  • Gaming Arts LLC
  • Incredible Technologies Inc.
  • Interblock Gaming
  • International Game Technology
  • Konami Gaming, Inc.
  • Light and Wonder Inc.
  • NOVOMATIC AG
  • PlayAGS Inc.
  • SEGA SAMMY CREATION INC.
  • SUZOHAPP
  • Table Trac Inc.
  • TCSJOHNHUXLEY
  • Zitro Games S.L.

Qualitative and quantitative analysis of companies has been conducted to help clients understand the wider business environment as well as the strengths and weaknesses of key industry players. Data is qualitatively analyzed to categorize companies as pure play, category-focused, industry-focused, and diversified; it is quantitatively analyzed to categorize companies as dominant, leading, strong, tentative, and weak.

Recent Development and News in Casino gaming equipment market

  • In the Casinos and Gaming industry, the widespread transition toward fully digitized, cashless transaction ecosystems on gaming floors has minimized manual currency handling, directly impacting Casino Gaming Equipment demand by accelerating the replacement of legacy coin-drop machines with advanced electronic wallet integrations.
  • Strict regulatory tightening regarding anti-money laundering and responsible gaming protocols has mandated advanced behavioral tracking capabilities, compelling operators to procure smart connected gaming cabinets equipped with real-time biometric verification and continuous auditing software.
  • The acute shortage of trained table game dealers and escalating labor costs have driven operators to optimize floor space yield, increasing the procurement of hybrid electronic table games that allow a single operator to manage multiple automated terminals concurrently.
  • The convergence of high-fidelity multimedia entertainment and licensed television franchises has transformed traditional mechanical setups, driving the acquisition of premium leased participation games featuring high-definition curved displays and dynamic haptic feedback configurations.

Dive into Technavio’s robust research methodology, blending expert interviews, extensive data synthesis, and validated models for unparalleled Casino Gaming Equipment Market insights. See full methodology.

Market Scope
Page number 298
Base year 2025
Historic period 2020-2024
Forecast period 2026-2030
Growth momentum & CAGR Accelerate at a CAGR of 5.1%
Market growth 2026-2030 USD 14955.2 million
Market structure Fragmented
YoY growth 2025-2026(%) 5.0%
Key countries US, Canada, Mexico, China, Japan, Australia, South Korea, Singapore, India, UK, Germany, Italy, France, Spain, Austria, Brazil, Argentina, Chile, South Africa, UAE, Saudi Arabia, Morocco and Egypt
Competitive landscape Leading Companies, Market Positioning of Companies, Competitive Strategies, and Industry Risks

Request Free Sample

Research Analyst Overview

  • The Casino Gaming Equipment sector is undergoing a profound structural evolution as traditional wagering terminals are systematically replaced by hyper-connected, multi-sensory digital platforms. Boardrooms across major hospitality conglomerates are aggressively prioritizing the integration of cashless payment modules and hybrid electronic table games to balance escalating labor costs with the necessity of maximizing floor yield per square meter.
  • This strategic product shift directly addresses the compliance and operational complexities associated with manual cash handling, ultimately lowering cage management overhead and physical security expenses by an estimated 20%. The implementation of advanced predictive analytics and biometric player-tracking sensors allows operators to fine-tune game volatility and dynamically adjust loyalty rewards, keeping physical venues highly competitive against expanding mobile alternatives.
  • Furthermore, equipment manufacturers are heavily investing in high-definition curved displays and modular multi-game platforms that consolidate floor space while accommodating diverse player demographics. This continuous lifecycle of technological integration ensures that properties maintain rigid anti-money laundering standards through instantaneous auditing capabilities while simultaneously delivering the frictionless, entertainment-driven experiences demanded by modern consumers.

What are the Key Data Covered in this Casino Gaming Equipment Market Research and Growth Report?

  • What is the expected growth of the Casino Gaming Equipment Market between 2026 and 2030?

    • USD 14.96 billion, at a CAGR of 5.1%

  • What segmentation does the market report cover?

    • The report is segmented by End-user (Casinos, Malls, and Others), Type (Casino tables, Slot machines, Gaming chips, Video poker machines, and Others), Product Type (Floor mounted, and Portable) and Geography (North America, APAC, Europe, South America, Middle East and Africa)

  • Which regions are analyzed in the report?

    • North America, APAC, Europe, South America and Middle East and Africa

  • What are the key growth drivers and market challenges?

    • Rapid technological modernization and adoption of cashless and connected gaming cabinets, Escalating vulnerabilities in supply chain cybersecurity and threat of advanced connected infrastructure exploitation

  • Who are the major players in the Casino Gaming Equipment Market?

    • Abbiati Casino Equipment S.r.l., Ainsworth Game Technology Ltd., APEX pro gaming s.r.o, Aristocrat Leisure Ltd., CT Gaming, Gaming Arts LLC, Incredible Technologies Inc., Interblock Gaming, International Game Technology, Konami Gaming, Inc., Light and Wonder Inc., NOVOMATIC AG, PlayAGS Inc., SEGA SAMMY CREATION INC., SUZOHAPP, Table Trac Inc., TCSJOHNHUXLEY and Zitro Games S.L.

Market Research Insights

  • The Casino Gaming Equipment ecosystem is experiencing rapid structural adjustments driven by the demand for frictionless digital transactions and enhanced administrative control. Operators actively deploy centralized casino management systems to aggregate real-time auditing trails, which improves anti-money laundering compliance accuracy by over 30%.
  • Furthermore, integrating secure biometric verification within modular hardware architectures decreases unauthorized access incidents by roughly 18%, securing physical assets and player data. This push for modernization forces suppliers to deliver over-the-air firmware updates to maintain regulatory compliance seamlessly.
  • Consequently, these smart integrations reduce physical labor overhead and streamline operations, allowing venues to maximize the financial yield of their continuous capital expenditure cycles.

We can help! Our analysts can customize this casino gaming equipment market research report to meet your requirements.

Get in touch

1. Executive Summary

1.1 Market overview

Executive Summary - Chart on Market Overview
Executive Summary - Data Table on Market Overview
Executive Summary - Chart on Global Market Characteristics
Executive Summary - Chart on Market by Geography
Executive Summary - Chart on Market Segmentation by End-user
Executive Summary - Chart on Market Segmentation by Type
Executive Summary - Chart on Market Segmentation by Product Type
Executive Summary - Chart on Incremental Growth
Executive Summary - Data Table on Incremental Growth
Executive Summary - Chart on Company Market Positioning

2. Technavio Analysis

2.1 Analysis of price sensitivity, lifecycle, customer purchase basket, adoption rates, and purchase criteria

2.2 Criticality of inputs and Factors of differentiation

Chart on Overview on criticality of inputs and factors of differentiation

2.3 Factors of disruption

Chart on Overview on factors of disruption

2.4 Impact of drivers and challenges

Chart on Impact of drivers and challenges in 2025 and 2030

3. Market Landscape

3.1 Market ecosystem

Chart on Parent Market
Data Table on - Parent Market

3.2 Market characteristics

Chart on Market characteristics analysis

3.3 Value chain analysis

Chart on Value chain analysis

4. Market Sizing

4.1 Market definition

Data Table on Offerings of companies included in the market definition

4.2 Market segment analysis

Market segments

4.3 Market size 2025

4.4 Market outlook: Forecast for 2025-2030

Chart on Global - Market size and forecast 2025-2030 ($ million)
Data Table on Global - Market size and forecast 2025-2030 ($ million)
Chart on Global Market: Year-over-year growth 2025-2030 (%)
Data Table on Global Market: Year-over-year growth 2025-2030 (%)

5. Historic Market Size

5.1 Global Casino Gaming Equipment Market 2020 - 2024

Historic Market Size - Data Table on Global Casino Gaming Equipment Market 2020 - 2024 ($ million)

5.2 End-user segment analysis 2020 - 2024

Historic Market Size - End-user Segment 2020 - 2024 ($ million)

5.3 Type segment analysis 2020 - 2024

Historic Market Size - Type Segment 2020 - 2024 ($ million)

5.4 Product Type segment analysis 2020 - 2024

Historic Market Size - Product Type Segment 2020 - 2024 ($ million)

5.5 Geography segment analysis 2020 - 2024

Historic Market Size - Geography Segment 2020 - 2024 ($ million)

5.6 Country segment analysis 2020 - 2024

Historic Market Size - Country Segment 2020 - 2024 ($ million)

6. Qualitative Analysis

6.1 Impact of AI on global casino gaming equipment market

6.2 Impact of geopolitical conflicts on global casino gaming equipment market

7. Five Forces Analysis

7.1 Five forces summary

Five forces analysis - Comparison between 2025 and 2030

7.2 Bargaining power of buyers

Bargaining power of buyers - Impact of key factors 2025 and 2030

7.3 Bargaining power of suppliers

Bargaining power of suppliers - Impact of key factors in 2025 and 2030

7.4 Threat of new entrants

Threat of new entrants - Impact of key factors in 2025 and 2030

7.5 Threat of substitutes

Threat of substitutes - Impact of key factors in 2025 and 2030

7.6 Threat of rivalry

Threat of rivalry - Impact of key factors in 2025 and 2030

7.7 Market condition

Chart on Market condition - Five forces 2025 and 2030

8. Market Segmentation by End-user

8.1 Market segments

Chart on End-user - Market share 2025-2030 (%)
Data Table on End-user - Market share 2025-2030 (%)

8.2 Comparison by End-user

Chart on Comparison by End-user
Data Table on Comparison by End-user

8.3 Casinos - Market size and forecast 2025-2030

Chart on Casinos - Market size and forecast 2025-2030 ($ million)
Data Table on Casinos - Market size and forecast 2025-2030 ($ million)
Chart on Casinos - Year-over-year growth 2025-2030 (%)
Data Table on Casinos - Year-over-year growth 2025-2030 (%)

8.4 Malls - Market size and forecast 2025-2030

Chart on Malls - Market size and forecast 2025-2030 ($ million)
Data Table on Malls - Market size and forecast 2025-2030 ($ million)
Chart on Malls - Year-over-year growth 2025-2030 (%)
Data Table on Malls - Year-over-year growth 2025-2030 (%)

8.5 Others - Market size and forecast 2025-2030

Chart on Others - Market size and forecast 2025-2030 ($ million)
Data Table on Others - Market size and forecast 2025-2030 ($ million)
Chart on Others - Year-over-year growth 2025-2030 (%)
Data Table on Others - Year-over-year growth 2025-2030 (%)

8.6 Market opportunity by End-user

Market opportunity by End-user ($ million)
Data Table on Market opportunity by End-user ($ million)

9. Market Segmentation by Type

9.1 Market segments

Chart on Type - Market share 2025-2030 (%)
Data Table on Type - Market share 2025-2030 (%)

9.2 Comparison by Type

Chart on Comparison by Type
Data Table on Comparison by Type

9.3 Casino tables - Market size and forecast 2025-2030

Chart on Casino tables - Market size and forecast 2025-2030 ($ million)
Data Table on Casino tables - Market size and forecast 2025-2030 ($ million)
Chart on Casino tables - Year-over-year growth 2025-2030 (%)
Data Table on Casino tables - Year-over-year growth 2025-2030 (%)

9.4 Slot machines - Market size and forecast 2025-2030

Chart on Slot machines - Market size and forecast 2025-2030 ($ million)
Data Table on Slot machines - Market size and forecast 2025-2030 ($ million)
Chart on Slot machines - Year-over-year growth 2025-2030 (%)
Data Table on Slot machines - Year-over-year growth 2025-2030 (%)

9.5 Gaming chips - Market size and forecast 2025-2030

Chart on Gaming chips - Market size and forecast 2025-2030 ($ million)
Data Table on Gaming chips - Market size and forecast 2025-2030 ($ million)
Chart on Gaming chips - Year-over-year growth 2025-2030 (%)
Data Table on Gaming chips - Year-over-year growth 2025-2030 (%)

9.6 Video poker machines - Market size and forecast 2025-2030

Chart on Video poker machines - Market size and forecast 2025-2030 ($ million)
Data Table on Video poker machines - Market size and forecast 2025-2030 ($ million)
Chart on Video poker machines - Year-over-year growth 2025-2030 (%)
Data Table on Video poker machines - Year-over-year growth 2025-2030 (%)

9.7 Others - Market size and forecast 2025-2030

Chart on Others - Market size and forecast 2025-2030 ($ million)
Data Table on Others - Market size and forecast 2025-2030 ($ million)
Chart on Others - Year-over-year growth 2025-2030 (%)
Data Table on Others - Year-over-year growth 2025-2030 (%)

9.8 Market opportunity by Type

Market opportunity by Type ($ million)
Data Table on Market opportunity by Type ($ million)

10. Market Segmentation by Product Type

10.1 Market segments

Chart on Product Type - Market share 2025-2030 (%)
Data Table on Product Type - Market share 2025-2030 (%)

10.2 Comparison by Product Type

Chart on Comparison by Product Type
Data Table on Comparison by Product Type

10.3 Floor mounted - Market size and forecast 2025-2030

Chart on Floor mounted - Market size and forecast 2025-2030 ($ million)
Data Table on Floor mounted - Market size and forecast 2025-2030 ($ million)
Chart on Floor mounted - Year-over-year growth 2025-2030 (%)
Data Table on Floor mounted - Year-over-year growth 2025-2030 (%)

10.4 Portable - Market size and forecast 2025-2030

Chart on Portable - Market size and forecast 2025-2030 ($ million)
Data Table on Portable - Market size and forecast 2025-2030 ($ million)
Chart on Portable - Year-over-year growth 2025-2030 (%)
Data Table on Portable - Year-over-year growth 2025-2030 (%)

10.5 Market opportunity by Product Type

Market opportunity by Product Type ($ million)
Data Table on Market opportunity by Product Type ($ million)

11. Customer Landscape

11.1 Customer landscape overview

Analysis of price sensitivity, lifecycle, customer purchase basket, adoption rates, and purchase criteria

12. Geographic Landscape

12.1 Geographic segmentation

Chart on Market share by geography 2025-2030 (%)
Data Table on Market share by geography 2025-2030 (%)

12.2 Geographic comparison

Chart on Geographic comparison
Data Table on Geographic comparison

12.3 North America - Market size and forecast 2025-2030

Chart on North America - Market size and forecast 2025-2030 ($ million)
Data Table on North America - Market size and forecast 2025-2030 ($ million)
Chart on North America - Year-over-year growth 2025-2030 (%)
Data Table on North America - Year-over-year growth 2025-2030 (%)
Chart on Regional Comparison - North America
Data Table on Regional Comparison - North America

12.3.1 US - Market size and forecast 2025-2030

Chart on US - Market size and forecast 2025-2030 ($ million)
Data Table on US - Market size and forecast 2025-2030 ($ million)
Chart on US - Year-over-year growth 2025-2030 (%)
Data Table on US - Year-over-year growth 2025-2030 (%)

12.3.2 Canada - Market size and forecast 2025-2030

Chart on Canada - Market size and forecast 2025-2030 ($ million)
Data Table on Canada - Market size and forecast 2025-2030 ($ million)
Chart on Canada - Year-over-year growth 2025-2030 (%)
Data Table on Canada - Year-over-year growth 2025-2030 (%)

12.3.3 Mexico - Market size and forecast 2025-2030

Chart on Mexico - Market size and forecast 2025-2030 ($ million)
Data Table on Mexico - Market size and forecast 2025-2030 ($ million)
Chart on Mexico - Year-over-year growth 2025-2030 (%)
Data Table on Mexico - Year-over-year growth 2025-2030 (%)

12.4 APAC - Market size and forecast 2025-2030

Chart on APAC - Market size and forecast 2025-2030 ($ million)
Data Table on APAC - Market size and forecast 2025-2030 ($ million)
Chart on APAC - Year-over-year growth 2025-2030 (%)
Data Table on APAC - Year-over-year growth 2025-2030 (%)
Chart on Regional Comparison - APAC
Data Table on Regional Comparison - APAC

12.4.1 China - Market size and forecast 2025-2030

Chart on China - Market size and forecast 2025-2030 ($ million)
Data Table on China - Market size and forecast 2025-2030 ($ million)
Chart on China - Year-over-year growth 2025-2030 (%)
Data Table on China - Year-over-year growth 2025-2030 (%)

12.4.2 Japan - Market size and forecast 2025-2030

Chart on Japan - Market size and forecast 2025-2030 ($ million)
Data Table on Japan - Market size and forecast 2025-2030 ($ million)
Chart on Japan - Year-over-year growth 2025-2030 (%)
Data Table on Japan - Year-over-year growth 2025-2030 (%)

12.4.3 Australia - Market size and forecast 2025-2030

Chart on Australia - Market size and forecast 2025-2030 ($ million)
Data Table on Australia - Market size and forecast 2025-2030 ($ million)
Chart on Australia - Year-over-year growth 2025-2030 (%)
Data Table on Australia - Year-over-year growth 2025-2030 (%)

12.4.4 South Korea - Market size and forecast 2025-2030

Chart on South Korea - Market size and forecast 2025-2030 ($ million)
Data Table on South Korea - Market size and forecast 2025-2030 ($ million)
Chart on South Korea - Year-over-year growth 2025-2030 (%)
Data Table on South Korea - Year-over-year growth 2025-2030 (%)

12.4.5 Singapore - Market size and forecast 2025-2030

Chart on Singapore - Market size and forecast 2025-2030 ($ million)
Data Table on Singapore - Market size and forecast 2025-2030 ($ million)
Chart on Singapore - Year-over-year growth 2025-2030 (%)
Data Table on Singapore - Year-over-year growth 2025-2030 (%)

12.4.6 India - Market size and forecast 2025-2030

Chart on India - Market size and forecast 2025-2030 ($ million)
Data Table on India - Market size and forecast 2025-2030 ($ million)
Chart on India - Year-over-year growth 2025-2030 (%)
Data Table on India - Year-over-year growth 2025-2030 (%)

12.5 Europe - Market size and forecast 2025-2030

Chart on Europe - Market size and forecast 2025-2030 ($ million)
Data Table on Europe - Market size and forecast 2025-2030 ($ million)
Chart on Europe - Year-over-year growth 2025-2030 (%)
Data Table on Europe - Year-over-year growth 2025-2030 (%)
Chart on Regional Comparison - Europe
Data Table on Regional Comparison - Europe

12.5.1 UK - Market size and forecast 2025-2030

Chart on UK - Market size and forecast 2025-2030 ($ million)
Data Table on UK - Market size and forecast 2025-2030 ($ million)
Chart on UK - Year-over-year growth 2025-2030 (%)
Data Table on UK - Year-over-year growth 2025-2030 (%)

12.5.2 Germany - Market size and forecast 2025-2030

Chart on Germany - Market size and forecast 2025-2030 ($ million)
Data Table on Germany - Market size and forecast 2025-2030 ($ million)
Chart on Germany - Year-over-year growth 2025-2030 (%)
Data Table on Germany - Year-over-year growth 2025-2030 (%)

12.5.3 Italy - Market size and forecast 2025-2030

Chart on Italy - Market size and forecast 2025-2030 ($ million)
Data Table on Italy - Market size and forecast 2025-2030 ($ million)
Chart on Italy - Year-over-year growth 2025-2030 (%)
Data Table on Italy - Year-over-year growth 2025-2030 (%)

12.5.4 France - Market size and forecast 2025-2030

Chart on France - Market size and forecast 2025-2030 ($ million)
Data Table on France - Market size and forecast 2025-2030 ($ million)
Chart on France - Year-over-year growth 2025-2030 (%)
Data Table on France - Year-over-year growth 2025-2030 (%)

12.5.5 Spain - Market size and forecast 2025-2030

Chart on Spain - Market size and forecast 2025-2030 ($ million)
Data Table on Spain - Market size and forecast 2025-2030 ($ million)
Chart on Spain - Year-over-year growth 2025-2030 (%)
Data Table on Spain - Year-over-year growth 2025-2030 (%)

12.5.6 Austria - Market size and forecast 2025-2030

Chart on Austria - Market size and forecast 2025-2030 ($ million)
Data Table on Austria - Market size and forecast 2025-2030 ($ million)
Chart on Austria - Year-over-year growth 2025-2030 (%)
Data Table on Austria - Year-over-year growth 2025-2030 (%)

12.6 South America - Market size and forecast 2025-2030

Chart on South America - Market size and forecast 2025-2030 ($ million)
Data Table on South America - Market size and forecast 2025-2030 ($ million)
Chart on South America - Year-over-year growth 2025-2030 (%)
Data Table on South America - Year-over-year growth 2025-2030 (%)
Chart on Regional Comparison - South America
Data Table on Regional Comparison - South America

12.6.1 Brazil - Market size and forecast 2025-2030

Chart on Brazil - Market size and forecast 2025-2030 ($ million)
Data Table on Brazil - Market size and forecast 2025-2030 ($ million)
Chart on Brazil - Year-over-year growth 2025-2030 (%)
Data Table on Brazil - Year-over-year growth 2025-2030 (%)

12.6.2 Argentina - Market size and forecast 2025-2030

Chart on Argentina - Market size and forecast 2025-2030 ($ million)
Data Table on Argentina - Market size and forecast 2025-2030 ($ million)
Chart on Argentina - Year-over-year growth 2025-2030 (%)
Data Table on Argentina - Year-over-year growth 2025-2030 (%)

12.6.3 Chile - Market size and forecast 2025-2030

Chart on Chile - Market size and forecast 2025-2030 ($ million)
Data Table on Chile - Market size and forecast 2025-2030 ($ million)
Chart on Chile - Year-over-year growth 2025-2030 (%)
Data Table on Chile - Year-over-year growth 2025-2030 (%)

12.7 Middle East and Africa - Market size and forecast 2025-2030

Chart on Middle East and Africa - Market size and forecast 2025-2030 ($ million)
Data Table on Middle East and Africa - Market size and forecast 2025-2030 ($ million)
Chart on Middle East and Africa - Year-over-year growth 2025-2030 (%)
Data Table on Middle East and Africa - Year-over-year growth 2025-2030 (%)
Chart on Regional Comparison - Middle East and Africa
Data Table on Regional Comparison - Middle East and Africa

12.7.1 South Africa - Market size and forecast 2025-2030

Chart on South Africa - Market size and forecast 2025-2030 ($ million)
Data Table on South Africa - Market size and forecast 2025-2030 ($ million)
Chart on South Africa - Year-over-year growth 2025-2030 (%)
Data Table on South Africa - Year-over-year growth 2025-2030 (%)

12.7.2 UAE - Market size and forecast 2025-2030

Chart on UAE - Market size and forecast 2025-2030 ($ million)
Data Table on UAE - Market size and forecast 2025-2030 ($ million)
Chart on UAE - Year-over-year growth 2025-2030 (%)
Data Table on UAE - Year-over-year growth 2025-2030 (%)

12.7.3 Saudi Arabia - Market size and forecast 2025-2030

Chart on Saudi Arabia - Market size and forecast 2025-2030 ($ million)
Data Table on Saudi Arabia - Market size and forecast 2025-2030 ($ million)
Chart on Saudi Arabia - Year-over-year growth 2025-2030 (%)
Data Table on Saudi Arabia - Year-over-year growth 2025-2030 (%)

12.7.4 Morocco - Market size and forecast 2025-2030

Chart on Morocco - Market size and forecast 2025-2030 ($ million)
Data Table on Morocco - Market size and forecast 2025-2030 ($ million)
Chart on Morocco - Year-over-year growth 2025-2030 (%)
Data Table on Morocco - Year-over-year growth 2025-2030 (%)

12.7.5 Egypt - Market size and forecast 2025-2030

Chart on Egypt - Market size and forecast 2025-2030 ($ million)
Data Table on Egypt - Market size and forecast 2025-2030 ($ million)
Chart on Egypt - Year-over-year growth 2025-2030 (%)
Data Table on Egypt - Year-over-year growth 2025-2030 (%)

12.8 Market opportunity by geography

Market opportunity by geography ($ million)
Data Tables on Market opportunity by geography ($ million)

13. Drivers, Challenges, and Opportunity

13.1 Market drivers

Rapid technological modernization and adoption of cashless and connected gaming cabinets
Widespread global legalization and development of new integrated casino resorts
Strategic corporate consolidations and large-scale mergers and acquisitions among equipment suppliers

13.2 Market challenges

Escalating vulnerabilities in supply chain cybersecurity and threat of advanced connected infrastructure exploitation
Severe regulatory tightening and complex compliance frameworks governing global wagering hardware
Intense structural competition and macroeconomic capital constraints influencing floor space replacement cycles

13.3 Impact of drivers and challenges

Impact of drivers and challenges in 2025 and 2030

13.4 Market opportunities

Accelerated adoption of cashless and contactless systems to digitize terrestrial gaming equipment floors
Proliferation of electronic table games and hybrid live-dealer hybrid gaming systems
Strategic integration of high-fidelity multimedia and cross-industry entertainment intellectual property licenses

14. Competitive Landscape

14.1 Overview

14.2

Overview on criticality of inputs and factors of differentiation

14.3 Landscape disruption

Overview on factors of disruption

14.4 Industry risks

Impact of key risks on business

15. Competitive Analysis

15.1 Companies profiled

Companies covered

15.2 Company ranking index

15.3 Market positioning of companies

Matrix on companies position and classification

15.4 Abbiati Casino Equipment S.r.l.

Abbiati Casino Equipment S.r.l. - Overview
Abbiati Casino Equipment S.r.l. - Product / Service
Abbiati Casino Equipment S.r.l. - Key offerings
SWOT

15.5 Ainsworth Game Technology Ltd.

Ainsworth Game Technology Ltd. - Overview
Ainsworth Game Technology Ltd. - Business segments
Ainsworth Game Technology Ltd. - Key offerings
Ainsworth Game Technology Ltd. - Segment focus
SWOT

15.6 APEX pro gaming s.r.o

APEX pro gaming s.r.o - Overview
APEX pro gaming s.r.o - Product / Service
APEX pro gaming s.r.o - Key offerings
SWOT

15.7 Aristocrat Leisure Ltd.

Aristocrat Leisure Ltd. - Overview
Aristocrat Leisure Ltd. - Business segments
Aristocrat Leisure Ltd. - Key offerings
Aristocrat Leisure Ltd. - Segment focus
SWOT

15.8 CT Gaming

CT Gaming - Overview
CT Gaming - Product / Service
CT Gaming - Key offerings
SWOT

15.9 Gaming Arts LLC

Gaming Arts LLC - Overview
Gaming Arts LLC - Product / Service
Gaming Arts LLC - Key offerings
SWOT

15.10 Incredible Technologies Inc.

Incredible Technologies Inc. - Overview
Incredible Technologies Inc. - Product / Service
Incredible Technologies Inc. - Key offerings
SWOT

15.11 Interblock Gaming

Interblock Gaming - Overview
Interblock Gaming - Product / Service
Interblock Gaming - Key offerings
SWOT

15.12 International Game Technology

International Game Technology - Overview
International Game Technology - Product / Service
International Game Technology - Key offerings
SWOT

15.13 Konami Gaming, Inc.

Konami Gaming, Inc. - Overview
Konami Gaming, Inc. - Product / Service
Konami Gaming, Inc. - Key offerings
SWOT

15.14 Light and Wonder Inc.

Light and Wonder Inc. - Overview
Light and Wonder Inc. - Business segments
Light and Wonder Inc. - Key offerings
Light and Wonder Inc. - Segment focus
SWOT

15.15 NOVOMATIC AG

NOVOMATIC AG - Overview
NOVOMATIC AG - Product / Service
NOVOMATIC AG - Key offerings
SWOT

15.16 PlayAGS Inc.

PlayAGS Inc. - Overview
PlayAGS Inc. - Business segments
PlayAGS Inc. - Key offerings
PlayAGS Inc. - Segment focus
SWOT

15.17 SEGA SAMMY CREATION INC.

SEGA SAMMY CREATION INC. - Overview
SEGA SAMMY CREATION INC. - Product / Service
SEGA SAMMY CREATION INC. - Key offerings
SWOT

15.18 Table Trac Inc.

Table Trac Inc. - Overview
Table Trac Inc. - Product / Service
Table Trac Inc. - Key offerings
SWOT

16. Appendix

16.1 Scope of the report

Market definition
Objectives
Notes and caveats

16.2 Inclusions and exclusions checklist

Inclusions checklist
Exclusions checklist

16.3 Currency conversion rates for US$

16.4 Research methodology

16.5 Data procurement

Information sources

16.6 Data validation

16.7 Validation techniques employed for market sizing

16.8 Data synthesis

16.9 360 degree market analysis

16.10 List of abbreviations

Research Methodology

Technavio presents a detailed picture of the market by way of study, synthesis, and summation of data from multiple sources. The analysts have presented the various facets of the market with a particular focus on identifying the key industry influencers. The data thus presented is comprehensive, reliable, and the result of extensive research, both primary and secondary.

INFORMATION SOURCES

Primary sources

  • Manufacturers and suppliers
  • Channel partners
  • Industry experts
  • Strategic decision makers

Secondary sources

  • Industry journals and periodicals
  • Government data
  • Financial reports of key industry players
  • Historical data
  • Press releases

DATA ANALYSIS

Data Synthesis

  • Collation of data
  • Estimation of key figures
  • Analysis of derived insights

Data Validation

  • Triangulation with data models
  • Reference against proprietary databases
  • Corroboration with industry experts

REPORT WRITING

Qualitative

  • Market drivers
  • Market challenges
  • Market trends
  • Five forces analysis

Quantitative

  • Market size and forecast
  • Market segmentation
  • Geographical insights
  • Competitive landscape

Interested in this report?

Get your sample now to see our research methodology and insights!

Download Now

Frequently Asked Questions

Casino Gaming Equipment market growth will increase by USD 14955.2 million during 2026-2030.

The Casino Gaming Equipment market is expected to grow at a CAGR of 5.1% during 2026-2030.

Casino Gaming Equipment market is segmented by End-user (Casinos, Malls, Others) Type (Casino tables, Slot machines, Gaming chips, Video poker machines, Others) Product type (Floor mounted, Portable)

Abbiati Casino Equipment S.r.l., Ainsworth Game Technology Ltd., APEX pro gaming s.r.o, Aristocrat Leisure Ltd., CT Gaming, Gaming Arts LLC, Incredible Technologies Inc., Interblock Gaming, International Game Technology, Konami Gaming, Inc., Light and Wonder Inc., NOVOMATIC AG, PlayAGS Inc., SEGA SAMMY CREATION INC., SUZOHAPP, Table Trac Inc., TCSJOHNHUXLEY, Zitro Games S.L. are a few of the key vendors in the Casino Gaming Equipment market.

APAC will register the highest growth rate of 34.7% among the other regions. Therefore, the Casino Gaming Equipment market in APAC is expected to garner significant business opportunities for the vendors during the forecast period.

US, Canada, Mexico, China, Japan, Australia, South Korea, Singapore, India, UK, Germany, Italy, France, Spain, Austria, Brazil, Argentina, Chile, South Africa, UAE, Saudi Arabia, Morocco, Egypt

  • Rapid technological modernization and adoption of cashless and connected gaming cabinets is the driving factor this market.

The Casino Gaming Equipment market vendors should focus on grabbing business opportunities from the End-user segment as it accounted for the largest market share in the base year.
RIA - Research AI Assistant
Ask RIA
