Cell Therapy Market Analysis, Size, and Forecast 2026-2030: North America (US, Canada, and Mexico), Europe (Germany, UK, and France), APAC (China, India, and Japan), South America (Brazil, Argentina, and Colombia), Middle East and Africa (Saudi Arabia, UAE, and Turkey), Asia, Rest of World (ROW)

Cell Therapy Market Analysis, Size, and Forecast 2026-2030:
North America (US, Canada, and Mexico), Europe (Germany, UK, and France), APAC (China, India, and Japan), South America (Brazil, Argentina, and Colombia), Middle East and Africa (Saudi Arabia, UAE, and Turkey), Asia, Rest of World (ROW)

Published: Apr 2026 293 Pages SKU: IRTNTR72148

Market Overview at a Glance

$18.17 B
Market Opportunity
21.9%
CAGR 2025 - 2030
39.3%
North America Growth
$7.88 B
Autologous segment 2024

Cell Therapy Market Size 2026-2030

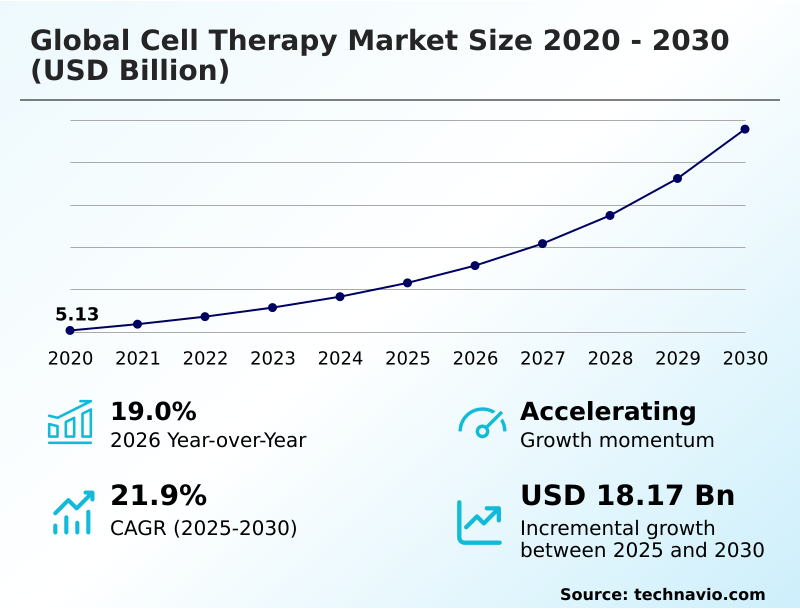
The cell therapy market size is valued to increase by USD 18.17 billion, at a CAGR of 21.9% from 2025 to 2030. Increasing prevalence of chronic and degenerative diseases will drive the cell therapy market.

Major Market Trends & Insights

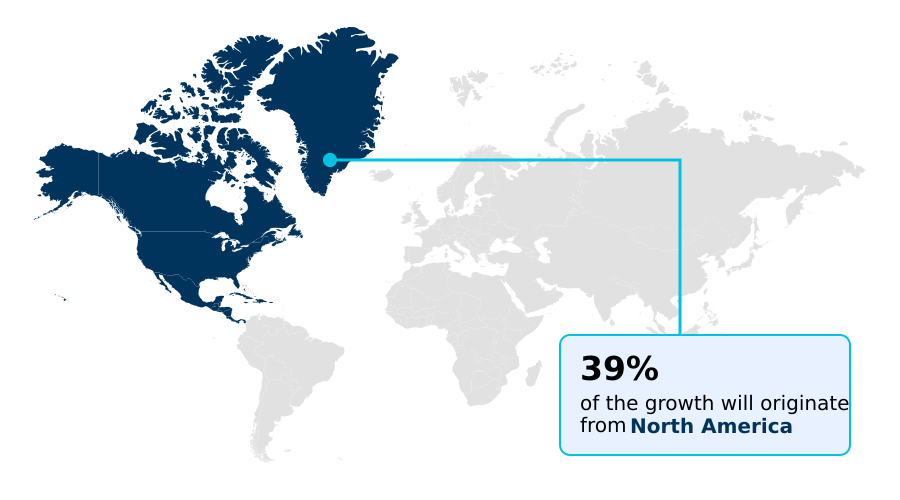
  • North America dominated the market and accounted for a 39.3% growth during the forecast period.
  • By Type - Autologous segment was valued at USD 7.88 billion in 2024
  • By Application - Malignancies segment accounted for the largest market revenue share in 2024

Market Size & Forecast

  • Market Opportunities: USD 23.79 billion
  • Market Future Opportunities: USD 18.17 billion
  • CAGR from 2025 to 2030 : 21.9%

Market Summary

  • The cell therapy market is advancing from niche applications to a pivotal role in mainstream medicine. This evolution is propelled by technological progress in cell engineering and a deeper biological understanding, which together broaden the therapeutic scope from oncology to autoimmune and neurodegenerative conditions.
  • A key trend is the industry's strategic pivot from complex autologous models to more scalable allogeneic or 'off-the-shelf' therapies, a move aimed at reducing costs and logistical burdens.
  • For instance, a biopharmaceutical firm developing a therapy for a rare genetic disorder must navigate a complex value chain; this involves managing a cryopreserved supply chain where temperature deviations of just a few degrees can compromise a batch, necessitating advanced tracking systems to ensure a 99.9% success rate in maintaining the chain of custody from manufacturing to patient infusion.
  • However, significant hurdles remain, including navigating divergent global regulatory pathways and establishing reimbursement models that can accommodate high upfront treatment costs, which are critical for ensuring patient access and sustaining innovation.

What will be the Size of the Cell Therapy Market during the forecast period?

Get Key Insights on Market Forecast (PDF) Request Free Sample

How is the Cell Therapy Market Segmented?

The cell therapy industry research report provides comprehensive data (region-wise segment analysis), with forecasts and estimates in "USD million" for the period 2026-2030, as well as historical data from 2020-2024 for the following segments.
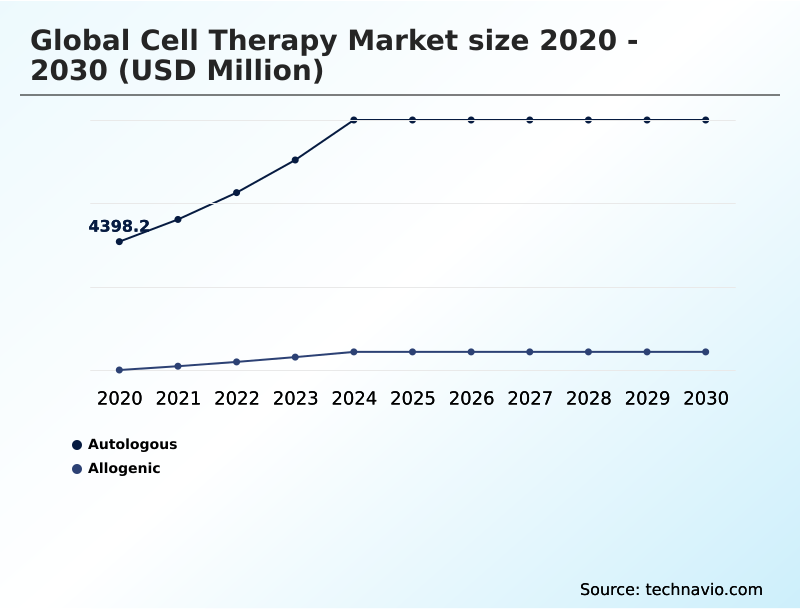
  • Type
    • Autologous
    • Allogenic
  • Application
    • Malignancies
    • Musculoskeletal
    • Cardiovascular
    • Others
  • End-user
    • Biopharmaceutical companies
    • CMOs
    • CROs
    • Academic and research institutes
  • Geography
    • North America
      • US
      • Canada
      • Mexico
    • Europe
      • Germany
      • UK
      • France
    • Asia
    • Rest of World (ROW)

By Type Insights

The autologous segment is estimated to witness significant growth during the forecast period.

The autologous segment operates on a highly personalized, one-patient-one-batch model, representing the foundational approach to cell therapy. This method involves harvesting a patient's own cells for subsequent ex vivo cell manipulation and reinfusion.

The primary advantage of autologous cell therapy is the elimination of immunological rejection, but these patient-specific treatment models present significant operational hurdles.

The vein-to-vein time can extend for weeks, and manufacturing success rates can vary by up to 15%, influenced by factors like the quality of a patient's starting biological material.

Maintaining a strict chain of identity under good manufacturing practice conditions is paramount. The process demands rigorous aseptic technique and adherence to strict release criteria, with analytical method validation ensuring product safety and consistency for each individual batch.

Request Free Sample

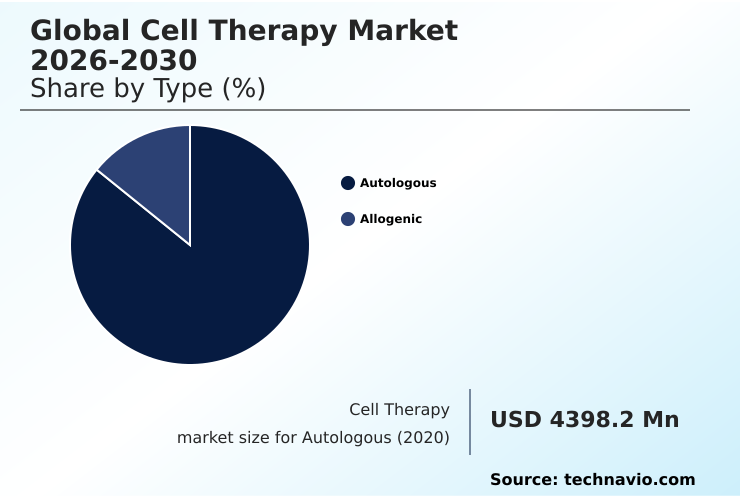
The Autologous segment was valued at USD 7.88 billion in 2024 and showed a gradual increase during the forecast period.

Request Free Sample

Regional Analysis

North America is estimated to contribute 39.3% to the growth of the global market during the forecast period.Technavio’s analysts have elaborately explained the regional trends and drivers that shape the market during the forecast period.

See How Cell Therapy Market Demand is Rising in North America Request Free Sample

The geographic landscape is dominated by North America, which accounts for 39.3% of incremental growth, driven by a high concentration of research and investment.

However, Asia is forecast to have the highest growth rate, with its market expanding due to government initiatives and a large patient population.

In this region, local firms are advancing capabilities in aseptic processing and bioreactor technology, leading to a 15% reduction in contamination events in some advanced facilities.

European markets are focusing on harmonizing health technology assessment for gene-corrected cell treatments and other advanced therapies.

Across all major regions, there is a focus on refining quality control testing and scaling cell banking operations to support both patient-specific treatment models and allogeneic approaches, with significant research into immunogenicity risk mitigation.

Market Dynamics

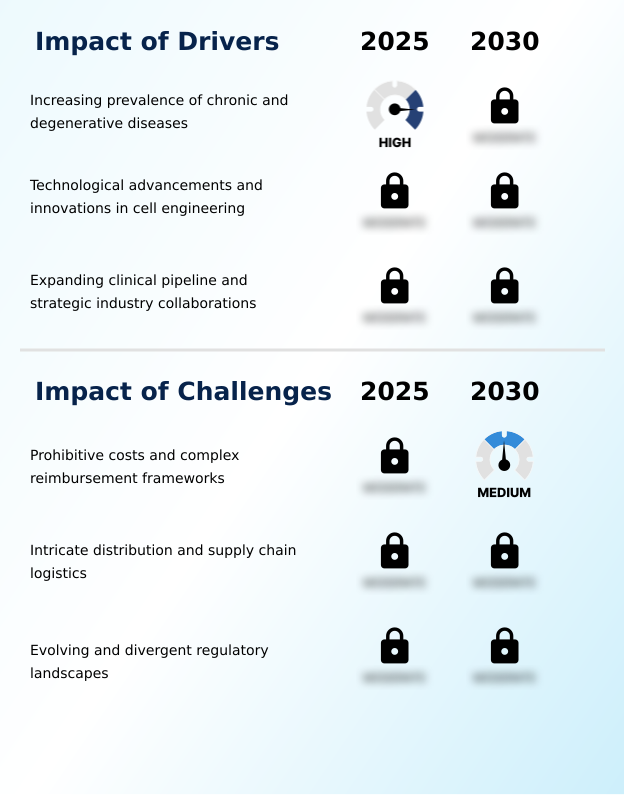
Our researchers analyzed the data with 2025 as the base year, along with the key drivers, trends, and challenges. A holistic analysis of drivers will help companies refine their marketing strategies to gain a competitive advantage.

  • The future trajectory of the global cell therapy market 2026-2030 is being shaped by several interconnected long-term developments. The key drivers for growth in the global cell therapy market 2026-2030 are clear, but realizing this potential requires overcoming significant hurdles. A critical area is the advancements in CAR-T cell engineering for solid tumors, which involves overcoming the immunosuppressive tumor microenvironment.
  • This contrasts with the more established comparison of autologous and allogeneic therapy platforms in hematology. The challenges in scaling autologous cell therapy manufacturing remain a primary concern, directly linked to the strategies for reducing vein-to-vein time in CAR-T. Consequently, the industry is closely watching the regulatory pathways for allogeneic cell therapy approval and the cost-effectiveness analysis of off-the-shelf cell therapies.
  • Firms adopting manufacturing automation report up to a 2x improvement in throughput compared to manual processes. The investment trends in the global cell therapy market 2026-2030 reflect a strong interest in gene editing techniques to create universal donor cells, which is central to addressing immunogenicity in allogeneic cell products.
  • Success hinges on developing potency assays for mesenchymal stem cells and navigating global regulatory divergence in advanced therapies. The role of CMOs and CROs in cell therapy development has become integral, especially for managing supply chain solutions for cryogenic cell therapy logistics.
  • Beyond oncology, the future of cell therapy in treating neurodegenerative disorders and emerging trends in cell therapy for cardiovascular disease represent significant long-term growth frontiers, provided that reimbursement models for high-cost cell and gene therapies can be established.

What are the key market drivers leading to the rise in the adoption of Cell Therapy Industry?

  • The increasing prevalence of chronic and degenerative diseases worldwide is a key driver fueling the growth of the cell therapy market.

  • The market's expansion is driven by advancements in gene editing and the success of therapies like chimeric antigen receptor (CAR-T) and T-cell receptor therapy.
  • These platforms have shown remarkable efficacy in hematological malignancies, with some CAR-T cell therapies for cancer achieving complete response rates over 80% in certain patient populations.
  • The focus is now expanding to include TCR therapies for solid tumors and treatments for neurodegenerative disorders. This clinical pipeline expansion is supported by sophisticated regenerative medicine platforms and improved clinical trial logistics.
  • Advanced gene editing technologies are also enabling the development of cell therapy for autoimmune diseases and strategies to mitigate risks like host versus graft disease, further broadening the therapeutic potential and attracting significant investment.

What are the market trends shaping the Cell Therapy Industry?

  • A growing emphasis on allogenic and 'off-the-shelf' therapies represents a significant upcoming trend. This shift aims to address the scalability and cost challenges of personalized treatments.

  • Key industry trends are pivoting toward allogeneic cell therapy and the development of off-the-shelf cell products to overcome logistical challenges. These cell engineering innovations focus on creating universal donor cells and hypoimmunogenic cell lines to minimize rejection.
  • A major push involves tackling solid tumors by improving solid tumor infiltration with multi-targeted constructs designed to prevent antigen escape, a common failure mode. Concurrently, manufacturing 4.0 in cell therapy is gaining traction, with firms adopting automated closed-system manufacturing to standardize production, leading to a 20% improvement in process consistency.
  • Optimizing bioprocessing parameters is central to these cost of goods reduction strategies, essential for scaling up cell therapy production to meet future demand.

What challenges does the Cell Therapy Industry face during its growth?

  • Prohibitive costs and complex reimbursement frameworks pose a key challenge affecting the growth of the cell therapy industry.

  • Significant challenges persist, primarily the high costs and navigating complex reimbursement frameworks for cell therapy. Payers are increasingly demanding value-based payment models to justify expenditures. The intricate distribution and supply chain logistics for living drugs require specialized cryogenic storage solutions and flawless execution to maintain product viability. Adherence to strict donor screening protocols is non-negotiable for safety.
  • Furthermore, evolving regulatory landscapes create uncertainty, with companies needing to manage disparate regulatory pathways for ATMPs globally. The technical difficulty in establishing standardized potency assays and robust cryopreservation protocols adds another layer of complexity, where inconsistencies can impact product efficacy by up to 10% between different processing methods.

Exclusive Technavio Analysis on Customer Landscape

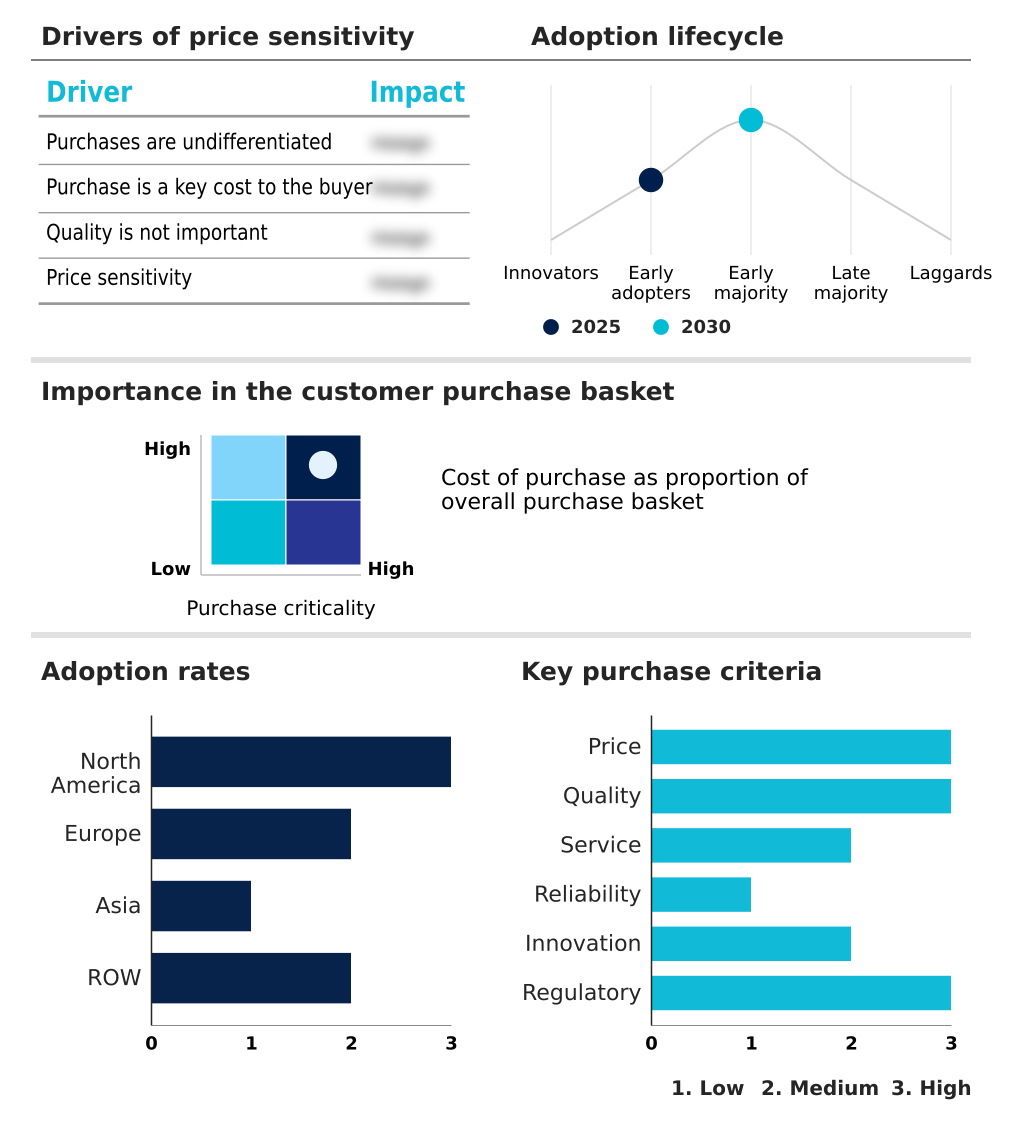
The cell therapy market forecasting report includes the adoption lifecycle of the market, covering from the innovator’s stage to the laggard’s stage. It focuses on adoption rates in different regions based on penetration. Furthermore, the cell therapy market report also includes key purchase criteria and drivers of price sensitivity to help companies evaluate and develop their market growth analysis strategies.

Customer Landscape of Cell Therapy Industry

Competitive Landscape

Companies are implementing various strategies, such as strategic alliances, cell therapy market forecast, partnerships, mergers and acquisitions, geographical expansion, and product/service launches, to enhance their presence in the industry.

AbelZeta Pharma Inc. - Developing next-generation CAR-T and TCR-T cell therapies to address solid tumors and hematological cancers.

The industry research and growth report includes detailed analyses of the competitive landscape of the market and information about key companies, including:

  • AbelZeta Pharma Inc.
  • Astellas Pharma Inc.
  • Athersys Inc.
  • Avita Medical Inc.
  • Bayer AG
  • Bristol Myers Squibb Co.
  • Castle Creek Biosciences Inc.
  • Celyad Oncology SA
  • CRISPR Therapeutics AG
  • Gilead Sciences Inc.
  • Johnson and Johnson Services
  • Kite Pharma Inc.
  • Lineage Cell Therapeutics Inc.
  • Novartis AG
  • Pharmicell Co. Ltd.
  • Sanpower Group Co. Ltd.
  • Sarepta Therapeutics Inc.
  • Vericel Corp.
  • Vertex Pharmaceuticals Inc.

Qualitative and quantitative analysis of companies has been conducted to help clients understand the wider business environment as well as the strengths and weaknesses of key industry players. Data is qualitatively analyzed to categorize companies as pure play, category-focused, industry-focused, and diversified; it is quantitatively analyzed to categorize companies as dominant, leading, strong, tentative, and weak.

Recent Development and News in Cell therapy market

  • In October, 2025, Bristol Myers Squibb announced its acquisition of Orbital Therapeutics, gaining access to a next-generation RNA platform and an investigational in vivo CAR T-cell therapy.
  • In November, 2025, Aspen Neuroscience secured $115 million in a Series C financing round to advance clinical development of its autologous stem cell-derived therapy for Parkinson disease.
  • In April, 2025, Abeona Therapeutics received United States Food and Drug Administration (FDA) approval for Zevaskyn, a cell-based gene therapy for recessive dystrophic epidermolysis bullosa (RDEB).
  • In June, 2025, Vertex Pharmaceuticals presented clinical trial data for zimislecel (VX-880), showing that a majority of participants with type 1 diabetes no longer required daily insulin.

Dive into Technavio’s robust research methodology, blending expert interviews, extensive data synthesis, and validated models for unparalleled Cell Therapy Market insights. See full methodology.

Market Scope
Page number 293
Base year 2025
Historic period 2020-2024
Forecast period 2026-2030
Growth momentum & CAGR Accelerate at a CAGR of 21.9%
Market growth 2026-2030 USD 18168.0 million
Market structure Fragmented
YoY growth 2025-2026(%) 19.0%
Key countries US, Canada, Mexico, Germany, UK, France, Italy, Spain, The Netherlands, China, India, Japan, South Korea, Indonesia, Thailand, Brazil, Saudi Arabia, UAE, Turkey, Argentina, Colombia, South Africa and Israel
Competitive landscape Leading Companies, Market Positioning of Companies, Competitive Strategies, and Industry Risks

Request Free Sample

Research Analyst Overview

  • The market's foundation is built upon complex science, from autologous cell therapy and allogeneic cell therapy to the intricacies of chimeric antigen receptor and T-cell receptor therapy. Central to development are induced pluripotent stem cells and mesenchymal stem cells, modified using advanced gene editing technologies.
  • A key boardroom consideration is the investment in bioprocessing parameters and bioreactor technology to standardize ex vivo cell manipulation. The transition to automated closed-system manufacturing is critical for maintaining good manufacturing practice standards and ensuring aseptic processing. For autologous treatments, managing the vein-to-vein time is a core operational metric, with integrated digital platforms reducing logistical delays by up to 20%.
  • The scientific challenge includes overcoming the immunosuppressive microenvironment to improve solid tumor infiltration and preventing antigen escape with multi-targeted constructs. Success requires validated potency assays, robust cryopreservation protocols, and stringent quality control testing against clear release criteria to ensure the safety and efficacy of treatments for conditions ranging from hematological malignancies to recessive dystrophic epidermolysis bullosa.

What are the Key Data Covered in this Cell Therapy Market Research and Growth Report?

  • What is the expected growth of the Cell Therapy Market between 2026 and 2030?

    • USD 18.17 billion, at a CAGR of 21.9%

  • What segmentation does the market report cover?

    • The report is segmented by Type (Autologous, and Allogenic), Application (Malignancies, Musculoskeletal, Cardiovascular, and Others), End-user (Biopharmaceutical companies, CMOs, CROs, and Academic and research institutes) and Geography (North America, Europe, Asia, Rest of World (ROW))

  • Which regions are analyzed in the report?

    • North America, Europe, Asia and Rest of World (ROW)

  • What are the key growth drivers and market challenges?

    • Increasing prevalence of chronic and degenerative diseases, Prohibitive costs and complex reimbursement frameworks

  • Who are the major players in the Cell Therapy Market?

    • AbelZeta Pharma Inc., Astellas Pharma Inc., Athersys Inc., Avita Medical Inc., Bayer AG, Bristol Myers Squibb Co., Castle Creek Biosciences Inc., Celyad Oncology SA, CRISPR Therapeutics AG, Gilead Sciences Inc., Johnson and Johnson Services, Kite Pharma Inc., Lineage Cell Therapeutics Inc., Novartis AG, Pharmicell Co. Ltd., Sanpower Group Co. Ltd., Sarepta Therapeutics Inc., Vericel Corp. and Vertex Pharmaceuticals Inc.

Market Research Insights

  • The market's dynamic is shaped by a strategic push toward scaling up cell therapy production, driven by cell engineering innovations. This involves a clear distinction in autologous vs allogeneic therapy approaches, with a focus on off-the-shelf cell products and the creation of universal donor cells.
  • Key regenerative medicine platforms are enabling new CAR-T cell therapies for cancer and expanding into cell therapy for autoimmune diseases. Managing supply chain logistics for living drugs requires advanced cryogenic storage solutions and strict aseptic technique.
  • Navigating regulatory pathways for ATMPs and varied reimbursement frameworks for cell therapy is critical, with firms showing a 25% greater success rate when engaging regulators early. Adopting digital tools for bioprocessing and robust analytical method validation improves consistency, while effective donor screening protocols and cell culture media optimization are fundamental to safety and efficacy.

We can help! Our analysts can customize this cell therapy market research report to meet your requirements.

Get in touch

1. Executive Summary

1.1 Market overview

Executive Summary - Chart on Market Overview
Executive Summary - Data Table on Market Overview
Executive Summary - Chart on Global Market Characteristics
Executive Summary - Chart on Market by Geography
Executive Summary - Chart on Market Segmentation by Type
Executive Summary - Chart on Market Segmentation by Application
Executive Summary - Chart on Market Segmentation by End-user
Executive Summary - Chart on Incremental Growth
Executive Summary - Data Table on Incremental Growth
Executive Summary - Chart on Company Market Positioning

2. Technavio Analysis

2.1 Analysis of price sensitivity, lifecycle, customer purchase basket, adoption rates, and purchase criteria

2.2 Criticality of inputs and Factors of differentiation

Chart on Overview on criticality of inputs and factors of differentiation

2.3 Factors of disruption

Chart on Overview on factors of disruption

2.4 Impact of drivers and challenges

Chart on Impact of drivers and challenges in 2025 and 2030

3. Market Landscape

3.1 Market ecosystem

Chart on Parent Market
Data Table on - Parent Market

3.2 Market characteristics

Chart on Market characteristics analysis

3.3 Value chain analysis

Chart on Value chain analysis

4. Market Sizing

4.1 Market definition

Data Table on Offerings of companies included in the market definition

4.2 Market segment analysis

Market segments

4.3 Market size 2025

4.4 Market outlook: Forecast for 2025-2030

Chart on Global - Market size and forecast 2025-2030 ($ million)
Data Table on Global - Market size and forecast 2025-2030 ($ million)
Chart on Global Market: Year-over-year growth 2025-2030 (%)
Data Table on Global Market: Year-over-year growth 2025-2030 (%)

5. Historic Market Size

5.1 Global Cell Therapy Market 2020 - 2024

Historic Market Size - Data Table on Global Cell Therapy Market 2020 - 2024 ($ million)

5.2 Type segment analysis 2020 - 2024

Historic Market Size - Type Segment 2020 - 2024 ($ million)

5.3 Application segment analysis 2020 - 2024

Historic Market Size - Application Segment 2020 - 2024 ($ million)

5.4 End-user segment analysis 2020 - 2024

Historic Market Size - End-user Segment 2020 - 2024 ($ million)

5.5 Geography segment analysis 2020 - 2024

Historic Market Size - Geography Segment 2020 - 2024 ($ million)

5.6 Country segment analysis 2020 - 2024

Historic Market Size - Country Segment 2020 - 2024 ($ million)

6. Qualitative Analysis

6.1 Impact of AI on global cell therapy market

6.2 Impact of geopolitical conflicts on global cell therapy market

7. Five Forces Analysis

7.1 Five forces summary

Five forces analysis - Comparison between 2025 and 2030

7.2 Bargaining power of buyers

Bargaining power of buyers - Impact of key factors 2025 and 2030

7.3 Bargaining power of suppliers

Bargaining power of suppliers - Impact of key factors in 2025 and 2030

7.4 Threat of new entrants

Threat of new entrants - Impact of key factors in 2025 and 2030

7.5 Threat of substitutes

Threat of substitutes - Impact of key factors in 2025 and 2030

7.6 Threat of rivalry

Threat of rivalry - Impact of key factors in 2025 and 2030

7.7 Market condition

Chart on Market condition - Five forces 2025 and 2030

8. Market Segmentation by Type

8.1 Market segments

Chart on Type - Market share 2025-2030 (%)
Data Table on Type - Market share 2025-2030 (%)

8.2 Comparison by Type

Chart on Comparison by Type
Data Table on Comparison by Type

8.3 Autologous - Market size and forecast 2025-2030

Chart on Autologous - Market size and forecast 2025-2030 ($ million)
Data Table on Autologous - Market size and forecast 2025-2030 ($ million)
Chart on Autologous - Year-over-year growth 2025-2030 (%)
Data Table on Autologous - Year-over-year growth 2025-2030 (%)

8.4 Allogenic - Market size and forecast 2025-2030

Chart on Allogenic - Market size and forecast 2025-2030 ($ million)
Data Table on Allogenic - Market size and forecast 2025-2030 ($ million)
Chart on Allogenic - Year-over-year growth 2025-2030 (%)
Data Table on Allogenic - Year-over-year growth 2025-2030 (%)

8.5 Market opportunity by Type

Market opportunity by Type ($ million)
Data Table on Market opportunity by Type ($ million)

9. Market Segmentation by Application

9.1 Market segments

Chart on Application - Market share 2025-2030 (%)
Data Table on Application - Market share 2025-2030 (%)

9.2 Comparison by Application

Chart on Comparison by Application
Data Table on Comparison by Application

9.3 Malignancies - Market size and forecast 2025-2030

Chart on Malignancies - Market size and forecast 2025-2030 ($ million)
Data Table on Malignancies - Market size and forecast 2025-2030 ($ million)
Chart on Malignancies - Year-over-year growth 2025-2030 (%)
Data Table on Malignancies - Year-over-year growth 2025-2030 (%)

9.4 Musculoskeletal - Market size and forecast 2025-2030

Chart on Musculoskeletal - Market size and forecast 2025-2030 ($ million)
Data Table on Musculoskeletal - Market size and forecast 2025-2030 ($ million)
Chart on Musculoskeletal - Year-over-year growth 2025-2030 (%)
Data Table on Musculoskeletal - Year-over-year growth 2025-2030 (%)

9.5 Cardiovascular - Market size and forecast 2025-2030

Chart on Cardiovascular - Market size and forecast 2025-2030 ($ million)
Data Table on Cardiovascular - Market size and forecast 2025-2030 ($ million)
Chart on Cardiovascular - Year-over-year growth 2025-2030 (%)
Data Table on Cardiovascular - Year-over-year growth 2025-2030 (%)

9.6 Others - Market size and forecast 2025-2030

Chart on Others - Market size and forecast 2025-2030 ($ million)
Data Table on Others - Market size and forecast 2025-2030 ($ million)
Chart on Others - Year-over-year growth 2025-2030 (%)
Data Table on Others - Year-over-year growth 2025-2030 (%)

9.7 Market opportunity by Application

Market opportunity by Application ($ million)
Data Table on Market opportunity by Application ($ million)

10. Market Segmentation by End-user

10.1 Market segments

Chart on End-user - Market share 2025-2030 (%)
Data Table on End-user - Market share 2025-2030 (%)

10.2 Comparison by End-user

Chart on Comparison by End-user
Data Table on Comparison by End-user

10.3 Biopharmaceutical companies - Market size and forecast 2025-2030

Chart on Biopharmaceutical companies - Market size and forecast 2025-2030 ($ million)
Data Table on Biopharmaceutical companies - Market size and forecast 2025-2030 ($ million)
Chart on Biopharmaceutical companies - Year-over-year growth 2025-2030 (%)
Data Table on Biopharmaceutical companies - Year-over-year growth 2025-2030 (%)

10.4 CMOs - Market size and forecast 2025-2030

Chart on CMOs - Market size and forecast 2025-2030 ($ million)
Data Table on CMOs - Market size and forecast 2025-2030 ($ million)
Chart on CMOs - Year-over-year growth 2025-2030 (%)
Data Table on CMOs - Year-over-year growth 2025-2030 (%)

10.5 CROs - Market size and forecast 2025-2030

Chart on CROs - Market size and forecast 2025-2030 ($ million)
Data Table on CROs - Market size and forecast 2025-2030 ($ million)
Chart on CROs - Year-over-year growth 2025-2030 (%)
Data Table on CROs - Year-over-year growth 2025-2030 (%)

10.6 Academic and research institutes - Market size and forecast 2025-2030

Chart on Academic and research institutes - Market size and forecast 2025-2030 ($ million)
Data Table on Academic and research institutes - Market size and forecast 2025-2030 ($ million)
Chart on Academic and research institutes - Year-over-year growth 2025-2030 (%)
Data Table on Academic and research institutes - Year-over-year growth 2025-2030 (%)

10.7 Market opportunity by End-user

Market opportunity by End-user ($ million)
Data Table on Market opportunity by End-user ($ million)

11. Customer Landscape

11.1 Customer landscape overview

Analysis of price sensitivity, lifecycle, customer purchase basket, adoption rates, and purchase criteria

12. Geographic Landscape

12.1 Geographic segmentation

Chart on Market share by geography 2025-2030 (%)
Data Table on Market share by geography 2025-2030 (%)

12.2 Geographic comparison

Chart on Geographic comparison
Data Table on Geographic comparison

12.3 North America - Market size and forecast 2025-2030

Chart on North America - Market size and forecast 2025-2030 ($ million)
Data Table on North America - Market size and forecast 2025-2030 ($ million)
Chart on North America - Year-over-year growth 2025-2030 (%)
Data Table on North America - Year-over-year growth 2025-2030 (%)
Chart on Regional Comparison - North America
Data Table on Regional Comparison - North America

12.3.1 US - Market size and forecast 2025-2030

Chart on US - Market size and forecast 2025-2030 ($ million)
Data Table on US - Market size and forecast 2025-2030 ($ million)
Chart on US - Year-over-year growth 2025-2030 (%)
Data Table on US - Year-over-year growth 2025-2030 (%)

12.3.2 Canada - Market size and forecast 2025-2030

Chart on Canada - Market size and forecast 2025-2030 ($ million)
Data Table on Canada - Market size and forecast 2025-2030 ($ million)
Chart on Canada - Year-over-year growth 2025-2030 (%)
Data Table on Canada - Year-over-year growth 2025-2030 (%)

12.3.3 Mexico - Market size and forecast 2025-2030

Chart on Mexico - Market size and forecast 2025-2030 ($ million)
Data Table on Mexico - Market size and forecast 2025-2030 ($ million)
Chart on Mexico - Year-over-year growth 2025-2030 (%)
Data Table on Mexico - Year-over-year growth 2025-2030 (%)

12.4 Europe - Market size and forecast 2025-2030

Chart on Europe - Market size and forecast 2025-2030 ($ million)
Data Table on Europe - Market size and forecast 2025-2030 ($ million)
Chart on Europe - Year-over-year growth 2025-2030 (%)
Data Table on Europe - Year-over-year growth 2025-2030 (%)
Chart on Regional Comparison - Europe
Data Table on Regional Comparison - Europe

12.4.1 Germany - Market size and forecast 2025-2030

Chart on Germany - Market size and forecast 2025-2030 ($ million)
Data Table on Germany - Market size and forecast 2025-2030 ($ million)
Chart on Germany - Year-over-year growth 2025-2030 (%)
Data Table on Germany - Year-over-year growth 2025-2030 (%)

12.4.2 UK - Market size and forecast 2025-2030

Chart on UK - Market size and forecast 2025-2030 ($ million)
Data Table on UK - Market size and forecast 2025-2030 ($ million)
Chart on UK - Year-over-year growth 2025-2030 (%)
Data Table on UK - Year-over-year growth 2025-2030 (%)

12.4.3 France - Market size and forecast 2025-2030

Chart on France - Market size and forecast 2025-2030 ($ million)
Data Table on France - Market size and forecast 2025-2030 ($ million)
Chart on France - Year-over-year growth 2025-2030 (%)
Data Table on France - Year-over-year growth 2025-2030 (%)

12.4.4 Italy - Market size and forecast 2025-2030

Chart on Italy - Market size and forecast 2025-2030 ($ million)
Data Table on Italy - Market size and forecast 2025-2030 ($ million)
Chart on Italy - Year-over-year growth 2025-2030 (%)
Data Table on Italy - Year-over-year growth 2025-2030 (%)

12.4.5 Spain - Market size and forecast 2025-2030

Chart on Spain - Market size and forecast 2025-2030 ($ million)
Data Table on Spain - Market size and forecast 2025-2030 ($ million)
Chart on Spain - Year-over-year growth 2025-2030 (%)
Data Table on Spain - Year-over-year growth 2025-2030 (%)

12.4.6 The Netherlands - Market size and forecast 2025-2030

Chart on The Netherlands - Market size and forecast 2025-2030 ($ million)
Data Table on The Netherlands - Market size and forecast 2025-2030 ($ million)
Chart on The Netherlands - Year-over-year growth 2025-2030 (%)
Data Table on The Netherlands - Year-over-year growth 2025-2030 (%)

12.5 Asia - Market size and forecast 2025-2030

Chart on Asia - Market size and forecast 2025-2030 ($ million)
Data Table on Asia - Market size and forecast 2025-2030 ($ million)
Chart on Asia - Year-over-year growth 2025-2030 (%)
Data Table on Asia - Year-over-year growth 2025-2030 (%)
Chart on Regional Comparison - Asia
Data Table on Regional Comparison - Asia

12.5.1 China - Market size and forecast 2025-2030

Chart on China - Market size and forecast 2025-2030 ($ million)
Data Table on China - Market size and forecast 2025-2030 ($ million)
Chart on China - Year-over-year growth 2025-2030 (%)
Data Table on China - Year-over-year growth 2025-2030 (%)

12.5.2 India - Market size and forecast 2025-2030

Chart on India - Market size and forecast 2025-2030 ($ million)
Data Table on India - Market size and forecast 2025-2030 ($ million)
Chart on India - Year-over-year growth 2025-2030 (%)
Data Table on India - Year-over-year growth 2025-2030 (%)

12.5.3 Japan - Market size and forecast 2025-2030

Chart on Japan - Market size and forecast 2025-2030 ($ million)
Data Table on Japan - Market size and forecast 2025-2030 ($ million)
Chart on Japan - Year-over-year growth 2025-2030 (%)
Data Table on Japan - Year-over-year growth 2025-2030 (%)

12.5.4 South Korea - Market size and forecast 2025-2030

Chart on South Korea - Market size and forecast 2025-2030 ($ million)
Data Table on South Korea - Market size and forecast 2025-2030 ($ million)
Chart on South Korea - Year-over-year growth 2025-2030 (%)
Data Table on South Korea - Year-over-year growth 2025-2030 (%)

12.5.5 Indonesia - Market size and forecast 2025-2030

Chart on Indonesia - Market size and forecast 2025-2030 ($ million)
Data Table on Indonesia - Market size and forecast 2025-2030 ($ million)
Chart on Indonesia - Year-over-year growth 2025-2030 (%)
Data Table on Indonesia - Year-over-year growth 2025-2030 (%)

12.5.6 Thailand - Market size and forecast 2025-2030

Chart on Thailand - Market size and forecast 2025-2030 ($ million)
Data Table on Thailand - Market size and forecast 2025-2030 ($ million)
Chart on Thailand - Year-over-year growth 2025-2030 (%)
Data Table on Thailand - Year-over-year growth 2025-2030 (%)

12.6 Rest of World (ROW) - Market size and forecast 2025-2030

Chart on Rest of World (ROW) - Market size and forecast 2025-2030 ($ million)
Data Table on Rest of World (ROW) - Market size and forecast 2025-2030 ($ million)
Chart on Rest of World (ROW) - Year-over-year growth 2025-2030 (%)
Data Table on Rest of World (ROW) - Year-over-year growth 2025-2030 (%)
Chart on Regional Comparison - Rest of World (ROW)
Data Table on Regional Comparison - Rest of World (ROW)

12.6.1 Brazil - Market size and forecast 2025-2030

Chart on Brazil - Market size and forecast 2025-2030 ($ million)
Data Table on Brazil - Market size and forecast 2025-2030 ($ million)
Chart on Brazil - Year-over-year growth 2025-2030 (%)
Data Table on Brazil - Year-over-year growth 2025-2030 (%)

12.6.2 Saudi Arabia - Market size and forecast 2025-2030

Chart on Saudi Arabia - Market size and forecast 2025-2030 ($ million)
Data Table on Saudi Arabia - Market size and forecast 2025-2030 ($ million)
Chart on Saudi Arabia - Year-over-year growth 2025-2030 (%)
Data Table on Saudi Arabia - Year-over-year growth 2025-2030 (%)

12.6.3 UAE - Market size and forecast 2025-2030

Chart on UAE - Market size and forecast 2025-2030 ($ million)
Data Table on UAE - Market size and forecast 2025-2030 ($ million)
Chart on UAE - Year-over-year growth 2025-2030 (%)
Data Table on UAE - Year-over-year growth 2025-2030 (%)

12.6.4 Turkey - Market size and forecast 2025-2030

Chart on Turkey - Market size and forecast 2025-2030 ($ million)
Data Table on Turkey - Market size and forecast 2025-2030 ($ million)
Chart on Turkey - Year-over-year growth 2025-2030 (%)
Data Table on Turkey - Year-over-year growth 2025-2030 (%)

12.6.5 Argentina - Market size and forecast 2025-2030

Chart on Argentina - Market size and forecast 2025-2030 ($ million)
Data Table on Argentina - Market size and forecast 2025-2030 ($ million)
Chart on Argentina - Year-over-year growth 2025-2030 (%)
Data Table on Argentina - Year-over-year growth 2025-2030 (%)

12.6.6 Colombia - Market size and forecast 2025-2030

Chart on Colombia - Market size and forecast 2025-2030 ($ million)
Data Table on Colombia - Market size and forecast 2025-2030 ($ million)
Chart on Colombia - Year-over-year growth 2025-2030 (%)
Data Table on Colombia - Year-over-year growth 2025-2030 (%)

12.6.7 South Africa - Market size and forecast 2025-2030

Chart on South Africa - Market size and forecast 2025-2030 ($ million)
Data Table on South Africa - Market size and forecast 2025-2030 ($ million)
Chart on South Africa - Year-over-year growth 2025-2030 (%)
Data Table on South Africa - Year-over-year growth 2025-2030 (%)

12.6.8 Israel - Market size and forecast 2025-2030

Chart on Israel - Market size and forecast 2025-2030 ($ million)
Data Table on Israel - Market size and forecast 2025-2030 ($ million)
Chart on Israel - Year-over-year growth 2025-2030 (%)
Data Table on Israel - Year-over-year growth 2025-2030 (%)

12.7 Market opportunity by geography

Market opportunity by geography ($ million)
Data Tables on Market opportunity by geography ($ million)

13. Drivers, Challenges, and Opportunity

13.1 Market drivers

Increasing prevalence of chronic and degenerative diseases
Technological advancements and innovations in cell engineering
Expanding clinical pipeline and strategic industry collaborations

13.2 Market challenges

Prohibitive costs and complex reimbursement frameworks
Intricate distribution and supply chain logistics
Evolving and divergent regulatory landscapes

13.3 Impact of drivers and challenges

Impact of drivers and challenges in 2025 and 2030

13.4 Market opportunities

Growing emphasis on allogenic and off-shelf therapies
Strategic pivot towards solid tumor applications
Integration of automation and digital technologies in manufacturing

14. Competitive Landscape

14.1 Overview

14.2

Overview on criticality of inputs and factors of differentiation

14.3 Landscape disruption

Overview on factors of disruption

14.4 Industry risks

Impact of key risks on business

15. Competitive Analysis

15.1 Companies profiled

Companies covered

15.2 Company ranking index

15.3 Market positioning of companies

Matrix on companies position and classification

15.4 AbelZeta Pharma Inc.

AbelZeta Pharma Inc. - Overview
AbelZeta Pharma Inc. - Product / Service
AbelZeta Pharma Inc. - Key offerings
SWOT

15.5 Astellas Pharma Inc.

Astellas Pharma Inc. - Overview
Astellas Pharma Inc. - Product / Service
Astellas Pharma Inc. - Key news
Astellas Pharma Inc. - Key offerings
SWOT

15.6 Avita Medical Inc.

Avita Medical Inc. - Overview
Avita Medical Inc. - Product / Service
Avita Medical Inc. - Key offerings
SWOT

15.7 Bayer AG

Bayer AG - Overview
Bayer AG - Business segments
Bayer AG - Key offerings
Bayer AG - Segment focus
SWOT

15.8 Bristol Myers Squibb Co.

Bristol Myers Squibb Co. - Overview
Bristol Myers Squibb Co. - Product / Service
Bristol Myers Squibb Co. - Key news
Bristol Myers Squibb Co. - Key offerings
SWOT

15.9 Castle Creek Biosciences Inc.

Castle Creek Biosciences Inc. - Overview
Castle Creek Biosciences Inc. - Product / Service
Castle Creek Biosciences Inc. - Key offerings
SWOT

15.10 Celyad Oncology SA

Celyad Oncology SA - Overview
Celyad Oncology SA - Product / Service
Celyad Oncology SA - Key offerings
SWOT

15.11 Gilead Sciences Inc.

Gilead Sciences Inc. - Overview
Gilead Sciences Inc. - Business segments
Gilead Sciences Inc. - Key offerings
Gilead Sciences Inc. - Segment focus
SWOT

15.12 Johnson and Johnson Services

Johnson and Johnson Services - Overview
Johnson and Johnson Services - Business segments
Johnson and Johnson Services - Key news
Johnson and Johnson Services - Key offerings
Johnson and Johnson Services - Segment focus
SWOT

15.13 Kite Pharma Inc.

Kite Pharma Inc. - Overview
Kite Pharma Inc. - Product / Service
Kite Pharma Inc. - Key offerings
SWOT

15.14 Novartis AG

Novartis AG - Overview
Novartis AG - Business segments
Novartis AG - Key news
Novartis AG - Key offerings
Novartis AG - Segment focus
SWOT

15.15 Sanpower Group Co. Ltd.

Sanpower Group Co. Ltd. - Overview
Sanpower Group Co. Ltd. - Product / Service
Sanpower Group Co. Ltd. - Key offerings
SWOT

15.16 Sarepta Therapeutics Inc.

Sarepta Therapeutics Inc. - Overview
Sarepta Therapeutics Inc. - Product / Service
Sarepta Therapeutics Inc. - Key offerings
SWOT

15.17 Vericel Corp.

Vericel Corp. - Overview
Vericel Corp. - Product / Service
Vericel Corp. - Key offerings
SWOT

15.18 Vertex Pharmaceuticals Inc.

Vertex Pharmaceuticals Inc. - Overview
Vertex Pharmaceuticals Inc. - Product / Service
Vertex Pharmaceuticals Inc. - Key offerings
SWOT

16. Appendix

16.1 Scope of the report

Market definition
Objectives
Notes and caveats

16.2 Inclusions and exclusions checklist

Inclusions checklist
Exclusions checklist

16.3 Currency conversion rates for US$

16.4 Research methodology

16.5 Data procurement

Information sources

16.6 Data validation

16.7 Validation techniques employed for market sizing

16.8 Data synthesis

16.9 360 degree market analysis

16.10 List of abbreviations

Research Methodology

Technavio presents a detailed picture of the market by way of study, synthesis, and summation of data from multiple sources. The analysts have presented the various facets of the market with a particular focus on identifying the key industry influencers. The data thus presented is comprehensive, reliable, and the result of extensive research, both primary and secondary.

INFORMATION SOURCES

Primary sources

  • Manufacturers and suppliers
  • Channel partners
  • Industry experts
  • Strategic decision makers

Secondary sources

  • Industry journals and periodicals
  • Government data
  • Financial reports of key industry players
  • Historical data
  • Press releases

DATA ANALYSIS

Data Synthesis

  • Collation of data
  • Estimation of key figures
  • Analysis of derived insights

Data Validation

  • Triangulation with data models
  • Reference against proprietary databases
  • Corroboration with industry experts

REPORT WRITING

Qualitative

  • Market drivers
  • Market challenges
  • Market trends
  • Five forces analysis

Quantitative

  • Market size and forecast
  • Market segmentation
  • Geographical insights
  • Competitive landscape

Interested in this report?

Get your sample now to see our research methodology and insights!

Download Now

Frequently Asked Questions

Cell Therapy market growth will increase by USD 18168.0 million during 2026-2030.

The Cell Therapy market is expected to grow at a CAGR of 21.9% during 2026-2030.

Cell Therapy market is segmented by Type (Autologous, Allogenic) Application (Malignancies, Musculoskeletal, Cardiovascular, Others) End-user (Biopharmaceutical companies, CMOs, CROs, Academic and research institutes)

AbelZeta Pharma Inc., Astellas Pharma Inc., Athersys Inc., Avita Medical Inc., Bayer AG, Bristol Myers Squibb Co., Castle Creek Biosciences Inc., Celyad Oncology SA, CRISPR Therapeutics AG, Gilead Sciences Inc., Johnson and Johnson Services, Kite Pharma Inc., Lineage Cell Therapeutics Inc., Novartis AG, Pharmicell Co. Ltd., Sanpower Group Co. Ltd., Sarepta Therapeutics Inc., Vericel Corp., Vertex Pharmaceuticals Inc. are a few of the key vendors in the Cell Therapy market.

North America will register the highest growth rate of 39.3% among the other regions. Therefore, the Cell Therapy market in North America is expected to garner significant business opportunities for the vendors during the forecast period.

US, Canada, Mexico, Germany, UK, France, Italy, Spain, The Netherlands, China, India, Japan, South Korea, Indonesia, Thailand, Brazil, Saudi Arabia, UAE, Turkey, Argentina, Colombia, South Africa, Israel

  • Increasing prevalence of chronic and degenerative diseases is the driving factor this market.

The Cell Therapy market vendors should focus on grabbing business opportunities from the Type segment as it accounted for the largest market share in the base year.
RIA - Research AI Assistant
Ask RIA