Cement Market Analysis APAC, Middle East and Africa, Europe, North America, South America - China, India, US, Turkey, Indonesia - Size and Forecast 2024-2028

Cement Market Analysis APAC, Middle East and Africa, Europe, North America, South America - China, India, US, Turkey, Indonesia - Size and Forecast 2024-2028

Published: Aug 2024 179 Pages SKU: IRTNTR70716

Market Overview at a Glance

$89.4 B
Market Opportunity
4.25%
CAGR
4.09
YoY growth 2023-2024(%)

Cement Market Size 2024-2028

The cement market is estimated to grow by USD 89.4 billion at a CAGR of 4.25% between 2023 and 2028. The market is experiencing significant growth, driven by increasing investments in road and highway infrastructure projects, particularly in the highway sectors. This trend is fueled by government initiatives to improve connectivity and boost economic development. The market is expanding rapidly due to increased construction activities, with rising demand for high-quality cement products driving advancements in production technologies and sustainable building practices. Another key trend is the adoption of alternative fuels in cement manufacturing, such as waste materials and biomass, to reduce carbon emissions and improve sustainability. Additionally, rising construction costs are pushing cement producers to increase efficiency and reduce production costs through technological advancements and economies of scale. These factors, along with population growth and urbanization, are expected to continue driving market growth in the coming years.

What will be the size of the Market During the Forecast Period?

Cement Market Size

To learn more about this report, Download Report Sample

Market Segmentation

By Product

The market share growth by the blended segment will be significant during the forecast period. Blended cement is a product in which part of the clinker is substituted with other materials. The market plays a pivotal role in the infrastructure and construction sectors, particularly in the development of airports, bridges, commercial projects, and buildings. Cement consumption is driven by the demand for concrete in various applications, including the construction of healthcare centers, hospitals, housing, and dams. Cement formulations have evolved to include eco-friendly options, such as blended cement and green cement, which help reduce carbon emissions and the environmental footprint.

Cement Market Size

Get a glance at the market contribution of various segments Request a PDF Sample

The blended segment was valued at USD 184.20 billion in 2018The production of this product involves interring one or more additives, in various proportions, at the grinding stage. Thus, blended cement can be defined as the uniform mix of portland cement and blending materials such as silica fumes, fly ash, limestone, and slag to enhance its properties for different applications. The consumption of this product is increasing as it can improve the workability, strength, durability, and chemical resistance of concrete. Additionally, water consumption is less, which makes it easy to work with and shape. This product can also be used in functions such as domestic construction, engineering projects, mining applications, and road construction. Therefore, the increase in various infrastructural development projects will drive the demand for blended cement and, contribute to the growth of the market in focus during the forecast period. 

By Region

Cement Market Share by Geography

For more insights on the market share of various regions Request PDF Sample now!

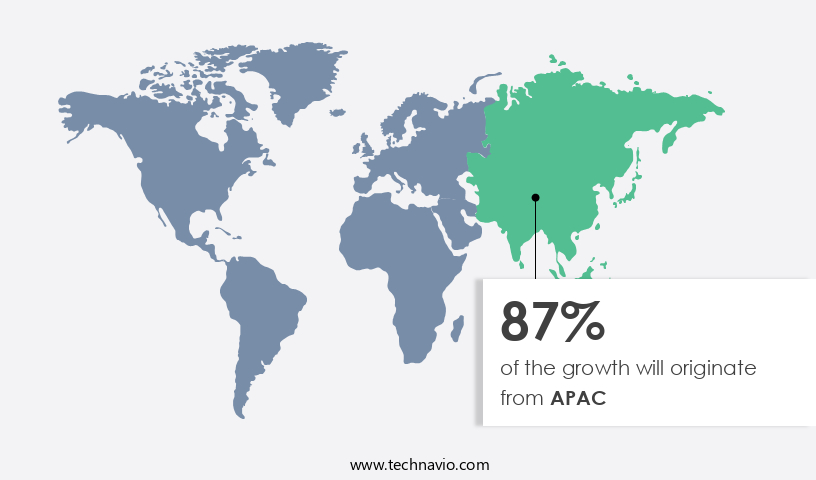
APAC is estimated to contribute 87% to the growth of the global market during the forecast period. Technavio’s analysts have elaborately explained the regional trends and drivers that shape the market during the forecast period. In 2022, APAC accounted for the largest share of the global market in terms of consumption. The market in APAC is dominated by China, Japan, India, Australia, South Korea, and Indonesia. The factors responsible for the growth of the market in APAC are growing industrialization, rapid urbanization, and increasing infrastructure development. APAC is leading the market as it is home to some of the leading manufacturing and export-oriented countries. Several countries in APAC are witnessing rapid economic growth, which is boosting the industrial sector and increasing the urbanization rate. China, India, Japan, and Australia significantly contribute to the growth of the market in APAC. 

Moreover, in APAC, population growth will also fuel the demand for cement during the forecast period. The Smart City Mission by the Government of India has increased infrastructure development in the country. The ongoing infrastructure projects across the country will drive the demand during the forecast period. Such projects require cement, which will drive the growth of the market in APAC during the forecast period. The construction industry in several Asian countries is also growing. Developing countries, including India, Vietnam, Indonesia, and Malaysia, where residential housing constructions are growing exponentially due to a rise in household incomes and increasing urbanization, are expected to be significant contributors to the growth of the market in APAC during the forecast period.

Market Dynamics and Customer Landscape

The market witnesses robust growth driven by worldwide demand in both the industrial and institutional sectors and the infrastructure sector. From residential buildings to public infrastructure like healthcare centers and hospitals, emerging economies fuel expansion. Embracing sustainability initiatives and eco-friendly construction practices, the market thrives on concrete homes and non-residential buildings. Cement formulations evolve to meet stringent environmental regulations, aligning with modern construction trends in both residential and commercial projects. With ample availability of resources like clay, iron ore, and bauxite, the industry remains pivotal in global development. Our researchers analyzed the data with 2023 as the base year, along with the key drivers, trends, and challenges. A holistic analysis of drivers will help companies refine their marketing strategies to gain a competitive advantage.

Key Market Driver

The use of energy-efficient technologies is notably driving market growth. Manufacturing requires a huge amount of energy, and carbon dioxide is released in high volumes during the process. This emission of carbon dioxide can be conserved and used in different aspects. To conserve energy efficiently, the manufacturing units have created new technologies that can bring better results in the future. This will be a driver for the growth of the industry in the future.

Additionally, the level of carbon dioxide emission will also decrease, as companies have created new technologies such as fillers and cement additives like DOW latex powder. In recent years, the production of composite cement has been increasing due to reasons such as process economics, energy reduction, ecology (mostly reduction of CO2 emission), conservation of resources, and product quality/diversity. Energy-efficient grinding systems are also used in cement manufacturing at present. Thus, the use of energy-efficient technologies will drive the market to focus during the forecast period.

Significant Market Trend

The rising demand for green cement is a major trend in the market. The increase in construction and building activities is the primary factor for the growth of the global market. Green cement demand is accelerating the growth of alternative fuels that are derived from waste materials such as solid recovered fuels, foundry sand, used oils, sewage sludge, animal meals, filter cakes, and fly ash. The urgent need to reduce carbon dioxide emissions encourages the use of alternative fuels. Governments promoting green architecture can gain quick footholds in the market to ensure sustainable construction.

Moreover, the durability offered by green cement for various construction projects compared to OPC for a less alkaline mixture is expected to play an important role in the development of the market. Future projects such as nuclear power plants, the construction of bridges and pavements, and other infrastructure projects are expected to lead to high demand for lucrative opportunities across the market. The main reason for the increase in demand for green cement in construction is also its lower water consumption. They offer excellent thermal insulation and excellent fire resistance. Thus, increasing demand for green cement will drive the market during the forecast period.

Major Market Challenge

The increase in construction cost is a major factor impeding the market. Building materials such as stainless steel, hardened steel, cast iron, cement, concrete, brick, aggregate, and other building materials are used in the construction industry. The price of cement is about 1-15% of the construction costs, the price of steel is about 8-10% of the construction costs, and the share of other materials is 25-30% of the construction costs.

However, the availability of these materials creates a cycle of variable price, where an increase in the price of one building material increases the total cost of construction, which leads to the need for additional investment in the total cost of construction. For example, a building needs bricks, cement, mortar, steel, and other materials. When steel prices rise, construction costs rise; as a result, construction costs also increase. An increase in the cost of one segment increases the total construction cost, which can be a big challenge for builders and construction companies. Construction companies in European countries such as the UK, France, and Germany are financially strong and able to withstand price increases for ongoing construction projects. However, African countries such as Nigeria and Namibia are unable to contain such price increases due to the unstable economies of these countries. Thus, the aforementioned factors make it difficult for the consolidation of the market during the forecast period.

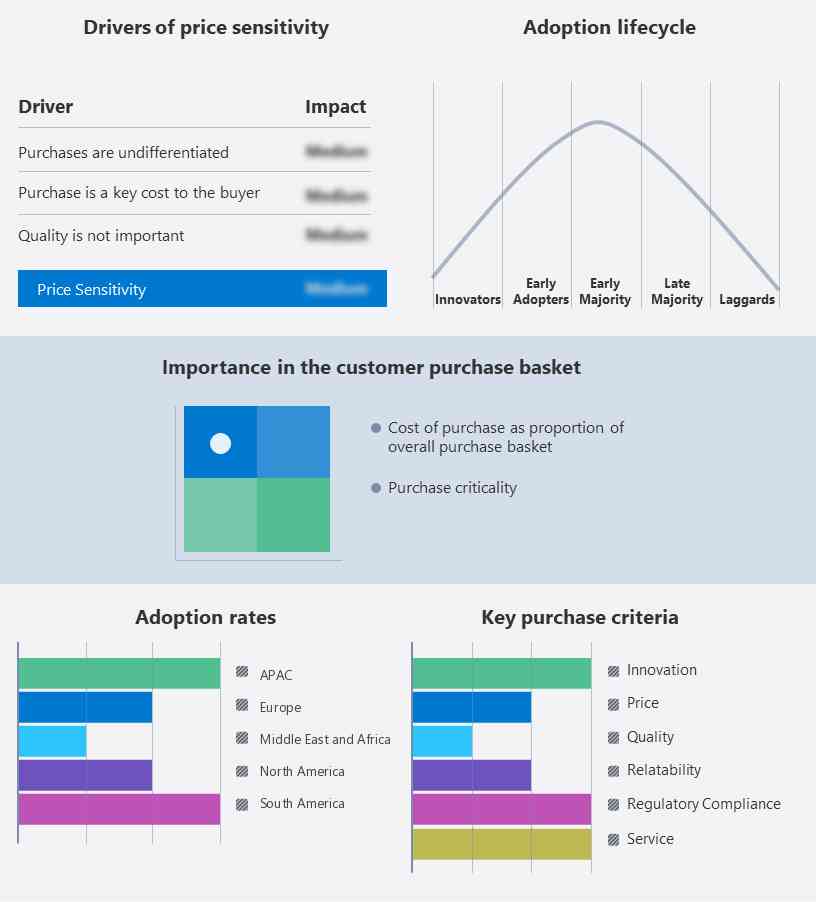
Key Market Customer Landscape

The report includes the adoption lifecycle of the market, covering from the innovator’s stage to the laggard’s stage. It focuses on adoption rates in different regions based on penetration. Furthermore, the report also includes key purchase criteria and drivers of price sensitivity to help companies evaluate and develop their growth strategies.

Cement Market Share by Geography

Global Market Customer Landscape

Who are the Major Market Companies?

Companies are implementing various strategies, such as strategic alliances, partnerships, mergers and acquisitions, geographical expansion, and product/service launches, to enhance their presence in the market.

GRUPO ARGOS S.A. - The company?offers cement solutions through its subsidiary ARGOS. 

The report also includes detailed analyses of the competitive landscape of the market and information about 15 market companies, including:

  • Adbri Ltd.
  • Al Safwa Ltd.
  • Buzzi Unicem SpA
  • Cementir Holding NV
  • CEMEX SAB de CV
  • China National Building Material Co. Ltd.
  • Drake
  • Epcco Publishing Group Ltd.
  • Fujairah Cement Industries PJSC
  • HeidelbergCement AG
  • Holcim Ltd.
  • INTERCEMENT PARTICIPACOES SA
  • PPC Ltd.
  • Siam Cement PCL
  • Taiheiyo Cement Corp.

Qualitative and quantitative analysis of companies has been conducted to help clients understand the wider business environment as well as the strengths and weaknesses of key market players. Data is qualitatively analyzed to categorize companies as pure play, category-focused, industry-focused, and diversified; it is quantitatively analyzed to categorize companies as dominant, leading, strong, tentative, and weak.

Segment Overview

The market research report provides comprehensive data (region-wise segment analysis), with forecasts and estimates in "USD Billion" for the period 2024 to 2028, as well as historical data from 2018 to 2022 for the following segments.

  • Product Outlook 
    • Blended
    • Portland
    • Others
  • End-user Outlook
    • Residential
    • Non-residential
  • Region Outlook 
    • North America
      • The U.S.
      • Canada
    • Europe
      • The U.K.
      • Germany
      • France
      • Rest of Europe
    • APAC
      • China
      • India
    • Middle East & Africa
      • Saudi Arabia
      • South Africa
      • Rest of the Middle East & Africa
    • South America
      • Chile
      • Brazil
      • Argentina

Market Analyst Overview

The market remains a significant economic driver, propelled by rising government investments in infrastructural projects like airports, dams, and railways. With a focus on sustainable construction practices, demand for eco-friendly building materials and green buildings surges. Solar-powered cement production and innovations like Synhelion reduce carbon emissions and environmental footprints. Amid labor and material shortages, construction activities continue to drive cement consumption, supporting the construction of megastructures such as shopping malls, Industrial and Institutional sector, and office buildings. Regulatory reforms and societal emphasis on societal well-being further shape the future of the cement industry.

Furthermore, the market plays a pivotal role in constructing mega structures like seaports and public buildings, meeting construction project volumes, and adhering to carbon emission targets. With a focus on energy efficiency and environmental footprint, demand for sustainable buildings rises, driving innovation in logistics and raw materials sourcing. Hima Cement and other industry leaders contribute to the production of precast products and panels, while residential projects and schools benefit from advancements in beams and Fundi masonry products. As the industry projects future growth, it continues to address challenges such as sulfur dioxide emissions and carbon footprint reduction.

Market  Scope

Report Coverage

Details

Page number

179

Base year

2023

Historic period

2018 - 2022

Forecast period

2024-2028

Growth momentum & CAGR

Accelerate at a CAGR of 4.25%

Market growth 2024-2028

USD 89.4 billion

Market structure

 Fragmented

YoY growth 2023-2024(%)

4.09

Regional analysis

APAC, Middle East and Africa, Europe, North America, and South America

Performing market contribution

APAC at 87%

Key countries

China, India, US, Turkey, and Indonesia

Competitive landscape

Leading Companies, Market Positioning of Companies, Competitive Strategies, and Industry Risks

Key companies profiled

Adbri Ltd., Aditya Birla Management Corp. Pvt. Ltd., Al Safwa Ltd., Buzzi SpA, Cementir Holding NV, CEMEX SAB de CV, China National Building Material Co. Ltd., Drake, Epcco Publishing Group Ltd., GRUPO ARGOS S.A, Heidelberg Materials AG, Holcim Ltd., INTERCEMENT PARTICIPACOES SA, PPC Ltd., Siam Cement PCL, Sumitomo Osaka Cement Co. Ltd., Taiheiyo Cement Corp., Taiwan Cement Corp, and Votorantim SA

Market dynamics

Parent market analysis, Market Forecasting, Market growth inducers and obstacles, Fast-growing and slow-growing segment analysis, Market growth and Forecasting, COVID 19 impact and recovery analysis and future consumer dynamics, Market condition analysis for market forecast period

Customization purview

If our report has not included the data that you are looking for, you can reach out to our analysts and get segments customized.

Request PDF sample

What are the Key Data Covered in this Market Report?

  • CAGR of the market during the forecast period
  • Detailed information on factors that will drive the market growth and forecasting of the market between 2023 and 2027
  • Precise estimation of the size of the market size and its contribution to the parent market
  • Accurate predictions about upcoming market trends and analysis and changes in consumer behavior
    • Growth of the market industry across Europe, North America, APAC, South America, and Middle East and Africa
  • Thorough market growth analysis of the market’s competitive landscape and detailed information about companies
  • Comprehensive market analysis and report on the factors that will challenge the market research and growth of market companies

We can help! Our analysts can customize this report to meet your requirements. Get in touch

1 Executive Summary

  • 1.1 Market overview
    • Executive Summary - Chart on Market Overview
    • Executive Summary - Data Table on Market Overview
    • Executive Summary - Chart on Global Market Characteristics
    • Executive Summary - Chart on Market by Geography
    • Executive Summary - Chart on Market Segmentation by Product
    • Executive Summary - Chart on Market Segmentation by End-user
    • Executive Summary - Chart on Incremental Growth
    • Executive Summary - Data Table on Incremental Growth
    • Executive Summary - Chart on Company Market Positioning

2 Market Landscape

  • 2.1 Market ecosystem
    • Parent Market
    • Data Table on - Parent Market
  • 2.2 Market characteristics
    • Market characteristics analysis
  • 2.3 Value chain analysis
    • Value Chain Analysis

3 Market Sizing

  • 3.1 Market definition
    • Offerings of companies included in the market definition
  • 3.2 Market segment analysis
    • Market segments
  • 3.3 Market size 2023
    • 3.4 Market outlook: Forecast for 2023-2028
      • Chart on Global - Market size and forecast 2023-2028 ($ billion)
      • Data Table on Global - Market size and forecast 2023-2028 ($ billion)
      • Chart on Global Market: Year-over-year growth 2023-2028 (%)
      • Data Table on Global Market: Year-over-year growth 2023-2028 (%)

    4 Historic Market Size

    • 4.1 Global Cement Market 2018 - 2022
      • Historic Market Size - Data Table on Global Cement Market 2018 - 2022 ($ billion)
    • 4.2 Product segment analysis 2018 - 2022
      • Historic Market Size - Product Segment 2018 - 2022 ($ billion)
    • 4.3 End-user segment analysis 2018 - 2022
      • Historic Market Size - End-user Segment 2018 - 2022 ($ billion)
    • 4.4 Geography segment analysis 2018 - 2022
      • Historic Market Size - Geography Segment 2018 - 2022 ($ billion)
    • 4.5 Country segment analysis 2018 - 2022
      • Historic Market Size - Country Segment 2018 - 2022 ($ billion)

    5 Five Forces Analysis

    • 5.1 Five forces summary
      • Five forces analysis - Comparison between 2023 and 2028
    • 5.2 Bargaining power of buyers
      • Bargaining power of buyers - Impact of key factors 2023 and 2028
    • 5.3 Bargaining power of suppliers
      • Bargaining power of suppliers - Impact of key factors in 2023 and 2028
    • 5.4 Threat of new entrants
      • Threat of new entrants - Impact of key factors in 2023 and 2028
    • 5.5 Threat of substitutes
      • Threat of substitutes - Impact of key factors in 2023 and 2028
    • 5.6 Threat of rivalry
      • Threat of rivalry - Impact of key factors in 2023 and 2028
    • 5.7 Market condition
      • Chart on Market condition - Five forces 2023 and 2028

    6 Market Segmentation by Product

    • 6.1 Market segments
      • Chart on Product - Market share 2023-2028 (%)
      • Data Table on Product - Market share 2023-2028 (%)
    • 6.2 Comparison by Product
      • Chart on Comparison by Product
      • Data Table on Comparison by Product
    • 6.3 Blended - Market size and forecast 2023-2028
      • Chart on Blended - Market size and forecast 2023-2028 ($ billion)
      • Data Table on Blended - Market size and forecast 2023-2028 ($ billion)
      • Chart on Blended - Year-over-year growth 2023-2028 (%)
      • Data Table on Blended - Year-over-year growth 2023-2028 (%)
    • 6.4 Portland - Market size and forecast 2023-2028
      • Chart on Portland - Market size and forecast 2023-2028 ($ billion)
      • Data Table on Portland - Market size and forecast 2023-2028 ($ billion)
      • Chart on Portland - Year-over-year growth 2023-2028 (%)
      • Data Table on Portland - Year-over-year growth 2023-2028 (%)
    • 6.5 Others - Market size and forecast 2023-2028
      • Chart on Others - Market size and forecast 2023-2028 ($ billion)
      • Data Table on Others - Market size and forecast 2023-2028 ($ billion)
      • Chart on Others - Year-over-year growth 2023-2028 (%)
      • Data Table on Others - Year-over-year growth 2023-2028 (%)
    • 6.6 Market opportunity by Product
      • Market opportunity by Product ($ billion)
      • Data Table on Market opportunity by Product ($ billion)

    7 Market Segmentation by End-user

    • 7.1 Market segments
      • Chart on End-user - Market share 2023-2028 (%)
      • Data Table on End-user - Market share 2023-2028 (%)
    • 7.2 Comparison by End-user
      • Chart on Comparison by End-user
      • Data Table on Comparison by End-user
    • 7.3 Residential - Market size and forecast 2023-2028
      • Chart on Residential - Market size and forecast 2023-2028 ($ billion)
      • Data Table on Residential - Market size and forecast 2023-2028 ($ billion)
      • Chart on Residential - Year-over-year growth 2023-2028 (%)
      • Data Table on Residential - Year-over-year growth 2023-2028 (%)
    • 7.4 Non-residential - Market size and forecast 2023-2028
      • Chart on Non-residential - Market size and forecast 2023-2028 ($ billion)
      • Data Table on Non-residential - Market size and forecast 2023-2028 ($ billion)
      • Chart on Non-residential - Year-over-year growth 2023-2028 (%)
      • Data Table on Non-residential - Year-over-year growth 2023-2028 (%)
    • 7.5 Market opportunity by End-user
      • Market opportunity by End-user ($ billion)
      • Data Table on Market opportunity by End-user ($ billion)

    8 Customer Landscape

    • 8.1 Customer landscape overview
      • Analysis of price sensitivity, lifecycle, customer purchase basket, adoption rates, and purchase criteria

    9 Geographic Landscape

    • 9.1 Geographic segmentation
      • Chart on Market share by geography 2023-2028 (%)
      • Data Table on Market share by geography 2023-2028 (%)
    • 9.2 Geographic comparison
      • Chart on Geographic comparison
      • Data Table on Geographic comparison
    • 9.3 APAC - Market size and forecast 2023-2028
      • Chart on APAC - Market size and forecast 2023-2028 ($ billion)
      • Data Table on APAC - Market size and forecast 2023-2028 ($ billion)
      • Chart on APAC - Year-over-year growth 2023-2028 (%)
      • Data Table on APAC - Year-over-year growth 2023-2028 (%)
    • 9.4 Middle East and Africa - Market size and forecast 2023-2028
      • Chart on Middle East and Africa - Market size and forecast 2023-2028 ($ billion)
      • Data Table on Middle East and Africa - Market size and forecast 2023-2028 ($ billion)
      • Chart on Middle East and Africa - Year-over-year growth 2023-2028 (%)
      • Data Table on Middle East and Africa - Year-over-year growth 2023-2028 (%)
    • 9.5 Europe - Market size and forecast 2023-2028
      • Chart on Europe - Market size and forecast 2023-2028 ($ billion)
      • Data Table on Europe - Market size and forecast 2023-2028 ($ billion)
      • Chart on Europe - Year-over-year growth 2023-2028 (%)
      • Data Table on Europe - Year-over-year growth 2023-2028 (%)
    • 9.6 North America - Market size and forecast 2023-2028
      • Chart on North America - Market size and forecast 2023-2028 ($ billion)
      • Data Table on North America - Market size and forecast 2023-2028 ($ billion)
      • Chart on North America - Year-over-year growth 2023-2028 (%)
      • Data Table on North America - Year-over-year growth 2023-2028 (%)
    • 9.7 South America - Market size and forecast 2023-2028
      • Chart on South America - Market size and forecast 2023-2028 ($ billion)
      • Data Table on South America - Market size and forecast 2023-2028 ($ billion)
      • Chart on South America - Year-over-year growth 2023-2028 (%)
      • Data Table on South America - Year-over-year growth 2023-2028 (%)
    • 9.8 China - Market size and forecast 2023-2028
      • Chart on China - Market size and forecast 2023-2028 ($ billion)
      • Data Table on China - Market size and forecast 2023-2028 ($ billion)
      • Chart on China - Year-over-year growth 2023-2028 (%)
      • Data Table on China - Year-over-year growth 2023-2028 (%)
    • 9.9 India - Market size and forecast 2023-2028
      • Chart on India - Market size and forecast 2023-2028 ($ billion)
      • Data Table on India - Market size and forecast 2023-2028 ($ billion)
      • Chart on India - Year-over-year growth 2023-2028 (%)
      • Data Table on India - Year-over-year growth 2023-2028 (%)
    • 9.10 US - Market size and forecast 2023-2028
      • Chart on US - Market size and forecast 2023-2028 ($ billion)
      • Data Table on US - Market size and forecast 2023-2028 ($ billion)
      • Chart on US - Year-over-year growth 2023-2028 (%)
      • Data Table on US - Year-over-year growth 2023-2028 (%)
    • 9.11 Turkey - Market size and forecast 2023-2028
      • Chart on Turkey - Market size and forecast 2023-2028 ($ billion)
      • Data Table on Turkey - Market size and forecast 2023-2028 ($ billion)
      • Chart on Turkey - Year-over-year growth 2023-2028 (%)
      • Data Table on Turkey - Year-over-year growth 2023-2028 (%)
    • 9.12 Indonesia - Market size and forecast 2023-2028
      • Chart on Indonesia - Market size and forecast 2023-2028 ($ billion)
      • Data Table on Indonesia - Market size and forecast 2023-2028 ($ billion)
      • Chart on Indonesia - Year-over-year growth 2023-2028 (%)
      • Data Table on Indonesia - Year-over-year growth 2023-2028 (%)
    • 9.13 Market opportunity by geography
      • Market opportunity by geography ($ billion)
      • Data Tables on Market opportunity by geography ($ billion)

    10 Drivers, Challenges, and Opportunity/Restraints

    • 10.1 Market drivers
      • 10.2 Market challenges
        • 10.3 Impact of drivers and challenges
          • Impact of drivers and challenges in 2023 and 2028
        • 10.4 Market opportunities/restraints

          11 Competitive Landscape

          • 11.1 Overview
            • 11.2 Competitive Landscape
              • Overview on criticality of inputs and factors of differentiation
            • 11.3 Landscape disruption
              • Overview on factors of disruption
            • 11.4 Industry risks
              • Impact of key risks on business

            12 Competitive Analysis

            • 12.1 Companies profiled
              • Companies covered
            • 12.2 Market positioning of companies
              • Matrix on companies position and classification
            • 12.3 Adbri Ltd.
              • Adbri Ltd. - Overview
              • Adbri Ltd. - Business segments
              • Adbri Ltd. - Key offerings
              • Adbri Ltd. - Segment focus
            • 12.4 Aditya Birla Management Corp. Pvt. Ltd.
              • Aditya Birla Management Corp. Pvt. Ltd. - Overview
              • Aditya Birla Management Corp. Pvt. Ltd. - Product / Service
              • Aditya Birla Management Corp. Pvt. Ltd. - Key news
              • Aditya Birla Management Corp. Pvt. Ltd. - Key offerings
            • 12.5 Buzzi SpA
              • Buzzi SpA - Overview
              • Buzzi SpA - Business segments
              • Buzzi SpA - Key offerings
              • Buzzi SpA - Segment focus
            • 12.6 Cementir Holding NV
              • Cementir Holding NV - Overview
              • Cementir Holding NV - Business segments
              • Cementir Holding NV - Key news
              • Cementir Holding NV - Key offerings
              • Cementir Holding NV - Segment focus
            • 12.7 CEMEX SAB de CV
              • CEMEX SAB de CV - Overview
              • CEMEX SAB de CV - Business segments
              • CEMEX SAB de CV - Key news
              • CEMEX SAB de CV - Key offerings
              • CEMEX SAB de CV - Segment focus
            • 12.8 China National Building Material Co. Ltd.
              • China National Building Material Co. Ltd. - Overview
              • China National Building Material Co. Ltd. - Business segments
              • China National Building Material Co. Ltd. - Key offerings
              • China National Building Material Co. Ltd. - Segment focus
            • 12.9 Drake
              • Drake - Overview
              • Drake - Product / Service
              • Drake - Key offerings
            • 12.10 GRUPO ARGOS S.A
              • GRUPO ARGOS S.A - Overview
              • GRUPO ARGOS S.A - Business segments
              • GRUPO ARGOS S.A - Key offerings
              • GRUPO ARGOS S.A - Segment focus
            • 12.11 Heidelberg Materials AG
              • Heidelberg Materials AG - Overview
              • Heidelberg Materials AG - Business segments
              • Heidelberg Materials AG - Key news
              • Heidelberg Materials AG - Key offerings
              • Heidelberg Materials AG - Segment focus
            • 12.12 Holcim Ltd.
              • Holcim Ltd. - Overview
              • Holcim Ltd. - Business segments
              • Holcim Ltd. - Key news
              • Holcim Ltd. - Key offerings
              • Holcim Ltd. - Segment focus
            • 12.13 PPC Ltd.
              • PPC Ltd. - Overview
              • PPC Ltd. - Business segments
              • PPC Ltd. - Key offerings
              • PPC Ltd. - Segment focus
            • 12.14 Siam Cement PCL
              • Siam Cement PCL - Overview
              • Siam Cement PCL - Business segments
              • Siam Cement PCL - Key offerings
              • Siam Cement PCL - Segment focus
            • 12.15 Sumitomo Osaka Cement Co. Ltd.
              • Sumitomo Osaka Cement Co. Ltd. - Overview
              • Sumitomo Osaka Cement Co. Ltd. - Business segments
              • Sumitomo Osaka Cement Co. Ltd. - Key offerings
              • Sumitomo Osaka Cement Co. Ltd. - Segment focus
            • 12.16 Taiheiyo Cement Corp.
              • Taiheiyo Cement Corp. - Overview
              • Taiheiyo Cement Corp. - Business segments
              • Taiheiyo Cement Corp. - Key offerings
              • Taiheiyo Cement Corp. - Segment focus
            • 12.17 Votorantim SA
              • Votorantim SA - Overview
              • Votorantim SA - Product / Service
              • Votorantim SA - Key offerings

            13 Appendix

            • 13.1 Scope of the report
              • 13.2 Inclusions and exclusions checklist
                • Inclusions checklist
                • Exclusions checklist
              • 13.3 Currency conversion rates for US$
                • Currency conversion rates for US$
              • 13.4 Research methodology
                • Research methodology
              • 13.5 Data procurement
                • Information sources
              • 13.6 Data validation
                • Data validation
              • 13.7 Validation techniques employed for market sizing
                • Validation techniques employed for market sizing
              • 13.8 Data synthesis
                • Data synthesis
              • 13.9 360 degree market analysis
                • 360 degree market analysis
              • 13.10 List of abbreviations
                • List of abbreviations

              Research Methodology

              Technavio presents a detailed picture of the market by way of study, synthesis, and summation of data from multiple sources. The analysts have presented the various facets of the market with a particular focus on identifying the key industry influencers. The data thus presented is comprehensive, reliable, and the result of extensive research, both primary and secondary.

              INFORMATION SOURCES

              Primary sources

              • Manufacturers and suppliers
              • Channel partners
              • Industry experts
              • Strategic decision makers

              Secondary sources

              • Industry journals and periodicals
              • Government data
              • Financial reports of key industry players
              • Historical data
              • Press releases

              DATA ANALYSIS

              Data Synthesis

              • Collation of data
              • Estimation of key figures
              • Analysis of derived insights

              Data Validation

              • Triangulation with data models
              • Reference against proprietary databases
              • Corroboration with industry experts

              REPORT WRITING

              Qualitative

              • Market drivers
              • Market challenges
              • Market trends
              • Five forces analysis

              Quantitative

              • Market size and forecast
              • Market segmentation
              • Geographical insights
              • Competitive landscape

              Interested in this report?

              Get your sample now to see our research methodology and insights!

              Download Now

              Frequently Asked Questions

              Cement market growth will increase by $ 89.4 bn during 2024-2028.

              The Cement market is expected to grow at a CAGR of 4.25% during 2024-2028.

              Cement market is segmented by Product( Blended, Portland, Others) End-user( Residential, Non-residential, Europe, MEA, South America)

              Adbri Ltd., Aditya Birla Management Corp. Pvt. Ltd., Al Safwa Ltd., Buzzi SpA, Cementir Holding NV, CEMEX SAB de CV, China National Building Material Co. Ltd., Drake, Epcco Publishing Group Ltd., GRUPO ARGOS S.A, Heidelberg Materials AG, Holcim Ltd., INTERCEMENT PARTICIPACOES SA, PPC Ltd., Siam Cement PCL, Sumitomo Osaka Cement Co. Ltd., Taiheiyo Cement Corp., Taiwan Cement Corp, Votorantim SA are a few of the key vendors in the Cement market.

              APAC will register the highest growth rate of 87% among the other regions. Therefore, the Cement market in APAC is expected to garner significant business opportunities for the vendors during the forecast period.

              China, India, US, Turkey, Indonesia

              • Increasing investments in road and highway infrastructure projectsThe development of new roads and increasing investments in transportation and highway infrastructure projects are driving the growth of the global cement market. Cement is predominantly used in roadways and highway pavements. It is mixed with aggregates and other additives to overlay a road. Cement is preferred in road and highway construction owing to its significant strength and durability is the driving factor this market.
              • thermoplastic nature is the driving factor this market.
              • and waterproofing properties.China is the driving factor this market.
              • India is the driving factor this market.
              • Italy is the driving factor this market.
              • Russia is the driving factor this market.
              • Germany is the driving factor this market.
              • and the US are investing heavily in road/highway infrastructure projects. The demand for cement is mainly generated by developing economies as these countries lack proper road and transportation networks and infrastructure. These countries are spending heavily on evolving their transportation networks to assist their economic and industrial growth. However is the driving factor this market.
              • regular investments in technological advances in infrastructure projects in developed economies are also propelling the growth of the cement market in the roadways and highways sector. For instance is the driving factor this market.
              • in October 2017 is the driving factor this market.
              • the Indian government approved the construction of over 51 is the driving factor this market.
              • 500 miles of highway is the driving factor this market.
              • expressway is the driving factor this market.
              • and bridge projects under the Bharatmala Pariyojana program. In total is the driving factor this market.
              • these projects are expected to cost over $107 billion and are likely to be completed by 2025. Some of the major road/highway projects currently under development is the driving factor this market.
              • planning is the driving factor this market.
              • or construction are mentioned below:A2 highway: It is a major highway project currently under construction in Switzerland is the driving factor this market.
              • connecting the city of Basel and the municipality of Chiasso. The project is estimated to cost approximately $487 million.Stockholm bypass project: It is a 13-mile highway bypass project consisting of 11.18 miles of tunnels. The project consists of six lanes (three in each direction) and is expected to be completed by 2025.The US is the driving factor this market.
              • China is the driving factor this market.
              • and India are investing heavily in road infrastructure projects to upgrade and develop existing roads. Investments in large-scale highway projects are likely to increase the demand for cement during the forecast period. is the driving factor this market.

              The Cement market vendors should focus on grabbing business opportunities from the Blended segment as it accounted for the largest market share in the base year.