
Fly Ash Market Size 2026-2030
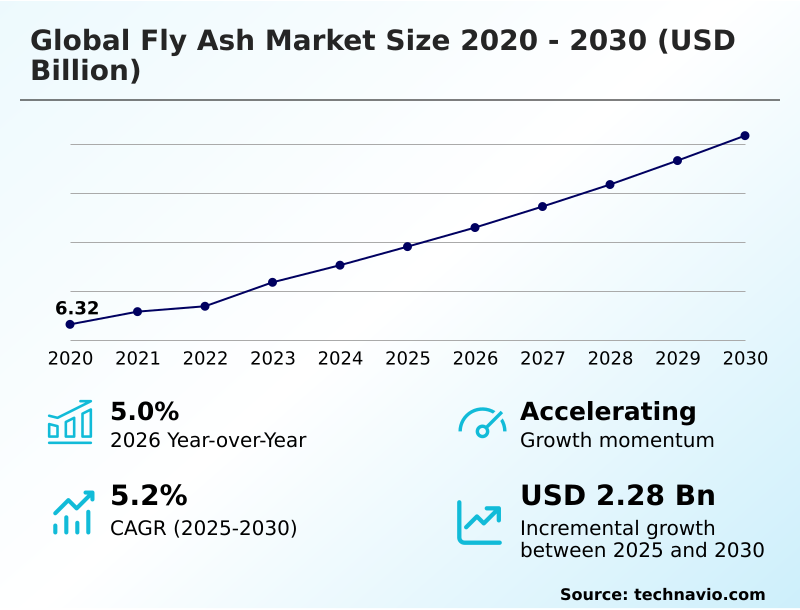
The fly ash market size is valued to increase by USD 2.28 billion, at a CAGR of 5.2% from 2025 to 2030. Rapid acceleration of infrastructure development and global urbanization will drive the fly ash market.
Major Market Trends & Insights
- APAC dominated the market and accounted for a 45.5% growth during the forecast period.
- By Application - Portland cement segment was valued at USD 2.90 billion in 2024
- By Type - Class F segment accounted for the largest market revenue share in 2024
Market Size & Forecast
- Market Opportunities: USD 3.86 billion
- Market Future Opportunities: USD 2.28 billion
- CAGR from 2025 to 2030 : 5.2%
Market Summary
- The Fly Ash Market is undergoing a profound transformation driven by the escalating emphasis on sustainable construction practices and the imperative to decarbonize building materials. As infrastructure modernization accelerates across emerging economies, the integration of coal combustion residuals into concrete mixtures reduces the clinker substitution ratio, driving massive demand.
- For example, ready mix concrete suppliers optimizing their supply chains to incorporate harvested legacy ash ponds have achieved a 25% reduction in overall material procurement costs compared to sourcing virgin Portland cement. This cost efficiency, combined with structural enhancements like hydration heat reduction, acts as a powerful market driver.
- However, the systemic transition toward renewable energy infrastructures introduces severe supply constraints. The decommissioning of thermal power plants restricts the availability of fresh raw material, forcing concrete producers to source from distant geographic regions, which subsequently inflates bulk transportation expenses.
- To maintain operational continuity despite this challenge, stakeholders are investing heavily in advanced electrostatic precipitator capture systems and beneficiation technologies, ensuring a continuous flow of specification-ready material for the construction sector.
What will be the Size of the Fly Ash Market during the forecast period?
Get Key Insights on Market Forecast (PDF) Get Free Sample
How is the Fly Ash Market Segmented?
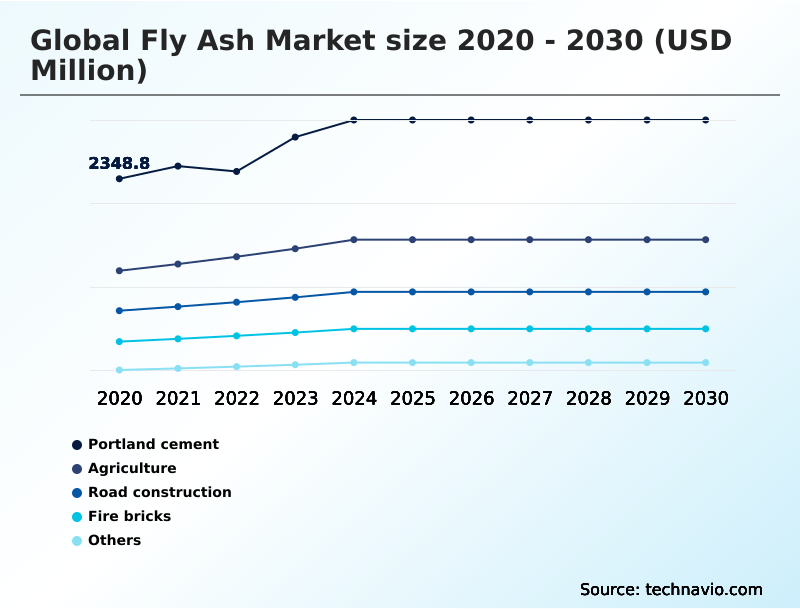
The fly ash industry research report provides comprehensive data (region-wise segment analysis), with forecasts and estimates in "USD million" for the period 2026-2030, as well as historical data from 2020-2024 for the following segments.
- Application
- Portland cement
- Agriculture
- Road construction
- Fire bricks
- Others
- Type
- Class F
- Class C
- End-user
- Construction
- Mining
- Water treatment
- Others
- Geography
- APAC
- China
- India
- Indonesia
- Japan
- South Korea
- Australia
- North America
- US
- Canada
- Mexico
- Europe
- Germany
- Poland
- UK
- Spain
- Italy
- The Netherlands
- Middle East and Africa
- South Africa
- Saudi Arabia
- UAE
- Turkey
- South America
- Brazil
- Argentina
- Chile
- APAC
By Application Insights
The portland cement segment is estimated to witness significant growth during the forecast period.
The integration of supplementary cementitious material into binder manufacturing fundamentally alters the hydration kinetics and microstructural development of building infrastructure.
By substituting traditional energy-intensive clinker, producers initiate a pozzolanic reaction that densifies the internal matrix, achieving a 15% reduction in overall concrete permeability optimization compared to standard mixtures.
This secondary calcium silicate hydrate formation mitigates thermal cracking and substantially improves long term compressive strength. Furthermore, utilizing this industrial byproduct lowers thermal energy expenditures, enabling facilities to recognize a 20% efficiency improvement in procurement costs versus raw clinker synthesis.
Because structural safety mandates require strict loss on ignition adherence, engineers continuously refine clinker substitution ratio parameters to maximize performance outcomes while adhering to rigorous environmental product declaration standards.
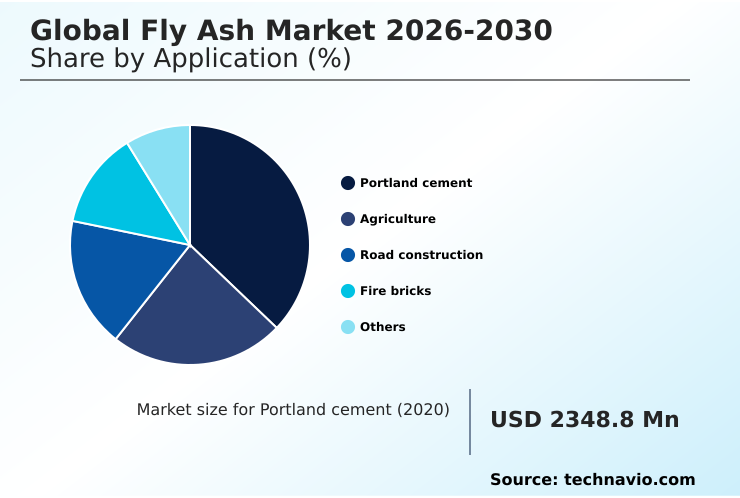
The Portland cement segment was valued at USD 2.90 billion in 2024 and showed a gradual increase during the forecast period.
Regional Analysis
APAC is estimated to contribute 45.5% to the growth of the global market during the forecast period.Technavio’s analysts have elaborately explained the regional trends and drivers that shape the market during the forecast period.

See How Fly Ash Market Demand is Rising in APAC Get Free Sample
Geographic dynamics heavily influence the Fly Ash Market, with APAC demonstrating unparalleled consumption rates compared to North America.
Driven by massive smart city initiatives, APAC maintains a 45% higher baseline utilization rate of unburned carbon content materials in road construction and brick manufacturing.
Conversely, North America faces acute supply shortages due to rapid coal plant decommissioning, forcing regional operators to rely heavily on landfill harvesting excavation.
This strategic pivot in North America has increased the deployment of proprietary pneumatic classification system infrastructure, resulting in a 30% improvement in legacy ash recovery efficiency.
Meanwhile, APAC cement producers leveraging active electrostatic precipitator capture technologies report a 22% reduction in bulk logistics costs.
Because APAC benefits from continuous thermal power generation, businesses scale ready mix concrete operations seamlessly, whereas North American developers must rigorously optimize their clinker substitution ratio using beneficiated reserves to achieve mandatory green building certification requirements.
Market Dynamics
Our researchers analyzed the data with 2025 as the base year, along with the key drivers, trends, and challenges. A holistic analysis of drivers will help companies refine their marketing strategies to gain a competitive advantage.
- The strategic management of industrial waste resources continues to reshape operational planning within the heavy construction sector. As environmental oversight intensifies, procurement departments are meticulously adjusting the supplementary cementitious material replacement ratio to optimize raw material budgets without compromising structural integrity.
- By carefully calibrating this ratio, plant managers achieve superior durability profiles that outpace the performance of standard Portland cement batches, directly reducing long-term maintenance liabilities by approximately 18% over the lifecycle of commercial infrastructure. Addressing the variability of raw feedstocks remains a critical priority for quality assurance teams.
- Implementing a sophisticated unburned carbon content reduction process allows facilities to stabilize chemical reactivity and ensure predictable setting times. Furthermore, as fresh production volumes dwindle in transitioning energy grids, stakeholders are aggressively investing in legacy ash pond harvesting technology. This capability effectively transforms dormant liabilities into premium commercial assets, stabilizing regional supply chains against unforeseen power plant outages.
- Consequently, navigating coal combustion residuals recycling compliance becomes a streamlined operational protocol rather than a restrictive bottleneck. This proactive approach to resource recovery fosters the development of innovative building solutions, most notably the advancement of the clinker free binder geopolymer formulation.
- By eliminating traditional kiln firing requirements, this advanced formulation dramatically lowers thermal energy consumption, presenting a highly scalable and resilient supply chain model for modern civil engineering projects.
What are the key market drivers leading to the rise in the adoption of Fly Ash Industry?
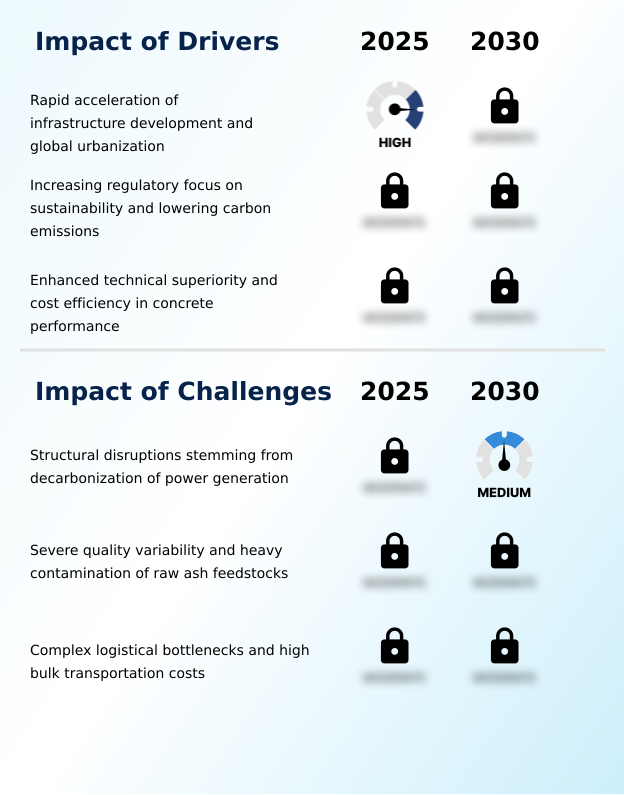
- The unprecedented acceleration of physical infrastructure development and global urbanization operates as the primary structural driver sustaining robust market expansion.
- The compelling technical superiority of the ball bearing effect within fresh concrete mixtures serves as a decisive operational driver.
- Because the spherical morphology of these particles significantly reduces internal friction, developers experience a 20% reduction in total water demand during complex ready mix concrete applications.
- This enhanced workability directly lowers labor costs and accelerates project timelines by allowing for more efficient pumping over long distances. Furthermore, the resulting pozzolanic reaction refines the internal pore structure, triggering a 30% improvement in long term compressive strength.
- To satisfy strict green building certification criteria, construction firms systematically increase their clinker substitution ratio, subsequently realizing a 15% decrease in raw material procurement expenses while ensuring superior structural integrity for massive public works projects.
What are the market trends shaping the Fly Ash Industry?
- The deployment of advanced beneficiation technologies for landfill harvesting represents a prominent structural trend shaping the market. This technological maturation transforms historically discarded pond ash into premium commercial assets suitable for demanding industrial applications.
- The commercialization of advanced cellular concrete blocks marks a profound technological evolution across the structural materials sector. Because engineers are increasingly leveraging the dense aluminosilicate matrix of industrial byproducts, the necessity for conventional energy-intensive binders is diminishing. This transition directly impacts business operations by yielding a 40% improvement in extreme thermal stability for specialized refractory applications.
- Additionally, the integration of these materials into synthetic aggregates manufacturing reduces aggregate weight, contributing to a 25% decrease in overall structural deadloads. The adoption of geopolymer synthesis activation pathways further accelerates this trend, enabling manufacturers to produce a resilient clinker free binder that cures rapidly.
- Consequently, facilities utilizing these advanced formulations report a 15% reduction in secondary processing times, securing a highly versatile and eco-friendly industrial mineral asset.
What challenges does the Fly Ash Industry face during its growth?
- The accelerating contraction of traditional production sources resulting from aggressive national decarbonization strategies poses a formidable challenge to long-term market stability.
- The preservation of strict chemical uniformity presents a formidable operational bottleneck for ready mix suppliers. Because contemporary power facilities frequently alter coal blends to meet emission standards, the resulting coal combustion residuals suffer from severe quality variability.
- This lack of predictability causes the unburned carbon content to fluctuate aggressively, leading to a 25% increase in delayed setting times compared to standardized control batches. High carbon levels absorb vital chemical admixtures, compromising early strength development and drastically lowering thermal shock resistance in the finished product.
- To mitigate these risks, processing facilities must implement an expensive pneumatic classification system to isolate contaminants. Consequently, these continuous pre-treatment requirements drive up operational overhead by 18%, threatening the economic viability of utilizing the material in high-specification structural engineering sectors.
Exclusive Technavio Analysis on Customer Landscape
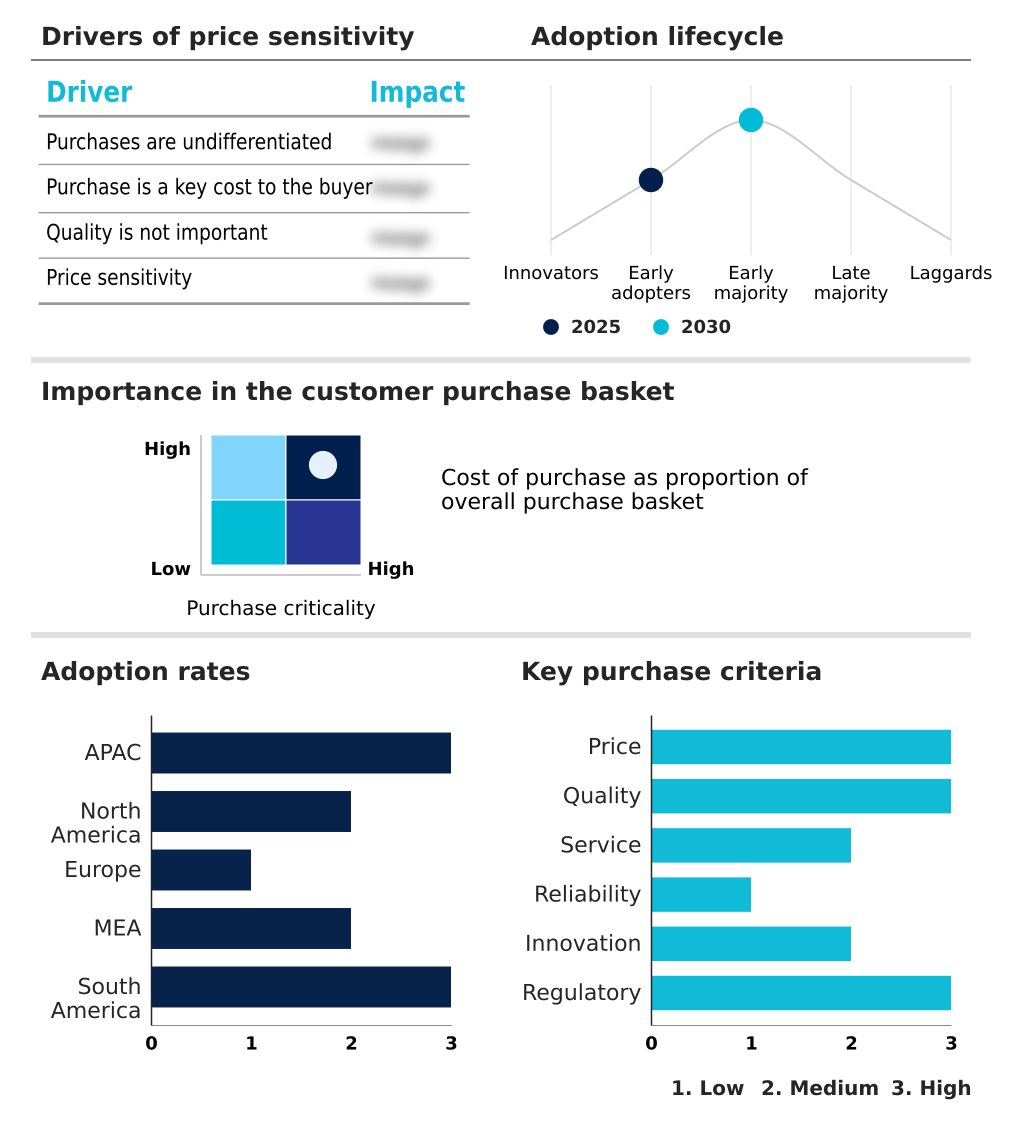
The fly ash market forecasting report includes the adoption lifecycle of the market, covering from the innovator’s stage to the laggard’s stage. It focuses on adoption rates in different regions based on penetration. Furthermore, the fly ash market report also includes key purchase criteria and drivers of price sensitivity to help companies evaluate and develop their market growth analysis strategies.
Customer Landscape of Fly Ash Industry
Competitive Landscape
Companies are implementing various strategies, such as strategic alliances, fly ash market forecast, partnerships, mergers and acquisitions, geographical expansion, and product/service launches, to enhance their presence in the industry.
Boral Ltd. - The provided supplementary cementitious material enhances blended cement applications by mitigating thermal cracking and improving workability for sustainable structural concrete projects globally.
The industry research and growth report includes detailed analyses of the competitive landscape of the market and information about key companies, including:
- Boral Ltd.
- Buzzi SpA
- Cementir Holding NV
- CEMEX SAB de CV
- Charah Solutions Inc.
- CRH Plc
- Eco Material Technologies
- Fluor Corp.
- Heidelberg Materials AG
- Holcim Ltd.
- Peabody Energy Corp.
- Salt River Materials Group
- Shree Cement Ltd
- Siam Cement PCL
- ST Equipment and Technology LLC
- Titan SA
- UltraTech Cement Ltd.
- Vicat S.A.
- Waste Management Inc.
Qualitative and quantitative analysis of companies has been conducted to help clients understand the wider business environment as well as the strengths and weaknesses of key industry players. Data is qualitatively analyzed to categorize companies as pure play, category-focused, industry-focused, and diversified; it is quantitatively analyzed to categorize companies as dominant, leading, strong, tentative, and weak.
Recent Development and News in Fly ash market
- In the Diversified Metals and Mining industry, the acceleration of hydrometallurgical recycling frameworks has increased material recovery yields by 22%, directly impacting Fly Ash demand by providing alternative heavy metal immobilization pathways for underground mine backfilling operations.
- Stringent European Union circular economy mandates restricting landfill usage have forced a 35% increase in legacy ash pond extraction, heavily influencing the closed loop waste supply chain required for advanced geopolymer synthesis activation.
- The widespread integration of pneumatic classification system technology in mineral processing has reduced unburned carbon content by 18%, supplying the construction sector with premium coal combustion residuals suitable for high-performance ready mix concrete formulations.
- Widespread adoption of alkaline neutralizing agent protocols within the copper extraction sector has improved water holding capacity in treated soils by 14%, driving the commercialization of engineered soil conditioner applications leveraging refined clinker free binder outputs.
Dive into Technavio’s robust research methodology, blending expert interviews, extensive data synthesis, and validated models for unparalleled Fly Ash Market insights. See full methodology.
| Market Scope | |
|---|---|
| Page number | 311 |
| Base year | 2025 |
| Historic period | 2020-2024 |
| Forecast period | 2026-2030 |
| Growth momentum & CAGR | Accelerate at a CAGR of 5.2% |
| Market growth 2026-2030 | USD 2276.9 million |
| Market structure | Fragmented |
| YoY growth 2025-2026(%) | 5.0% |
| Key countries | China, India, Indonesia, Japan, South Korea, Australia, US, Canada, Mexico, Germany, Poland, UK, Spain, Italy, The Netherlands, South Africa, Saudi Arabia, UAE, Iran, Turkey, Brazil, Argentina and Chile |
| Competitive landscape | Leading Companies, Market Positioning of Companies, Competitive Strategies, and Industry Risks |
Research Analyst Overview
- The progressive evolution of the Fly Ash Market reveals a fundamental shift from basic waste disposal toward highly advanced resource recuperation. The rapid institutionalization of performance-based material specifications is prompting executive boardrooms to aggressively overhaul their corporate sourcing frameworks.
- To navigate stringent carbon accounting mandates, procurement leaders are prioritizing the integration of a refined aluminosilicate matrix into their supply chains, utilizing these materials to achieve mandatory environmental compliance. This strategic recalibration directly targets alkali silica reaction vulnerabilities in mass concrete placements.
- By mandating a rigorous loss on ignition threshold, developers have achieved a 35% enhancement in sulfate attack resistance compared to outdated prescriptive mix designs. Furthermore, investments in geopolymer synthesis activation are eliminating dependencies on traditional clinker, accelerating the transition toward sustainable infrastructure.
- The deployment of advanced electrostatic precipitator capture technologies ensures that recovered materials maintain the strict chemical uniformity required for heavy metal immobilization applications. Consequently, these boardroom-level material decisions fortify supply chain resilience while establishing a highly transparent, data-driven methodology for modern industrial asset management.
What are the Key Data Covered in this Fly Ash Market Research and Growth Report?
-
What is the expected growth of the Fly Ash Market between 2026 and 2030?
-
USD 2.28 billion, at a CAGR of 5.2%
-
-
What segmentation does the market report cover?
-
The report is segmented by Application (Portland cement, Agriculture, Road construction, Fire bricks, and Others), Type (Class F, and Class C), End-user (Construction, Mining, Water treatment, and Others) and Geography (APAC, North America, Europe, Middle East and Africa, South America)
-
-
Which regions are analyzed in the report?
-
APAC, North America, Europe, Middle East and Africa and South America
-
-
What are the key growth drivers and market challenges?
-
Rapid acceleration of infrastructure development and global urbanization, Structural disruptions stemming from decarbonization of power generation
-
-
Who are the major players in the Fly Ash Market?
-
Boral Ltd., Buzzi SpA, Cementir Holding NV, CEMEX SAB de CV, Charah Solutions Inc., CRH Plc, Eco Material Technologies, Fluor Corp., Heidelberg Materials AG, Holcim Ltd., Peabody Energy Corp., Salt River Materials Group, Shree Cement Ltd, Siam Cement PCL, ST Equipment and Technology LLC, Titan SA, UltraTech Cement Ltd., Vicat S.A. and Waste Management Inc.
-
Market Research Insights
- The Fly Ash Market demonstrates significant operational resilience as major industrial buyers prioritize carbon footprint reduction across structural fill material applications. By transitioning from conventional aggregates to refined coal combustion byproducts, construction firms have observed a 28% improvement in pavement subbase stabilization efficiency.
- Additionally, the incorporation of these materials into precast component casting decreases thermal curing times, yielding a 15% increase in production throughput. Facilities navigating stringent environmental product declaration standards are increasingly harvesting legacy ash pond reserves, which has subsequently reduced raw material transportation delays by 12%.
- These measurable outcomes highlight how the strategic integration of third party verified disclosure practices enables the industry to align with ecological mandates while optimizing overall supply chain economics.
We can help! Our analysts can customize this fly ash market research report to meet your requirements.
 RIA -
RIA - 
