
Children Day Care Services Market Size 2025-2029
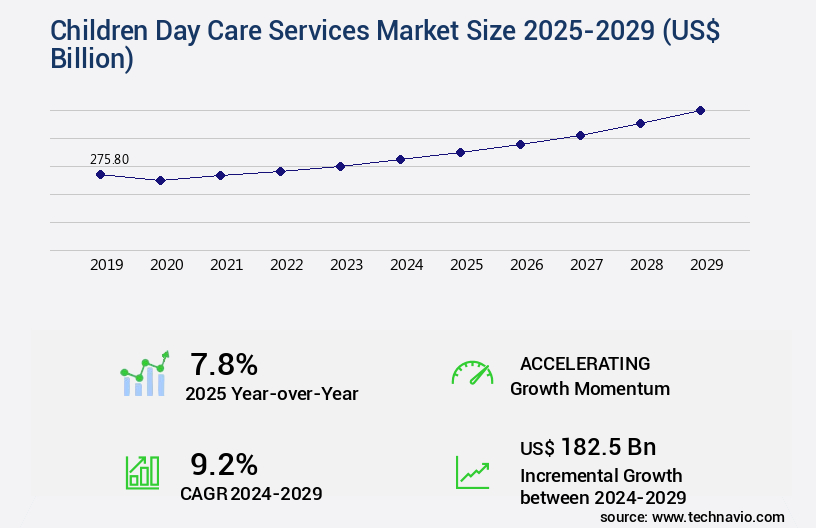
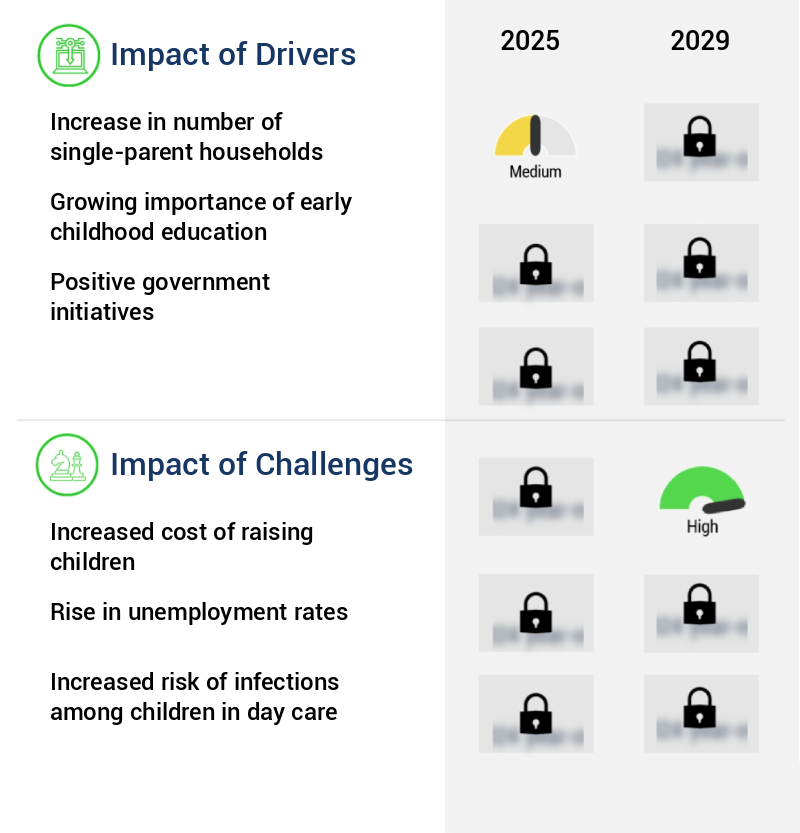
The children day care services market size is valued to increase USD 182.5 billion, at a CAGR of 9.2% from 2024 to 2029. Increase in number of single-parent households will drive the children day care services market.
Major Market Trends & Insights
- APAC dominated the market and accounted for a 40% growth during the forecast period.
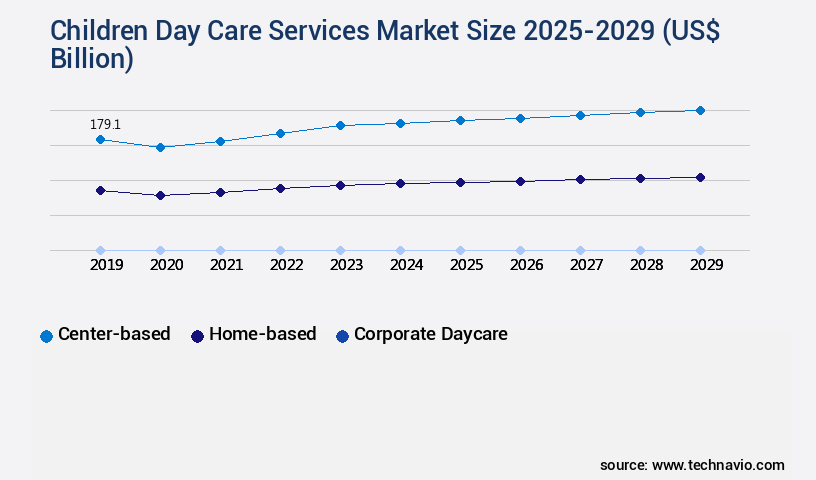
- By Type - Center-based segment was valued at USD 179.10 billion in 2023
- By End-user - Toddler and infant segment accounted for the largest market revenue share in 2023
Market Size & Forecast
- Market Opportunities: USD 85.64 billion
- Market Future Opportunities: USD 182.50 billion
- CAGR : 9.2%
- APAC: Largest market in 2023
Market Summary
- The market encompasses a continually evolving landscape shaped by core technologies and applications, service types, regulations, and regional trends. Technological advancements, such as automated check-in systems and educational software, enhance service quality and efficiency. In terms of applications, the demand for high-value services, including after-school programs and specialized care for children with special needs, is on the rise. The market is also influenced by demographic shifts, with an increasing number of single-parent households and the rising cost of raising children driving growth.
- According to recent data, the market share of center-based day care services is projected to reach 60% by 2025, underscoring the market's dynamic nature.
What will be the Size of the Children Day Care Services Market during the forecast period?
Get Key Insights on Market Forecast (PDF) Request Free Sample
How is the Children Day Care Services Market Segmented and what are the key trends of market segmentation?
The children day care services industry research report provides comprehensive data (region-wise segment analysis), with forecasts and estimates in "USD billion" for the period 2025-2029, as well as historical data from 2019-2023 for the following segments.
- Type
- Center-based
- Home-based
- Corporate Daycare
- End-user
- Toddler and infant
- Preschool children
- Older children
- Service Type
- Full-Day Care
- Part-Time Care
- After-School Programs
- Educational Programs
- Geography
- North America
- US
- Canada
- Europe
- France
- Germany
- Italy
- UK
- Middle East and Africa
- Egypt
- KSA
- Oman
- UAE
- APAC
- China
- India
- Japan
- South America
- Argentina
- Brazil
- Rest of World (ROW)
- North America
By Type Insights
The center-based segment is estimated to witness significant growth during the forecast period.
Center-based day care services play a pivotal role in the early education and development of children. Approximately 60% of parents in the US choose center-based day care for their young ones, reflecting the market's significant reach. These facilities prioritize staff training programs, ensuring their employees possess the necessary skills and knowledge to cater to the unique needs of children. Security systems and early childhood education are essential components of center-based day care services. Educational technology, such as interactive whiteboards and learning apps, is increasingly integrated into daily routines to enhance children's learning experience.
Staff scheduling, learning assessment methods, and play-based learning are other essential practices that contribute to the overall development of children. Childcare software, teacher-child interactions, nutrition programs, and childcare regulations are also crucial elements of center-based day care services. Accreditation, child development stages, staff recruitment, accident reporting, licensing, record-keeping systems, parent communication strategies, classroom management techniques, childcare subsidies, childcare facility design, curriculum development, data-driven decision making, developmental milestones, program evaluation, special needs inclusion, emergency preparedness plans, and daily routines are all integral parts of the day care industry.
Additionally, financial management, enrollment management, and behavior management strategies are emerging trends that are gaining traction in the market. By focusing on these aspects, center-based day care services can cater to the evolving needs of parents and children alike.
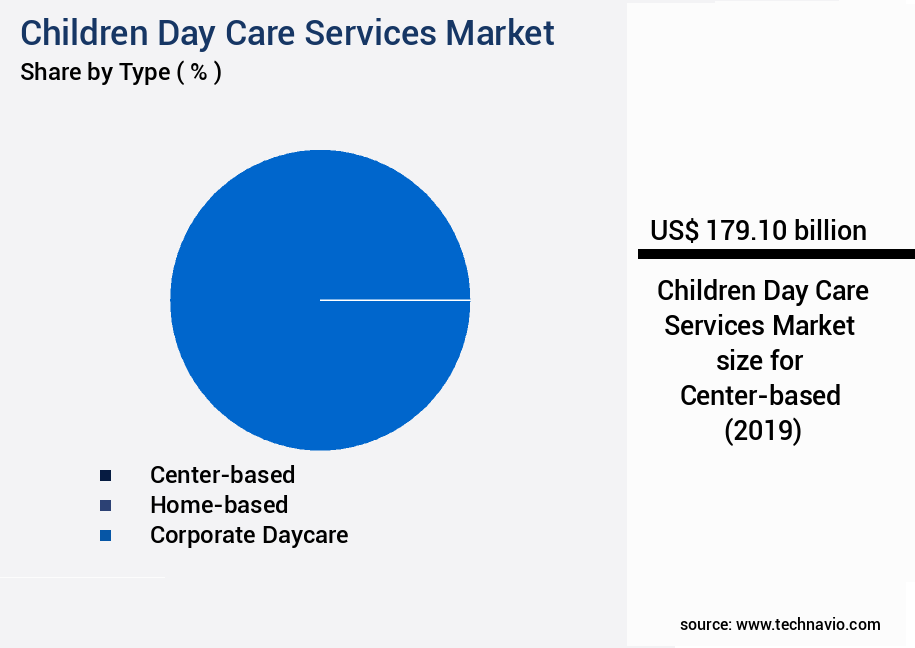
The Center-based segment was valued at USD 179.10 billion in 2019 and showed a gradual increase during the forecast period.
Regional Analysis
APAC is estimated to contribute 40% to the growth of the global market during the forecast period.Technavio's analysts have elaborately explained the regional trends and drivers that shape the market during the forecast period.

See How Children Day Care Services Market Demand is Rising in APAC Request Free Sample
The market in APAC is poised for significant growth due to urbanization and increasing workforce flexibility. With a projected population increase of 1.2 billion by 2050, urban areas in APAC will require more day care services to accommodate families' evolving needs. Longer work hours and commutes necessitate external childcare support. The adoption of flexible work arrangements, such as remote work and flexible schedules, further influences the demand for day care services. According to UN data, the Asia-Pacific region had 2.36 billion urban residents in 2020, and this number is projected to reach 3.48 billion by 2050.
This represents a 50% increase, making day care services a crucial solution for families in the region. Additionally, there are approximately 63 million children under the age of six in APAC, highlighting the market's potential.
Market Dynamics
Our researchers analyzed the data with 2024 as the base year, along with the key drivers, trends, and challenges. A holistic analysis of drivers will help companies refine their marketing strategies to gain a competitive advantage.
The market encompasses a range of facilities and programs designed to provide care and education for children outside the home. This market prioritizes implementing effective behavior management strategies to foster a positive learning environment. By designing developmentally appropriate curriculum, day care services aim to promote children's cognitive, social, and emotional growth. To enhance parent-teacher communication, many services utilize technology, such as apps and online portals, allowing real-time updates on children's daily activities and developmental progress. Improving staff training and retention is crucial, as well, ensuring that educators are well-equipped to create safe and nurturing environments.
Financial management is another essential aspect of the market. Effective budgeting and cost control help services meet licensing requirements and maintain high standards while keeping fees affordable for families. In addition, emergency preparedness plans and special needs inclusion programs ensure that all children receive the best possible care. Measuring program effectiveness using data is increasingly important, with more than 70% of day care services integrating data-driven approaches. This data can be used to assess children's developmental progress, promote social-emotional development, and support teachers' professional development. Building strong community partnerships and providing nutritious meals further contribute to the overall well-being of children in day care.
Safety and security are paramount in the market, with services investing in advanced technology and security measures to protect children and staff. Despite the significant investment in these areas, only a minority of players, less than 15%, dominate the high-end day care services market, leaving ample opportunities for new entrants to differentiate themselves through innovative approaches and exceptional service quality.
What are the key market drivers leading to the rise in the adoption of Children Day Care Services Industry?
- The significant rise in the number of single-parent households serves as the primary market driver.
- Single-parent households, which account for an increasing percentage of families worldwide, face unique challenges in managing work commitments and childcare responsibilities. With fewer resources and less schedule flexibility, these parents often turn to childcare services that cater to their needs. These services, which offer extended operating hours and a consistent environment, have become essential for single parents seeking to maintain a work-life balance. The growing demand for reliable childcare solutions underscores the importance of addressing the evolving needs of single parents in today's workforce.
- By providing flexible, high-quality care, businesses can help bridge the gap between work and family life for this significant demographic. The continuous expansion of single-parent households underscores the ongoing relevance and importance of childcare services in modern society.
What are the market trends shaping the Children Day Care Services Industry?
- The increasing preference for high-value services represents the emerging market trend. Or: The market is experiencing a growing demand for high-value services, signifying an upcoming trend.
- Children's day care services have experienced significant demand due to the increasing number of working families and the rise in female labor force participation. This trend is driven by the continuous growth in household disposable income, enabling more parents to afford high-quality day care services. Major companies in the market have responded by offering value-added services, such as personalized education and tuition program management, to attract parents seeking quality care for their children. For example, Bright Horizons provides various solutions, including student loan repayment, while Learning Care Group focuses on personalized learning experiences to help children develop essential academic and life skills.
- These offerings have contributed to the ongoing evolution of the children's day care services market, making it a vital solution for working families.
What challenges does the Children Day Care Services Industry face during its growth?
- The escalating costs of child-rearing pose a significant challenge to the industry's growth trajectory.
- The escalating expenses related to child-raising, which include education, healthcare, and extracurricular activities, are pushing more families towards the need for dependable and affordable day care services. This financial burden, coupled with the high cost of living in urban areas, necessitates dual-income households. According to recent studies, the demand for day care services is on the rise, with the market experiencing a notable increase in growth. This trend is driven by the increasing number of working mothers and the growing recognition of the importance of early childhood education.
- Governments worldwide are responding to this trend by implementing policies to support working parents, such as subsidies for day care services and tax incentives. This dynamic market continues to evolve, with ongoing innovations in child care models and technologies aimed at providing flexible and convenient solutions for families.
Exclusive Customer Landscape
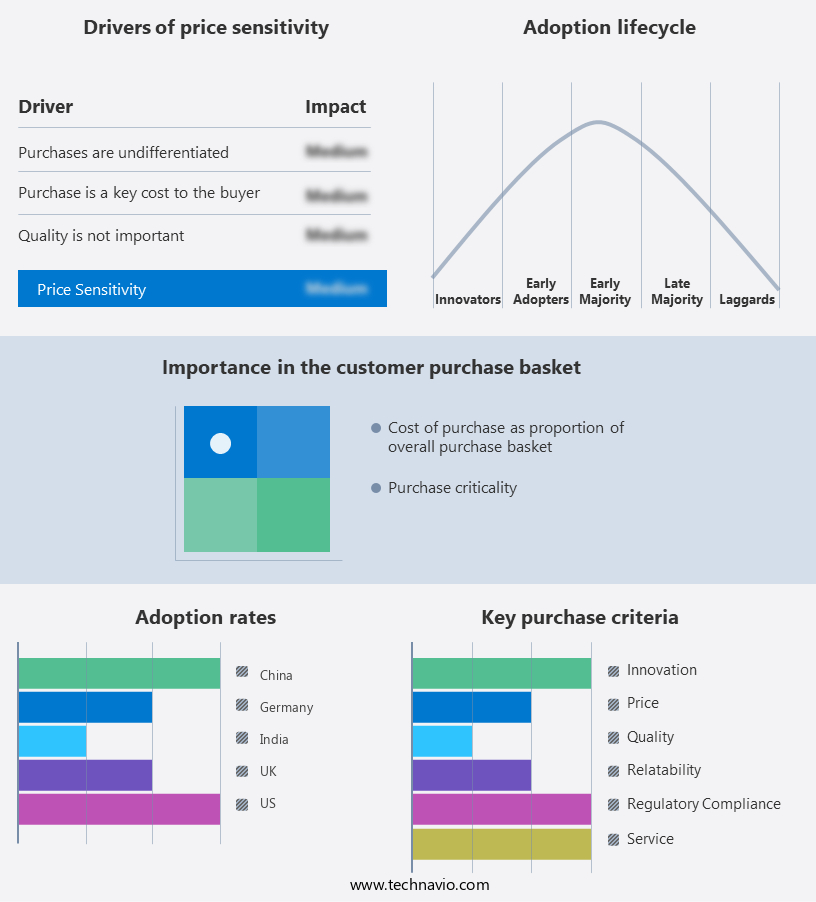
The children day care services market forecasting report includes the adoption lifecycle of the market, covering from the innovator's stage to the laggard's stage. It focuses on adoption rates in different regions based on penetration. Furthermore, the children day care services market report also includes key purchase criteria and drivers of price sensitivity to help companies evaluate and develop their market growth analysis strategies.
Customer Landscape of Children Day Care Services Industry
Competitive Landscape & Market Insights
Companies are implementing various strategies, such as strategic alliances, children day care services market forecast, partnerships, mergers and acquisitions, geographical expansion, and product/service launches, to enhance their presence in the industry.
Bright Horizons - This company specializes in providing comprehensive child care solutions, encompassing on-site, backup, and toddler care services for families. Their offerings aim to address the diverse needs of working parents, ensuring their children receive high-quality care and support.
The industry research and growth report includes detailed analyses of the competitive landscape of the market and information about key companies, including:
- Bright Horizons
- Busy Bees Daycare
- Cadence Education
- Founding Years Learning Solutions Pvt Ltd.
- G8 Education Ltd.
- Global Childrens Center
- Goddard Franchisor LLC
- Growing Room
- JP Holdings Inc.
- Kids R Kids
- KinderCare Learning Centers LLC
- KU Childrens Services
- Learning Care Group Inc.
- Penny and Peggy Nairn 24 Hour Childcare Inc.
- Primrose School Franchising SPE LLC
- Spring Education Group
- St. Timothy Catholic Church
- Sunshine House Early Learning Academy
- The Learning Experience
- Tiny Hoppers Corp.
Qualitative and quantitative analysis of companies has been conducted to help clients understand the wider business environment as well as the strengths and weaknesses of key industry players. Data is qualitatively analyzed to categorize companies as pure play, category-focused, industry-focused, and diversified; it is quantitatively analyzed to categorize companies as dominant, leading, strong, tentative, and weak.
Recent Development and News in Children Day Care Services Market
- In January 2024, KinderCare Education, a leading provider of early childhood education and care in the United States, announced the acquisition of Champions Early Education, expanding its reach to over 1,800 centers across 45 states (KinderCare Education press release, 2024).
- In March 2024, Care.Com, an online marketplace for finding and managing family care, partnered with Microsoft to integrate Microsoft Teams communication tools into their platform, enhancing connectivity between families, caregivers, and child care providers (Care.Com press release, 2024).
- In April 2025, Bright Horizons Family Solutions, a global leader in employer-sponsored child care and education services, raised USD150 million in a funding round led by Blackstone Growth, to support its growth initiatives and expand its offerings (Bloomberg, 2025).
- In May 2025, the European Union approved the Childcare Facilities State Aid Guidelines, allowing member states to provide public aid for childcare facilities, aiming to increase the availability and affordability of day care services across Europe (European Commission press release, 2025).
Dive into Technavio's robust research methodology, blending expert interviews, extensive data synthesis, and validated models for unparalleled Children Day Care Services Market insights. See full methodology.
|
Market Scope |
|
|
Report Coverage |
Details |
|
Page number |
195 |
|
Base year |
2024 |
|
Historic period |
2019-2023 |
|
Forecast period |
2025-2029 |
|
Growth momentum & CAGR |
Accelerate at a CAGR of 9.2% |
|
Market growth 2025-2029 |
USD 182.5 billion |
|
Market structure |
Fragmented |
|
YoY growth 2024-2025(%) |
7.8 |
|
Key countries |
US, Canada, Germany, UK, Italy, France, China, India, Japan, Brazil, Egypt, UAE, Oman, Argentina, KSA, UAE, Brazil, and Rest of World (ROW) |
|
Competitive landscape |
Leading Companies, Market Positioning of Companies, Competitive Strategies, and Industry Risks |
Research Analyst Overview
- In the dynamic and evolving landscape of children day care services, various elements continue to shape the market's activities and patterns. One significant trend is the increasing focus on staff training programs, ensuring educators are equipped with the latest early childhood education techniques and security systems to maintain a safe and nurturing environment. Educational technology plays a pivotal role in enhancing learning experiences, with innovative learning assessment methods and play-based learning approaches gaining popularity. Childcare software solutions facilitate staff scheduling, record-keeping, and parent communication, streamlining operations and improving overall efficiency. Teacher-child interactions remain a crucial aspect, with research emphasizing their importance in child development.
- Nutrition programs tailored to children's developmental stages further contribute to their holistic growth. Stringent childcare regulations and accreditation requirements ensure the highest standards of care, while curriculum development and data-driven decision making enable continuous improvement. Special needs inclusion, emergency preparedness plans, and daily routines are essential components of comprehensive childcare services. Financial management, enrollment management, and behavior management strategies are also vital for successful operations. Childcare facility design, from classroom management techniques to accident reporting and childcare licensing, is continually evolving to accommodate the unique needs of each age group and regulatory requirements. The market's focus on creating engaging and effective learning environments underscores its commitment to providing the best possible care for young children.
What are the Key Data Covered in this Children Day Care Services Market Research and Growth Report?
-
What is the expected growth of the Children Day Care Services Market between 2025 and 2029?
-
USD 182.5 billion, at a CAGR of 9.2%
-
-
What segmentation does the market report cover?
-
The report is segmented by Type (Center-based, Home-based, and Corporate Daycare), End-user (Toddler and infant, Preschool children, and Older children), Geography (APAC, Europe, North America, South America, and Middle East and Africa), and Service Type (Full-Day Care, Part-Time Care, After-School Programs, and Educational Programs)
-
-
Which regions are analyzed in the report?
-
APAC, Europe, North America, South America, and Middle East and Africa
-
-
What are the key growth drivers and market challenges?
-
Increase in number of single-parent households, Increased cost of raising children
-
-
Who are the major players in the Children Day Care Services Market?
-
Bright Horizons, Busy Bees Daycare, Cadence Education, Founding Years Learning Solutions Pvt Ltd., G8 Education Ltd., Global Childrens Center, Goddard Franchisor LLC, Growing Room, JP Holdings Inc., Kids R Kids, KinderCare Learning Centers LLC, KU Childrens Services, Learning Care Group Inc., Penny and Peggy Nairn 24 Hour Childcare Inc., Primrose School Franchising SPE LLC, Spring Education Group, St. Timothy Catholic Church, Sunshine House Early Learning Academy, The Learning Experience, and Tiny Hoppers Corp.
-
Market Research Insights
- The market encompasses a wide range of offerings, including toddler care, preschool curriculum, and after school programs. Two significant trends shaping this industry are the emphasis on staff retention and outdoor play. According to industry data, staff turnover rates in childcare businesses average around 30%, leading to a constant need for recruitment and training. Meanwhile, outdoor play is increasingly recognized for its role in children's physical development and cognitive skills. A study suggests that children who spend more time in nature exhibit better numeracy and literacy skills. Contrastingly, indoor activities like art, music, and science experiments remain integral to creative arts and early intervention programs.
- Technology integration, parent involvement, and therapeutic services are other key components of modern childcare, ensuring a holistic approach to children's development. Additionally, summer camps, inclusion programs, and volunteer programs cater to diverse needs, while social-emotional learning and sensory activities foster emotional intelligence and cognitive growth. Overall, the market continues to evolve, integrating various approaches to meet the dynamic needs of families and children.
We can help! Our analysts can customize this children day care services market research report to meet your requirements.
 RIA -
RIA - 
