
Christmas Tree Valve Market Size 2026-2030
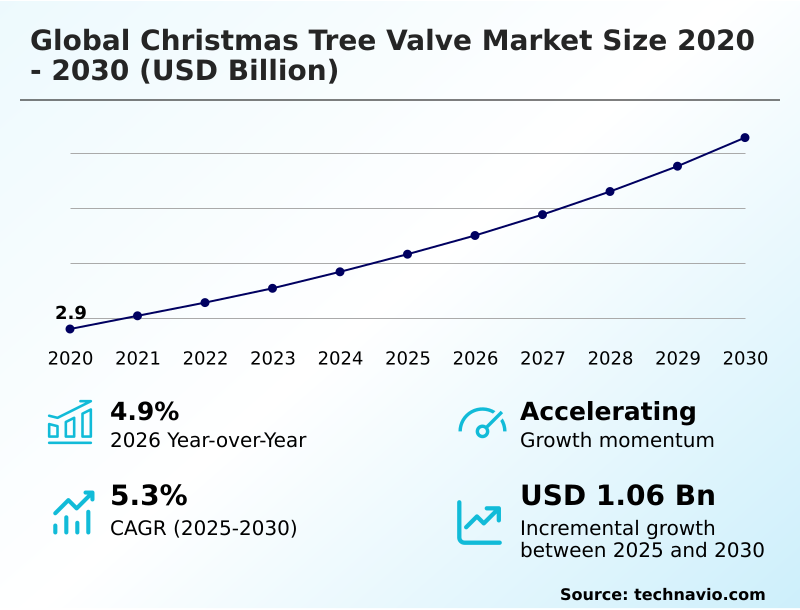
The christmas tree valve market size is valued to increase by USD 1.06 billion, at a CAGR of 5.3% from 2025 to 2030. Growing demand for oil and natural gas will drive the christmas tree valve market.
Major Market Trends & Insights
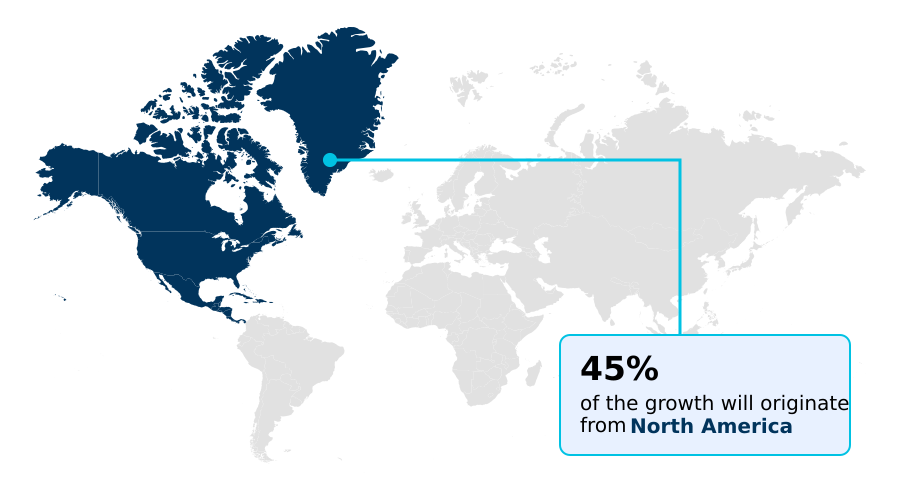
- North America dominated the market and accounted for a 45.4% growth during the forecast period.
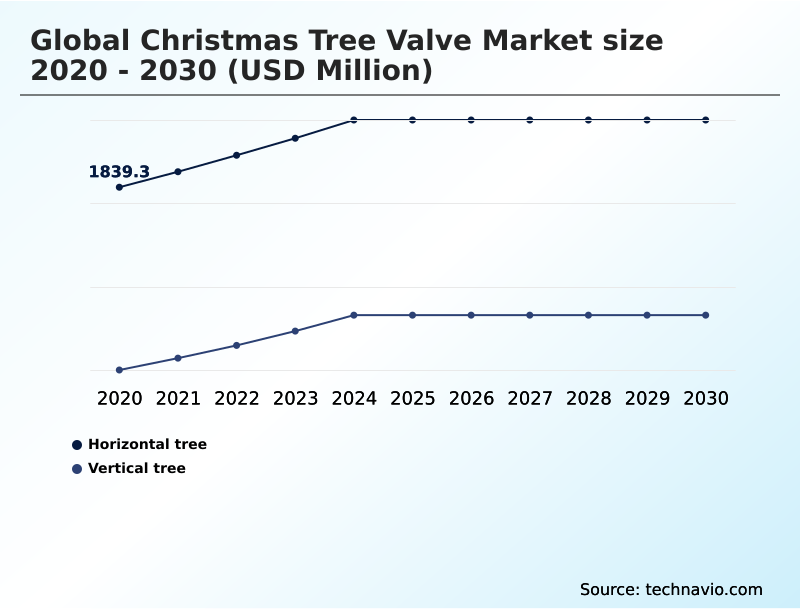
- By Type - Horizontal tree segment was valued at USD 2.13 billion in 2024
- By Location - Onshore segment accounted for the largest market revenue share in 2024
Market Size & Forecast
- Market Opportunities: USD 1.74 billion
- Market Future Opportunities: USD 1.06 billion
- CAGR from 2025 to 2030 : 5.3%
Market Summary
- The Christmas Tree Valve Market is defined by its critical role in ensuring safe and efficient hydrocarbon extraction from subsea and surface wells. This specialized equipment is integral to managing wellhead pressure and controlling the flow of oil and gas, with designs evolving to meet increasingly demanding operational environments.
- A key driver is the sustained global demand for energy, which pushes exploration into deeper offshore territories and promotes advanced techniques in unconventional onshore fields. Consequently, there is a marked trend toward high-specification systems capable of withstanding extreme pressures and temperatures.
- For instance, an operator managing a portfolio of aging offshore assets must balance capital expenditure on new high-pressure, high-temperature trees against the operational expense of more frequent interventions on older equipment. This decision framework is complicated by the need for advanced digitalization to enable predictive maintenance and minimize production downtime.
- The market's complexity is further compounded by stringent regulatory standards governing safety and environmental impact, which necessitates continuous innovation in materials science and valve design to mitigate risks and ensure compliance.
What will be the Size of the Christmas Tree Valve Market during the forecast period?
Get Key Insights on Market Forecast (PDF) Get Free Sample
How is the Christmas Tree Valve Market Segmented?
The christmas tree valve industry research report provides comprehensive data (region-wise segment analysis), with forecasts and estimates in "USD million" for the period 2026-2030, as well as historical data from 2020-2024 for the following segments.
- Type
- Horizontal tree
- Vertical tree
- Location
- Onshore
- Offshore
- Product
- Manual valves
- Automatic valves
- Control valves
- Geography
- North America
- US
- Canada
- Mexico
- Europe
- UK
- Italy
- The Netherlands
- APAC
- China
- Australia
- India
- Middle East and Africa
- Saudi Arabia
- UAE
- South America
- Brazil
- Argentina
- Colombia
- Rest of World (ROW)
- North America
By Type Insights
The horizontal tree segment is estimated to witness significant growth during the forecast period.
The horizontal tree design is central to modern well lifecycle management, especially in challenging deepwater drilling environment scenarios.
This configuration allows for streamlined well intervention and workover operations by enabling access to the production tubing hanger without removing the main subsea tree systems.
This advantage directly supports operational expenditure reduction strategies; for instance, operators have reported a decrease in intervention vessel time by up to 30%, which significantly enhances production uptime.
The ongoing offshore infrastructure expansion and adoption of subsea processing integration technologies further cement the strategic value of this segment for maximizing asset performance.
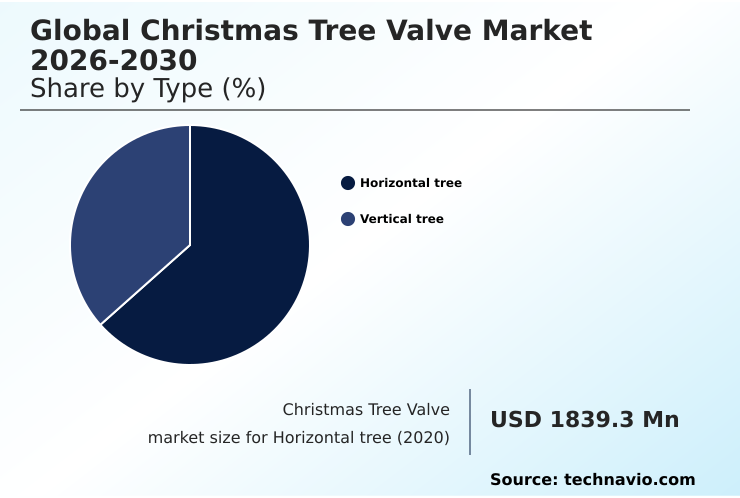
The Horizontal tree segment was valued at USD 2.13 billion in 2024 and showed a gradual increase during the forecast period.
Regional Analysis
North America is estimated to contribute 45.4% to the growth of the global market during the forecast period.Technavio’s analysts have elaborately explained the regional trends and drivers that shape the market during the forecast period.
See How Christmas Tree Valve Market Demand is Rising in North America Get Free Sample
The market's geographic distribution is led by North America, which is poised to contribute over 45% of the market's incremental growth, driven by activity in the US and Canada.
The region benefits from both offshore infrastructure expansion in deepwater zones and sustained onshore development requiring standard surface trees.
In these settings, adherence to strict API-6A compliance is non-negotiable for all equipment, including the tubing head spool and critical flow control solutions. Europe and APAC also represent significant markets, with the latter showing the highest regional growth rate.
Deployments in these areas increasingly utilize advanced diagnostic tools like the surface test tree and integrated subsea distribution units to optimize production, with some operators reporting a 15% improvement in diagnostic accuracy and subsequent intervention planning.
Market Dynamics
Our researchers analyzed the data with 2025 as the base year, along with the key drivers, trends, and challenges. A holistic analysis of drivers will help companies refine their marketing strategies to gain a competitive advantage.
- Strategic decision-making in the market hinges on selecting the appropriate technology for specific operational contexts. The choice between a horizontal tree for deepwater applications and a vertical tree for onshore shale plays is fundamental, impacting both initial capital outlay and long-term operational costs.
- For extreme environments, hpht christmas tree valve design is critical, necessitating the use of corrosion resistant alloys in subsea valves to ensure asset integrity. All equipment must align with industry standards, making api-6a compliant wellhead systems a baseline requirement. Modern systems integrate advanced wellhead pressure monitoring and control technologies, often managed through valve actuators for remote operations.
- The development of lightweight compact subsea tree systems and specialized shallow water christmas tree solutions addresses the need for cost-effective solutions in varied field architectures. Functionally, these systems improve flow control for hydraulic fracturing and support diagnostic activities using a surface test tree for well diagnostics.
- As the industry evolves, predictive maintenance for subsea valves becomes crucial, with data-driven insights guiding preventive maintenance for wellhead valves and valve refurbishment for mature fields. These efforts directly support well intervention cost reduction strategies. A key innovation is the subsea tree for interventionless workover, which can reduce workover-related downtime by more than 40% compared to conventional systems.
- Furthermore, the adaptation of the christmas tree valve for carbon capture and the use of an automated valve for methane emission control highlight the technology's role in the energy transition by enabling fugitive emissions reduction from valves. The design of the tubing hanger for horizontal trees is also a key area of innovation.
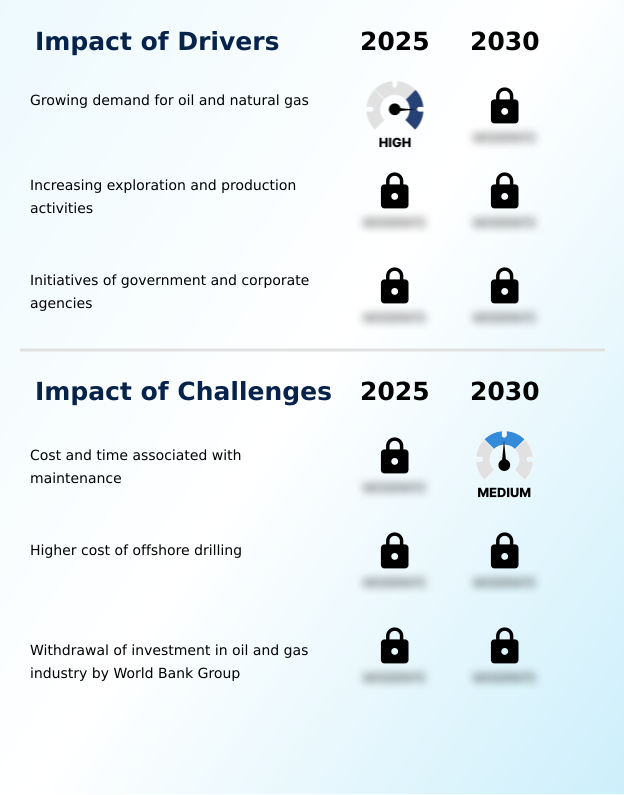
What are the key market drivers leading to the rise in the adoption of Christmas Tree Valve Industry?
- The market's growth is primarily propelled by the consistently rising global demand for oil and natural gas resources.
- Market momentum is sustained by robust upstream oil and gas operations, particularly the push into deepwater exploration and the optimization of unconventional shale plays. These activities demand sophisticated subsea production systems and durable onshore valve assembly configurations.
- For example, advances in vertical tree configuration have improved drilling efficiency in multi-well onshore pads by reducing installation time by 15%. The imperative for hydrocarbon extraction safety underpins demand for reliable equipment that enhances reservoir recovery rates.
- In parallel, effective hydraulic fracturing support from specialized wellhead equipment is crucial for unlocking resources, directly driving procurement of high-performance valve systems.
What are the market trends shaping the Christmas Tree Valve Industry?
- The expansion of crude oil exploration activities on a global scale is a significant emerging trend shaping the market's trajectory.
- A primary trend is the accelerated adoption of wellhead equipment digitization, which enables advanced remote monitoring solutions and comprehensive asset integrity management. This shift is driven by the need for improved wellhead pressure control and sophisticated flow assurance technology.
- For instance, the deployment of automated wellhead equipment with integrated sensors has been shown to improve leak detection rates by over 40% compared to traditional methods. Another key development is the growing preference for electric-actuated valves over hydraulic systems to achieve precise fugitive emissions control and support broader methane emissions reduction goals.
- These smart subsea tree systems, managed via topside control cabinets, enhance operational oversight and enable predictive analytics.
What challenges does the Christmas Tree Valve Industry face during its growth?
- The substantial cost and time investments associated with equipment maintenance represent a key challenge impacting industry growth.
- A persistent challenge involves managing the lifecycle of aging assets, which drives demand for aftermarket valve services and mature field optimization. The integrity of essential components like the annulus valve, master valve, and blowout preventer (BOP) is paramount for maintaining robust well control systems.
- Operators are increasingly implementing predictive maintenance strategy programs, which have been shown to reduce unplanned downtime by over 20%. However, the high cost of specialized corrosion resistant alloys and high-pressure high-temperature (HPHT) valves needed for repairs and upgrades creates budgetary constraints. Furthermore, integrating new wellbore technologies with legacy infrastructure presents significant technical hurdles.
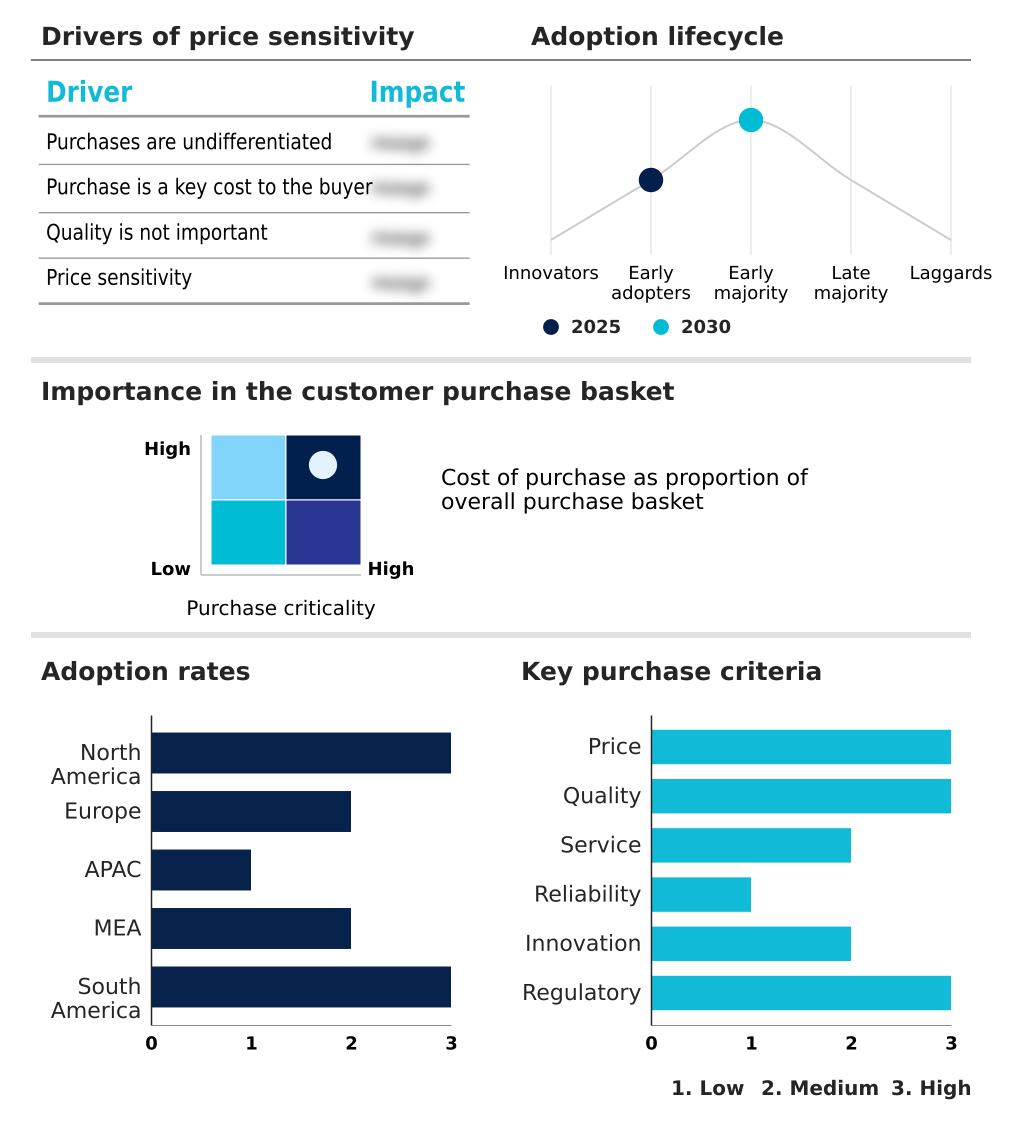
Exclusive Technavio Analysis on Customer Landscape
The christmas tree valve market forecasting report includes the adoption lifecycle of the market, covering from the innovator’s stage to the laggard’s stage. It focuses on adoption rates in different regions based on penetration. Furthermore, the christmas tree valve market report also includes key purchase criteria and drivers of price sensitivity to help companies evaluate and develop their market growth analysis strategies.
Customer Landscape of Christmas Tree Valve Industry
Competitive Landscape
Companies are implementing various strategies, such as strategic alliances, christmas tree valve market forecast, partnerships, mergers and acquisitions, geographical expansion, and product/service launches, to enhance their presence in the industry.
Aker Solutions ASA - Key offerings consist of christmas tree valves engineered for extreme temperature and pressure applications, addressing diverse horizontal and vertical well completions.
The industry research and growth report includes detailed analyses of the competitive landscape of the market and information about key companies, including:
- Aker Solutions ASA
- Anson Flow Corp.
- Babcock Valves
- Baker Hughes Co.
- Cactus Inc.
- Innovex
- Jiangsu Sanyi Equipment Co.
- Neway valve
- NOV Inc.
- Schlumberger Ltd.
- Shengji Group
- Stream Flo Industries Ltd.
- TechnipFMC plc
- Vatac Valve Corp
- Yantai Jereh Equipment Ltd.
Qualitative and quantitative analysis of companies has been conducted to help clients understand the wider business environment as well as the strengths and weaknesses of key industry players. Data is qualitatively analyzed to categorize companies as pure play, category-focused, industry-focused, and diversified; it is quantitatively analyzed to categorize companies as dominant, leading, strong, tentative, and weak.
Recent Development and News in Christmas tree valve market
- In August, 2024, Chevron announced the start of oil production at a new high-pressure anchor facility in the deepwater Gulf of Mexico, which required advanced subsea Christmas trees capable of handling pressures above 20,000 psi.
- In October, 2024, TechnipFMC plc launched its new JXT-Lite shallow water tree system, engineered to reduce installation time by 20% and lower capital expenditure for marginal field developments.
- In January, 2025, Schlumberger Ltd. acquired a subsea controls software firm to bolster its digital twin platforms, enhancing predictive maintenance capabilities for subsea christmas tree valve systems.
- In May, 2025, Baker Hughes Co. secured a contract to supply its Aptara lightweight compact trees for a major carbon capture and storage (CCS) project in the North Sea, signifying a critical expansion into new energy applications.
Dive into Technavio’s robust research methodology, blending expert interviews, extensive data synthesis, and validated models for unparalleled Christmas Tree Valve Market insights. See full methodology.
| Market Scope | |
|---|---|
| Page number | 277 |
| Base year | 2025 |
| Historic period | 2020-2024 |
| Forecast period | 2026-2030 |
| Growth momentum & CAGR | Accelerate at a CAGR of 5.3% |
| Market growth 2026-2030 | USD 1060.9 million |
| Market structure | Fragmented |
| YoY growth 2025-2026(%) | 4.9% |
| Key countries | US, Canada, Mexico, Norway, UK, Russia, Italy, The Netherlands, Spain, China, Australia, India, Indonesia, Malaysia, Thailand, Saudi Arabia, UAE, Nigeria, Angola, Qatar, Brazil, Argentina and Colombia |
| Competitive landscape | Leading Companies, Market Positioning of Companies, Competitive Strategies, and Industry Risks |
Research Analyst Overview
- The market's trajectory is dictated by a dual focus on maximizing recovery from existing assets and enabling economically viable deepwater exploration. A key boardroom decision involves balancing investment in advanced subsea production systems against the cost of upgrading aging onshore valve assembly infrastructure.
- This is influenced by the technical requirements of hydraulic fracturing support and the need for robust flow assurance technology. The specification of high-pressure high-temperature (HPHT) valves and specialized corrosion resistant alloys is no longer confined to frontier projects, with their use expanding to extend the life of mature fields.
- Core to operations is the integration of the production tubing hanger, annulus valve, master valve, and wing valve into cohesive subsea tree systems. Ensuring strict API-6A compliance across all components, from the tubing head spool to the blowout preventer (BOP), is a non-negotiable aspect of risk management. For diagnostics, the surface test tree remains a critical tool.
- Innovations in horizontal tree design and vertical tree configuration are driven by the need to reduce the frequency of well intervention and workover operations, with operators reporting that advanced designs can cut intervention costs by 20%. The adoption of electric-actuated valves and other flow control solutions also supports initiatives for fugitive emissions control.
What are the Key Data Covered in this Christmas Tree Valve Market Research and Growth Report?
-
What is the expected growth of the Christmas Tree Valve Market between 2026 and 2030?
-
USD 1.06 billion, at a CAGR of 5.3%
-
-
What segmentation does the market report cover?
-
The report is segmented by Type (Horizontal tree, and Vertical tree), Location (Onshore, and Offshore), Product (Manual valves, Automatic valves, and Control valves) and Geography (North America, Europe, APAC, Middle East and Africa, South America)
-
-
Which regions are analyzed in the report?
-
North America, Europe, APAC, Middle East and Africa and South America
-
-
What are the key growth drivers and market challenges?
-
Growing demand for oil and natural gas, Cost and time associated with maintenance
-
-
Who are the major players in the Christmas Tree Valve Market?
-
Aker Solutions ASA, Anson Flow Corp., Babcock Valves, Baker Hughes Co., Cactus Inc., Innovex, Jiangsu Sanyi Equipment Co., Neway valve, NOV Inc., Schlumberger Ltd., Shengji Group, Stream Flo Industries Ltd., TechnipFMC plc, Vatac Valve Corp and Yantai Jereh Equipment Ltd.
-
Market Research Insights
- Market dynamics are increasingly shaped by a focus on operational efficiency and asset longevity. The push for wellhead equipment digitization is central, with adoption enabling remote monitoring solutions that reduce manual intervention needs by over 25% in certain offshore applications. This transition supports robust asset integrity management and enhances hydrocarbon extraction safety.
- In parallel, offshore infrastructure expansion continues to drive demand, with regions like North America accounting for approximately 45% of incremental growth. The emphasis on methane emissions reduction is compelling a shift toward automated wellhead equipment and advanced electric-actuated valves, aligning operational goals with environmental compliance mandates that have tightened performance requirements.
We can help! Our analysts can customize this christmas tree valve market research report to meet your requirements.
 RIA -
RIA - 
